
|
|||||
|
 | |
| |
| |
| |
| |
| |
|
Gene: TP53 |
Gene summary for TP53 |
| Gene information | Species | Human | Gene symbol | TP53 | Gene ID | 7157 |
| Gene name | tumor protein p53 | |
| Gene Alias | BCC7 | |
| Cytomap | 17p13.1 | |
| Gene Type | protein-coding | GO ID | GO:0000002 | UniProtAcc | K7PPA8 |
Top |
Malignant transformation analysis |
| Identification of the aberrant gene expression in precancerous and cancerous lesions by comparing the gene expression of stem-like cells in diseased tissues with normal stem cells |
| Entrez ID | Symbol | Replicates | Species | Organ | Tissue | Adj P-value | Log2FC | Malignancy |
| 7157 | TP53 | HTA11_1938_2000001011 | Human | Colorectum | AD | 1.12e-07 | 5.41e-01 | -0.0811 |
| 7157 | TP53 | HTA11_347_2000001011 | Human | Colorectum | AD | 1.67e-06 | 4.80e-01 | -0.1954 |
| 7157 | TP53 | HTA11_696_2000001011 | Human | Colorectum | AD | 5.44e-06 | 4.00e-01 | -0.1464 |
| 7157 | TP53 | HTA11_866_2000001011 | Human | Colorectum | AD | 3.37e-03 | 3.24e-01 | -0.1001 |
| 7157 | TP53 | HTA11_1391_2000001011 | Human | Colorectum | AD | 1.12e-11 | 7.40e-01 | -0.059 |
| 7157 | TP53 | HTA11_546_2000001011 | Human | Colorectum | AD | 4.01e-05 | 6.45e-01 | -0.0842 |
| 7157 | TP53 | HTA11_866_3004761011 | Human | Colorectum | AD | 1.61e-15 | 6.64e-01 | 0.096 |
| 7157 | TP53 | HTA11_4255_2000001011 | Human | Colorectum | SER | 1.25e-05 | 7.18e-01 | 0.0446 |
| 7157 | TP53 | HTA11_9408_2000001011 | Human | Colorectum | AD | 4.97e-04 | 7.82e-01 | 0.0451 |
| 7157 | TP53 | HTA11_7663_2000001011 | Human | Colorectum | SER | 9.87e-05 | 5.68e-01 | 0.0131 |
| 7157 | TP53 | HTA11_10623_2000001011 | Human | Colorectum | AD | 2.01e-02 | 5.44e-01 | -0.0177 |
| 7157 | TP53 | HTA11_10711_2000001011 | Human | Colorectum | AD | 3.94e-04 | 3.99e-01 | 0.0338 |
| 7157 | TP53 | HTA11_7696_3000711011 | Human | Colorectum | AD | 1.22e-17 | 6.30e-01 | 0.0674 |
| 7157 | TP53 | HTA11_6818_2000001021 | Human | Colorectum | AD | 4.56e-05 | 5.34e-01 | 0.0588 |
| 7157 | TP53 | HTA11_99999970781_79442 | Human | Colorectum | MSS | 1.16e-09 | 4.47e-01 | 0.294 |
| 7157 | TP53 | HTA11_99999965062_69753 | Human | Colorectum | MSI-H | 2.26e-08 | 1.39e+00 | 0.3487 |
| 7157 | TP53 | HTA11_99999965104_69814 | Human | Colorectum | MSS | 1.02e-12 | 7.86e-01 | 0.281 |
| 7157 | TP53 | HTA11_99999971662_82457 | Human | Colorectum | MSS | 1.00e-08 | 5.52e-01 | 0.3859 |
| 7157 | TP53 | HTA11_99999974143_84620 | Human | Colorectum | MSS | 2.31e-08 | 4.10e-01 | 0.3005 |
| 7157 | TP53 | A015-C-203 | Human | Colorectum | FAP | 5.67e-03 | -1.50e-01 | -0.1294 |
| Page: 1 2 3 4 5 6 |
| Tissue | Expression Dynamics | Abbreviation |
| Colorectum (GSE201348) |  | FAP: Familial adenomatous polyposis |
| CRC: Colorectal cancer | ||
| Colorectum (HTA11) |  | AD: Adenomas |
| SER: Sessile serrated lesions | ||
| MSI-H: Microsatellite-high colorectal cancer | ||
| MSS: Microsatellite stable colorectal cancer | ||
| Esophagus | 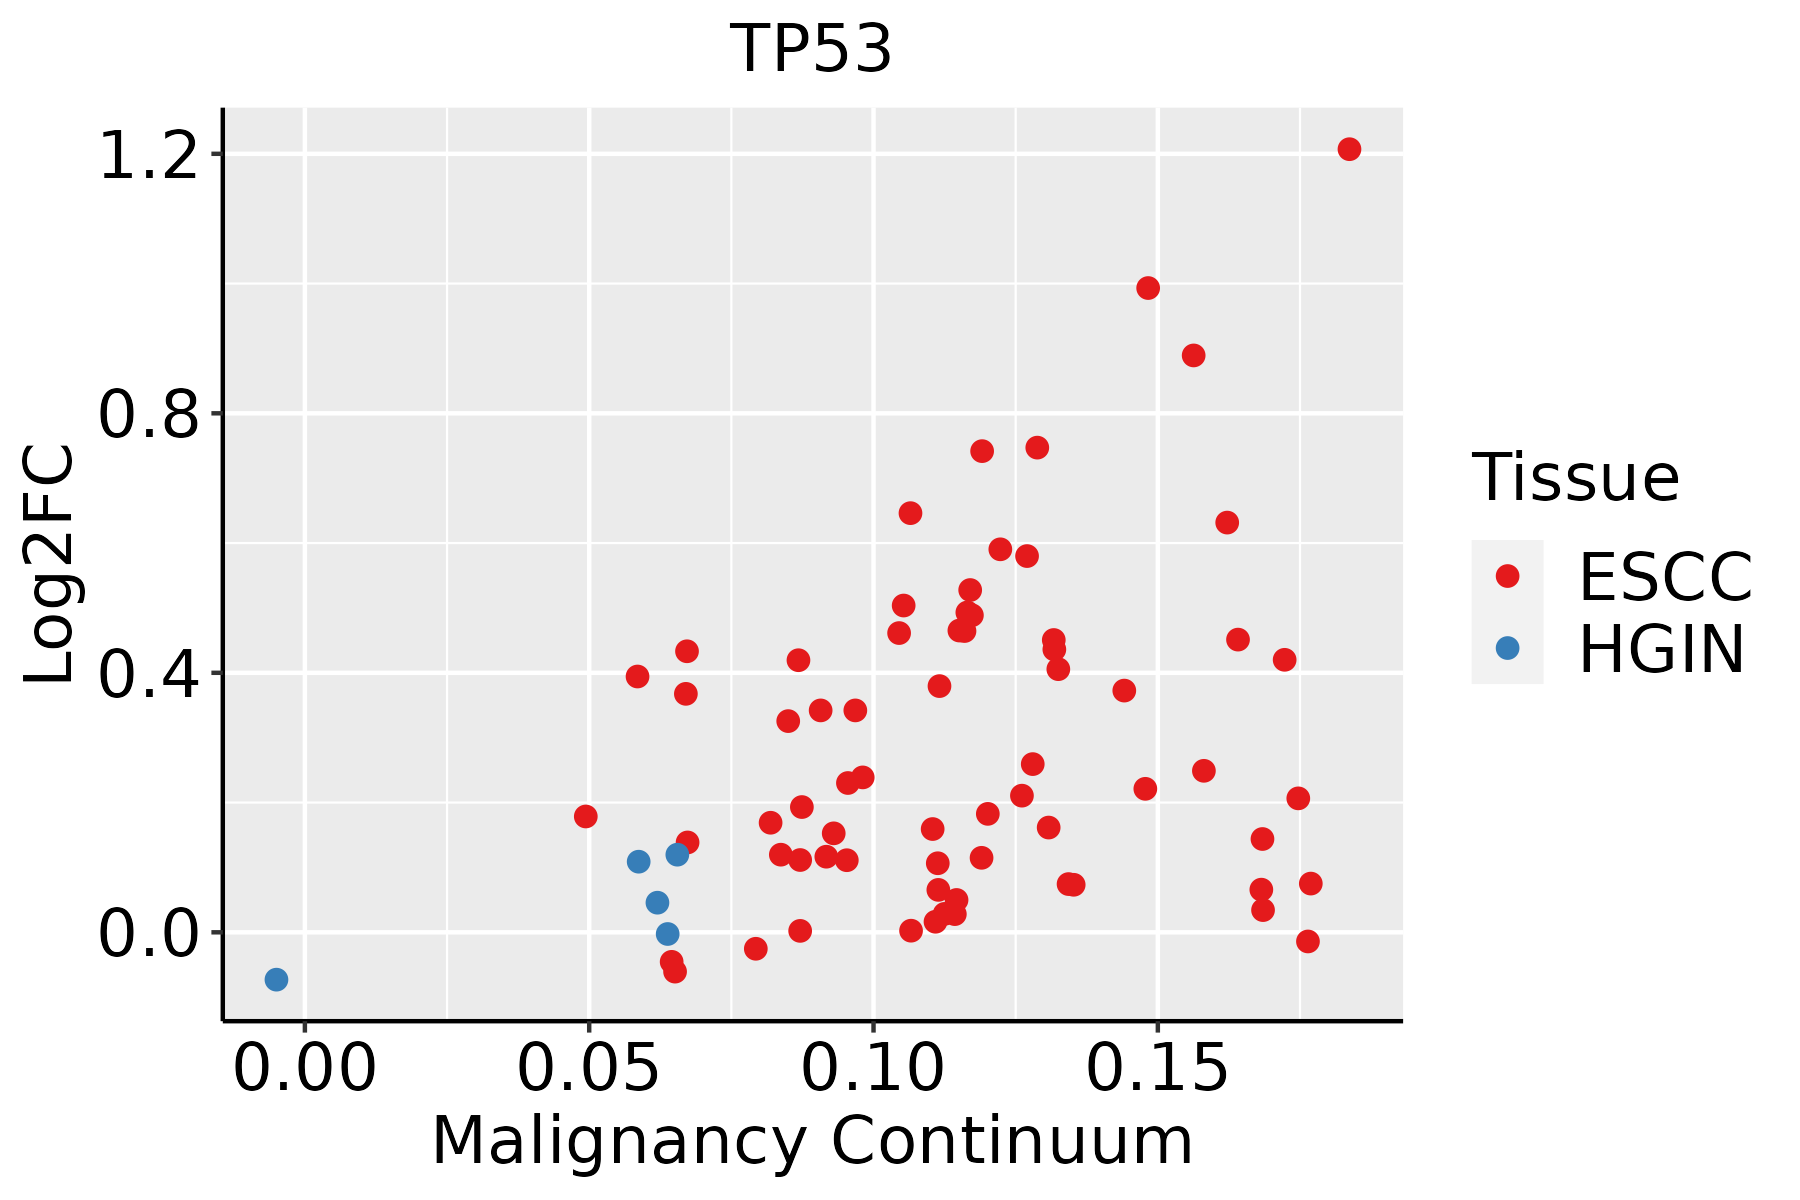 | ESCC: Esophageal squamous cell carcinoma |
| HGIN: High-grade intraepithelial neoplasias | ||
| LGIN: Low-grade intraepithelial neoplasias | ||
| Oral Cavity | 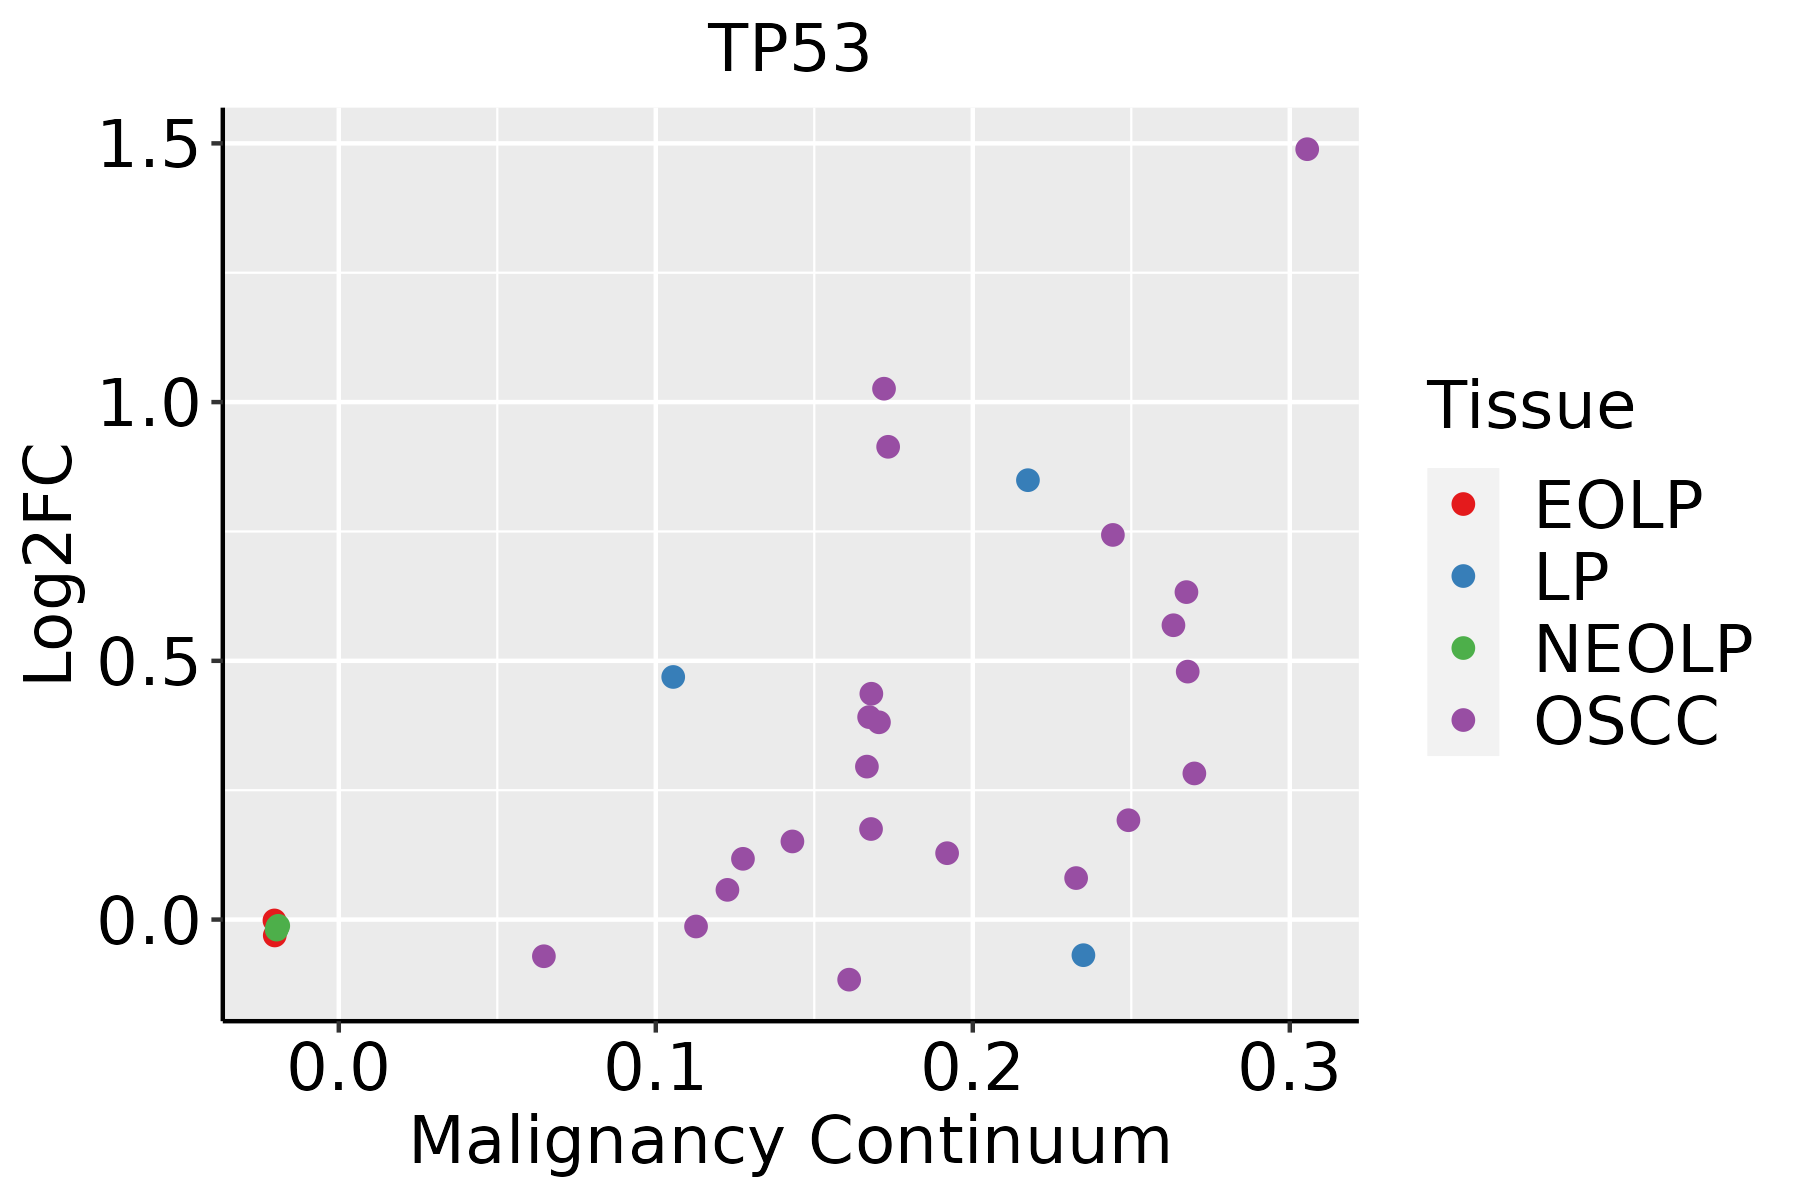 | EOLP: Erosive Oral lichen planus |
| LP: leukoplakia | ||
| NEOLP: Non-erosive oral lichen planus | ||
| OSCC: Oral squamous cell carcinoma | ||
| Skin | 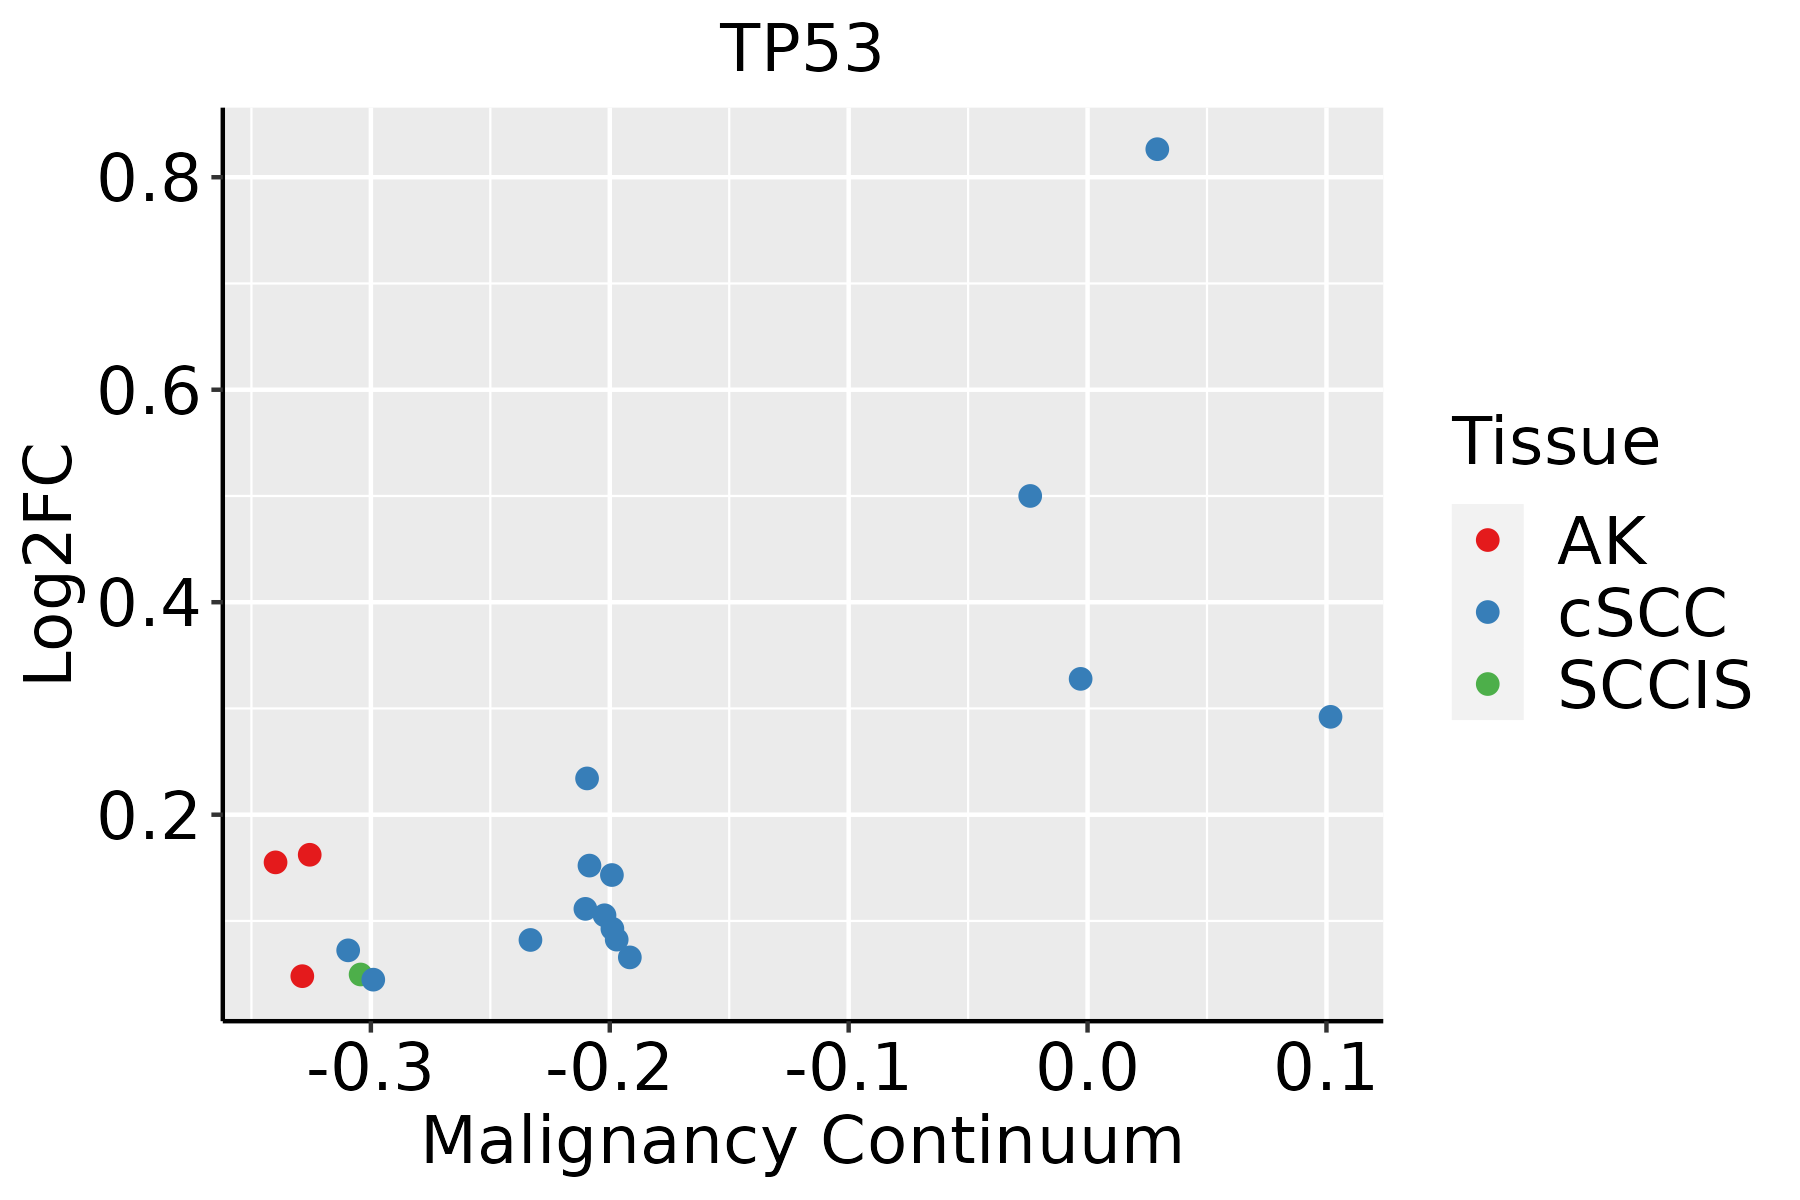 | AK: Actinic keratosis |
| cSCC: Cutaneous squamous cell carcinoma | ||
| SCCIS:squamous cell carcinoma in situ | ||
| Thyroid | 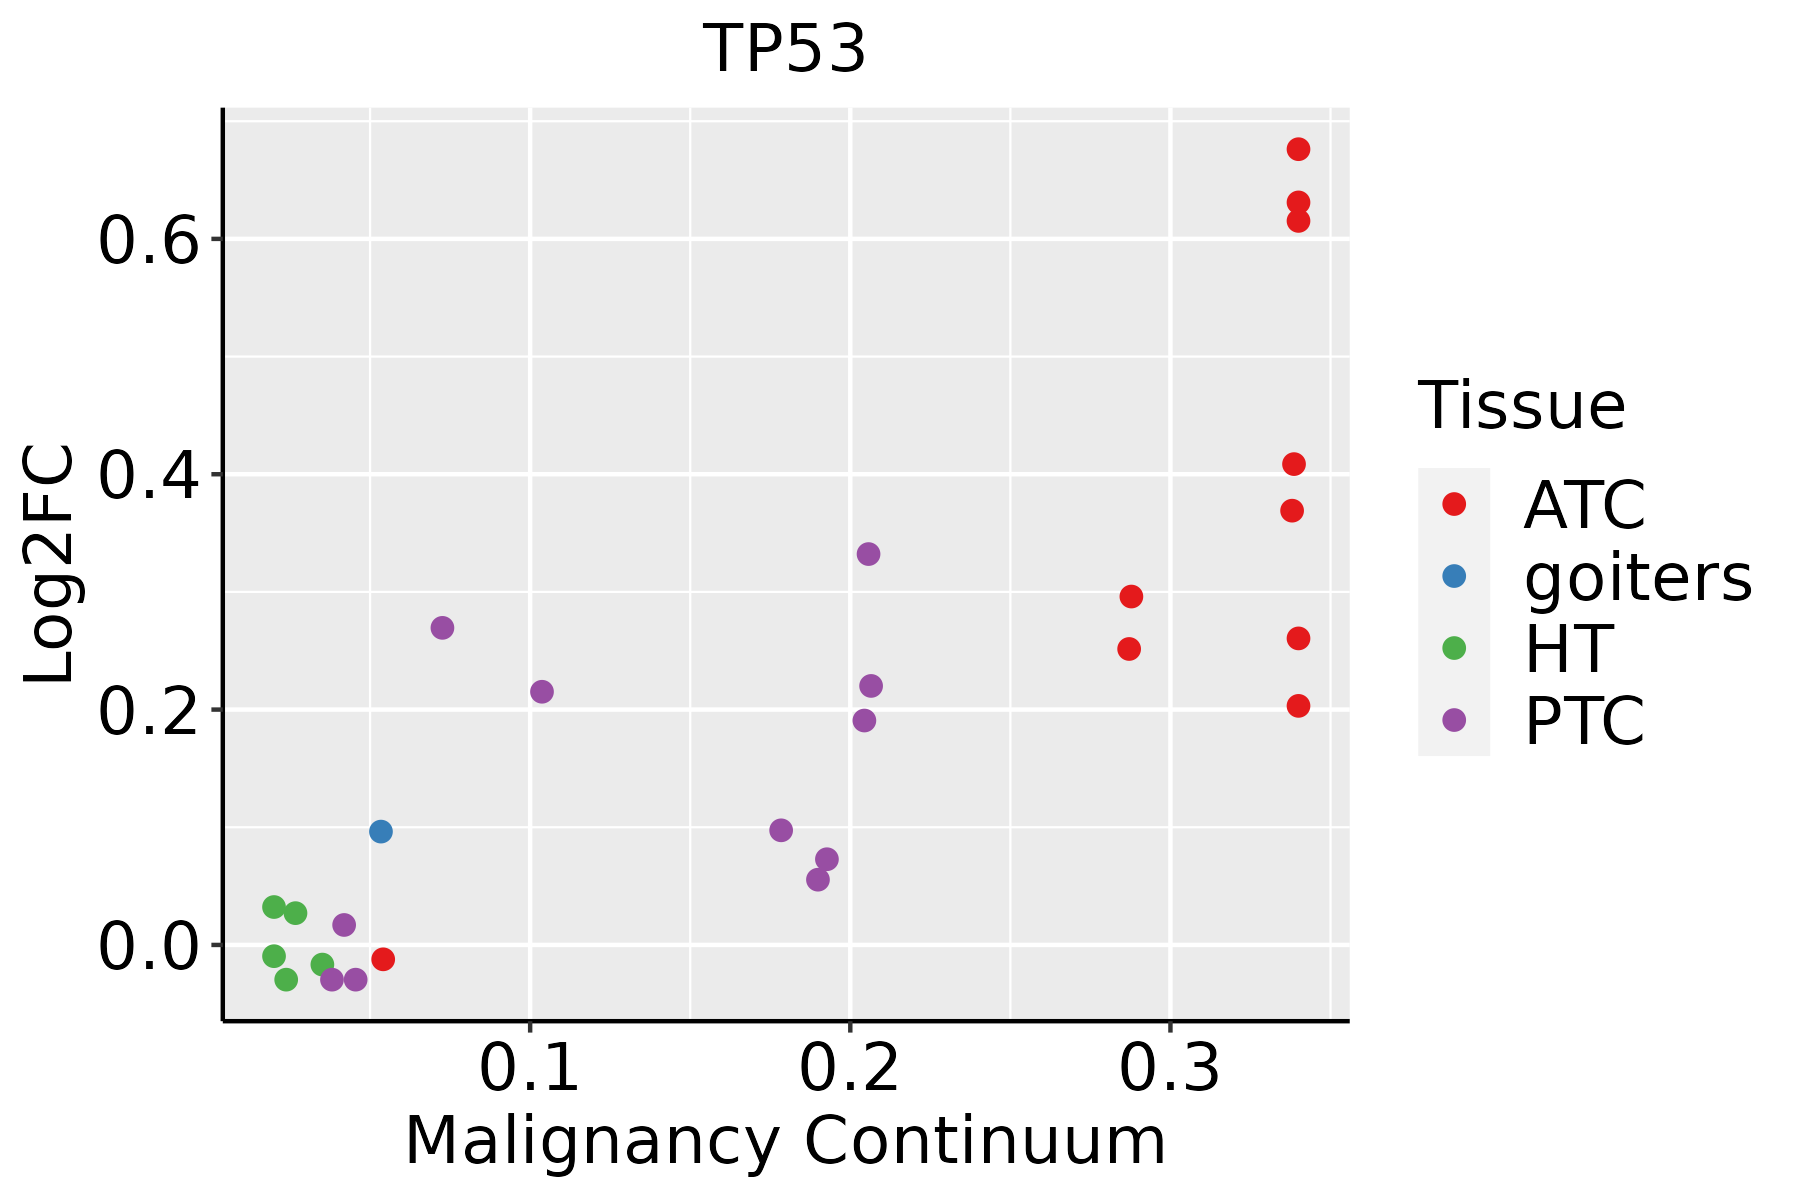 | ATC: Anaplastic thyroid cancer |
| HT: Hashimoto's thyroiditis | ||
| PTC: Papillary thyroid cancer |
| ∗log2FC in expression of this searched gene in stem-like cells from each diseased tissue sample relative to stem-like cells in normal samples in each tissue plotted against the malignancy continuum. Samples are colored based on if they are from different disease stage. |
Top |
Malignant transformation related pathway analysis |
| Find out the enriched GO biological processes and KEGG pathways involved in transition from healthy to precancer to cancer |
| Tissue | Disease Stage | Enriched GO biological Processes |
| Colorectum | AD |  |
| Colorectum | SER |  |
| Colorectum | MSS |  |
| Colorectum | MSI-H |  |
| Colorectum | FAP |  |
| ∗Top 15 enriched GO BP terms are showed in the bar plot of each disease state in each tissue. Each row represents a significant GO biological process which is colored according to the -log10(p.adjust). |
| Page: 1 2 3 4 5 6 7 8 9 |
| GO ID | Tissue | Disease Stage | Description | Gene Ratio | Bg Ratio | pvalue | p.adjust | Count |
| GO:00165753 | Oral cavity | OSCC | histone deacetylation | 54/7305 | 82/18723 | 7.68e-07 | 1.08e-05 | 54 |
| GO:00448436 | Oral cavity | OSCC | cell cycle G1/S phase transition | 131/7305 | 241/18723 | 8.77e-07 | 1.20e-05 | 131 |
| GO:004851116 | Oral cavity | OSCC | rhythmic process | 157/7305 | 298/18723 | 1.00e-06 | 1.36e-05 | 157 |
| GO:004586120 | Oral cavity | OSCC | negative regulation of proteolysis | 181/7305 | 351/18723 | 1.01e-06 | 1.37e-05 | 181 |
| GO:00109483 | Oral cavity | OSCC | negative regulation of cell cycle process | 155/7305 | 294/18723 | 1.11e-06 | 1.48e-05 | 155 |
| GO:00063991 | Oral cavity | OSCC | tRNA metabolic process | 101/7305 | 179/18723 | 1.65e-06 | 2.15e-05 | 101 |
| GO:0034349 | Oral cavity | OSCC | glial cell apoptotic process | 16/7305 | 17/18723 | 3.07e-06 | 3.72e-05 | 16 |
| GO:00071798 | Oral cavity | OSCC | transforming growth factor beta receptor signaling pathway | 109/7305 | 198/18723 | 3.21e-06 | 3.86e-05 | 109 |
| GO:004361820 | Oral cavity | OSCC | regulation of transcription from RNA polymerase II promoter in response to stress | 34/7305 | 47/18723 | 3.63e-06 | 4.32e-05 | 34 |
| GO:00332099 | Oral cavity | OSCC | tumor necrosis factor-mediated signaling pathway | 61/7305 | 99/18723 | 4.31e-06 | 4.98e-05 | 61 |
| GO:00343417 | Oral cavity | OSCC | response to interferon-gamma | 81/7305 | 141/18723 | 6.77e-06 | 7.43e-05 | 81 |
| GO:007145317 | Oral cavity | OSCC | cellular response to oxygen levels | 98/7305 | 177/18723 | 7.10e-06 | 7.75e-05 | 98 |
| GO:00063023 | Oral cavity | OSCC | double-strand break repair | 132/7305 | 251/18723 | 7.93e-06 | 8.52e-05 | 132 |
| GO:19031316 | Oral cavity | OSCC | mononuclear cell differentiation | 210/7305 | 426/18723 | 8.44e-06 | 9.02e-05 | 210 |
| GO:00315704 | Oral cavity | OSCC | DNA integrity checkpoint | 72/7305 | 123/18723 | 8.77e-06 | 9.31e-05 | 72 |
| GO:00357947 | Oral cavity | OSCC | positive regulation of mitochondrial membrane permeability | 31/7305 | 43/18723 | 1.10e-05 | 1.14e-04 | 31 |
| GO:00987811 | Oral cavity | OSCC | ncRNA transcription | 38/7305 | 56/18723 | 1.15e-05 | 1.18e-04 | 38 |
| GO:007121615 | Oral cavity | OSCC | cellular response to biotic stimulus | 129/7305 | 246/18723 | 1.20e-05 | 1.23e-04 | 129 |
| GO:00619127 | Oral cavity | OSCC | selective autophagy | 44/7305 | 68/18723 | 1.57e-05 | 1.57e-04 | 44 |
| GO:00108239 | Oral cavity | OSCC | negative regulation of mitochondrion organization | 34/7305 | 49/18723 | 1.59e-05 | 1.59e-04 | 34 |
| Page: 1 2 3 4 5 6 7 8 9 10 11 12 13 14 15 16 17 18 19 20 21 22 23 24 25 26 27 28 29 30 31 32 33 34 35 36 37 38 39 40 41 42 43 44 45 46 47 48 49 50 51 52 53 54 55 56 57 58 59 60 61 62 63 64 65 66 67 68 69 70 71 72 73 74 75 76 77 78 79 80 81 82 83 84 85 86 87 88 89 90 91 92 93 94 95 96 97 98 99 100 101 102 103 104 105 106 107 108 109 110 111 112 113 114 115 116 117 |
| Pathway ID | Tissue | Disease Stage | Description | Gene Ratio | Bg Ratio | pvalue | p.adjust | qvalue | Count |
| hsa05012 | Colorectum | AD | Parkinson disease | 147/2092 | 266/8465 | 2.53e-27 | 8.48e-25 | 5.41e-25 | 147 |
| hsa05016 | Colorectum | AD | Huntington disease | 147/2092 | 306/8465 | 1.93e-19 | 9.26e-18 | 5.91e-18 | 147 |
| hsa05014 | Colorectum | AD | Amyotrophic lateral sclerosis | 164/2092 | 364/8465 | 4.28e-18 | 1.27e-16 | 8.09e-17 | 164 |
| hsa05131 | Colorectum | AD | Shigellosis | 109/2092 | 247/8465 | 1.09e-11 | 2.44e-10 | 1.55e-10 | 109 |
| hsa04919 | Colorectum | AD | Thyroid hormone signaling pathway | 51/2092 | 121/8465 | 1.71e-05 | 1.73e-04 | 1.10e-04 | 51 |
| hsa04722 | Colorectum | AD | Neurotrophin signaling pathway | 50/2092 | 119/8465 | 2.28e-05 | 2.24e-04 | 1.43e-04 | 50 |
| hsa05213 | Colorectum | AD | Endometrial cancer | 29/2092 | 58/8465 | 2.69e-05 | 2.57e-04 | 1.64e-04 | 29 |
| hsa05216 | Colorectum | AD | Thyroid cancer | 21/2092 | 37/8465 | 3.05e-05 | 2.76e-04 | 1.76e-04 | 21 |
| hsa05230 | Colorectum | AD | Central carbon metabolism in cancer | 33/2092 | 70/8465 | 3.61e-05 | 3.19e-04 | 2.03e-04 | 33 |
| hsa05418 | Colorectum | AD | Fluid shear stress and atherosclerosis | 54/2092 | 139/8465 | 1.41e-04 | 1.16e-03 | 7.37e-04 | 54 |
| hsa04216 | Colorectum | AD | Ferroptosis | 21/2092 | 41/8465 | 2.23e-04 | 1.78e-03 | 1.13e-03 | 21 |
| hsa05210 | Colorectum | AD | Colorectal cancer | 35/2092 | 86/8465 | 7.54e-04 | 5.49e-03 | 3.50e-03 | 35 |
| hsa05417 | Colorectum | AD | Lipid and atherosclerosis | 73/2092 | 215/8465 | 1.31e-03 | 8.27e-03 | 5.27e-03 | 73 |
| hsa05205 | Colorectum | AD | Proteoglycans in cancer | 70/2092 | 205/8465 | 1.37e-03 | 8.46e-03 | 5.39e-03 | 70 |
| hsa05220 | Colorectum | AD | Chronic myeloid leukemia | 31/2092 | 76/8465 | 1.41e-03 | 8.46e-03 | 5.39e-03 | 31 |
| hsa05225 | Colorectum | AD | Hepatocellular carcinoma | 59/2092 | 168/8465 | 1.50e-03 | 8.69e-03 | 5.54e-03 | 59 |
| hsa05163 | Colorectum | AD | Human cytomegalovirus infection | 75/2092 | 225/8465 | 2.00e-03 | 1.10e-02 | 7.01e-03 | 75 |
| hsa04137 | Colorectum | AD | Mitophagy - animal | 29/2092 | 72/8465 | 2.49e-03 | 1.35e-02 | 8.59e-03 | 29 |
| hsa05160 | Colorectum | AD | Hepatitis C | 54/2092 | 157/8465 | 3.87e-03 | 1.96e-02 | 1.25e-02 | 54 |
| hsa04071 | Colorectum | AD | Sphingolipid signaling pathway | 43/2092 | 121/8465 | 4.83e-03 | 2.28e-02 | 1.45e-02 | 43 |
| Page: 1 2 3 4 5 6 7 8 9 10 11 12 13 14 15 16 17 18 19 20 21 22 23 |
Top |
Cell-cell communication analysis |
| Identification of potential cell-cell interactions between two cell types and their ligand-receptor pairs for different disease states |
| Ligand | Receptor | LRpair | Pathway | Tissue | Disease Stage |
| Page: 1 |
Top |
Single-cell gene regulatory network inference analysis |
| Find out the significant the regulons (TFs) and the target genes of each regulon across cell types for different disease states |
| TF | Cell Type | Tissue | Disease Stage | Target Gene | RSS | Regulon Activity |
| TP53 | MSC | Breast | DCIS | ATP1B2,CTNNB1,F2R, etc. | 1.47e-02 |  |
| TP53 | FIB | Breast | Healthy | ATP1B2,CTNNB1,F2R, etc. | 4.25e-02 |  |
| TP53 | FIB | Breast | Precancer | ATP1B2,CTNNB1,F2R, etc. | 1.56e-02 |  |
| TP53 | ASC | Colorectum | ADJ | CATSPERE,AP000446.1,TMEM69, etc. | 1.30e-01 |  |
| TP53 | TAC | Colorectum | Healthy | ESYT1,ATAD5,GNL3, etc. | 7.42e-02 |  |
| TP53 | CD8TEXINT | Lung | AAH | APOLD1,RAB27A,PHACTR2-AS1, etc. | 3.56e-01 |  |
| TP53 | TH1 | Lung | Healthy | TRAT1,MRPL43,LSM14A, etc. | 8.15e-03 |  |
| TP53 | CD8TCM | Lung | IAC | TTC4,ELMOD3,RNASE1, etc. | 4.42e-02 |  |
| TP53 | CD8TEFF | Lung | IAC | TTC4,ELMOD3,RNASE1, etc. | 3.87e-02 | |
| TP53 | PVA | Lung | Healthy | HDX,LINC00960,NHEJ1, etc. | 1.10e-01 | |
| ∗The dot plots of a searched regulon are shown for all cell subpopulations in each disease state of each tissue based on the regulon specific score inferred using pySCENIC and by calculating the average expression. |
| Page: 1 2 |
Top |
Somatic mutation of malignant transformation related genes |
| Annotation of somatic variants for genes involved in malignant transformation |
| Hugo Symbol | Variant Class | Variant Classification | dbSNP RS | HGVSc | HGVSp | HGVSp Short | SWISSPROT | BIOTYPE | SIFT | PolyPhen | Tumor Sample Barcode | Tissue | Histology | Sex | Age | Stage | Therapy Types | Drugs | Outcome |
| TP53 | SNV | Missense_Mutation | rs28934578 | c.524N>A | p.Arg175His | p.R175H | P04637 | protein_coding | tolerated(0.11) | benign(0.319) | TCGA-A1-A0SI-01 | Breast | breast invasive carcinoma | Female | <65 | I/II | Unknown | Unknown | SD |
| TP53 | SNV | Missense_Mutation | c.398N>A | p.Met133Lys | p.M133K | P04637 | protein_coding | deleterious(0) | benign(0.061) | TCGA-A1-A0SK-01 | Breast | breast invasive carcinoma | Female | <65 | I/II | Unknown | Unknown | PD | |
| TP53 | SNV | Missense_Mutation | rs121912666 | c.659A>G | p.Tyr220Cys | p.Y220C | P04637 | protein_coding | deleterious(0) | probably_damaging(0.998) | TCGA-A1-A0SO-01 | Breast | breast invasive carcinoma | Female | >=65 | I/II | Chemotherapy | SD | |
| TP53 | SNV | Missense_Mutation | rs28934576 | c.818N>A | p.Arg273His | p.R273H | P04637 | protein_coding | tolerated(0.13) | possibly_damaging(0.643) | TCGA-A2-A04T-01 | Breast | breast invasive carcinoma | Female | <65 | I/II | Chemotherapy | cyclophosphamide | SD |
| TP53 | SNV | Missense_Mutation | c.623N>G | p.Asp208Gly | p.D208G | P04637 | protein_coding | deleterious(0.04) | probably_damaging(0.988) | TCGA-A2-A04T-01 | Breast | breast invasive carcinoma | Female | <65 | I/II | Chemotherapy | cyclophosphamide | SD | |
| TP53 | SNV | Missense_Mutation | rs121912657 | c.814N>A | p.Val272Met | p.V272M | P04637 | protein_coding | deleterious(0) | probably_damaging(0.998) | TCGA-A2-A04W-01 | Breast | breast invasive carcinoma | Female | <65 | I/II | Chemotherapy | cytoxan | SD |
| TP53 | SNV | Missense_Mutation | rs28934576 | c.818G>T | p.Arg273Leu | p.R273L | P04637 | protein_coding | deleterious(0) | probably_damaging(0.994) | TCGA-A2-A0CL-01 | Breast | breast invasive carcinoma | Female | <65 | III/IV | Chemotherapy | cytoxan | SD |
| TP53 | SNV | Missense_Mutation | c.691A>C | p.Thr231Pro | p.T231P | P04637 | protein_coding | deleterious(0) | probably_damaging(0.981) | TCGA-A2-A0CS-01 | Breast | breast invasive carcinoma | Female | >=65 | III/IV | Hormone Therapy | anastrozole | SD | |
| TP53 | SNV | Missense_Mutation | rs587780073 | c.701N>G | p.Tyr234Cys | p.Y234C | P04637 | protein_coding | deleterious(0) | probably_damaging(0.98) | TCGA-A2-A0EY-01 | Breast | breast invasive carcinoma | Female | <65 | I/II | Chemotherapy | adriamycin | SD |
| TP53 | SNV | Missense_Mutation | rs148924904 | c.488N>G | p.Tyr163Cys | p.Y163C | P04637 | protein_coding | deleterious(0) | probably_damaging(0.999) | TCGA-A2-A0ST-01 | Breast | breast invasive carcinoma | Female | <65 | I/II | Chemotherapy | adriamycin | SD |
| Page: 1 2 3 4 5 6 7 8 9 10 11 12 13 14 15 16 17 18 19 20 21 22 23 24 25 26 27 28 29 30 31 32 33 34 35 36 37 38 39 40 41 42 43 44 45 46 47 48 49 50 51 52 53 54 55 56 57 58 59 60 61 62 63 64 65 66 67 68 69 70 71 72 73 74 75 76 77 78 79 80 81 82 83 84 85 86 87 88 89 90 91 92 93 94 95 96 97 98 99 100 101 102 103 104 105 106 107 108 109 110 111 112 113 114 115 116 117 118 119 120 121 122 123 124 125 126 127 128 129 130 131 132 133 134 135 136 137 138 139 140 141 142 143 144 145 146 147 148 149 150 151 152 153 154 155 156 157 158 159 160 161 162 163 164 165 166 167 168 169 170 171 172 |
Top |
Related drugs of malignant transformation related genes |
| Identification of chemicals and drugs interact with genes involved in malignant transfromation |
| (DGIdb 4.0) |
| Entrez ID | Symbol | Category | Interaction Types | Drug Claim Name | Drug Name | PMIDs |
| 7157 | TP53 | CLINICALLY ACTIONABLE, TRANSCRIPTION FACTOR COMPLEX, TUMOR SUPPRESSOR, DRUGGABLE GENOME, KINASE, DRUG RESISTANCE, TRANSPORTER | CAULIBUGULONE D | CAULIBUGULONE D | ||
| 7157 | TP53 | CLINICALLY ACTIONABLE, TRANSCRIPTION FACTOR COMPLEX, TUMOR SUPPRESSOR, DRUGGABLE GENOME, KINASE, DRUG RESISTANCE, TRANSPORTER | fluorouracil | FLUOROURACIL | ||
| 7157 | TP53 | CLINICALLY ACTIONABLE, TRANSCRIPTION FACTOR COMPLEX, TUMOR SUPPRESSOR, DRUGGABLE GENOME, KINASE, DRUG RESISTANCE, TRANSPORTER | CID 867101 | CHEMBL406557 | ||
| 7157 | TP53 | CLINICALLY ACTIONABLE, TRANSCRIPTION FACTOR COMPLEX, TUMOR SUPPRESSOR, DRUGGABLE GENOME, KINASE, DRUG RESISTANCE, TRANSPORTER | SJ000276790 | CHEMBL602922 | ||
| 7157 | TP53 | CLINICALLY ACTIONABLE, TRANSCRIPTION FACTOR COMPLEX, TUMOR SUPPRESSOR, DRUGGABLE GENOME, KINASE, DRUG RESISTANCE, TRANSPORTER | OLEOYL DOPAMINE | OLEOYL DOPAMINE | ||
| 7157 | TP53 | CLINICALLY ACTIONABLE, TRANSCRIPTION FACTOR COMPLEX, TUMOR SUPPRESSOR, DRUGGABLE GENOME, KINASE, DRUG RESISTANCE, TRANSPORTER | DNDI1417085 | CHEMBL1522984 | ||
| 7157 | TP53 | CLINICALLY ACTIONABLE, TRANSCRIPTION FACTOR COMPLEX, TUMOR SUPPRESSOR, DRUGGABLE GENOME, KINASE, DRUG RESISTANCE, TRANSPORTER | DNDI1340257 | CHEMBL1702181 | ||
| 7157 | TP53 | CLINICALLY ACTIONABLE, TRANSCRIPTION FACTOR COMPLEX, TUMOR SUPPRESSOR, DRUGGABLE GENOME, KINASE, DRUG RESISTANCE, TRANSPORTER | TEBUFENPYRAD | TEBUFENPYRAD | ||
| 7157 | TP53 | CLINICALLY ACTIONABLE, TRANSCRIPTION FACTOR COMPLEX, TUMOR SUPPRESSOR, DRUGGABLE GENOME, KINASE, DRUG RESISTANCE, TRANSPORTER | CTX-1 | 26883273 | ||
| 7157 | TP53 | CLINICALLY ACTIONABLE, TRANSCRIPTION FACTOR COMPLEX, TUMOR SUPPRESSOR, DRUGGABLE GENOME, KINASE, DRUG RESISTANCE, TRANSPORTER | ZM-336372 | CHEMBL186526 |
| Page: 1 2 3 4 5 6 7 8 9 10 11 12 13 14 15 16 17 18 19 20 21 22 23 24 25 26 27 28 29 30 31 32 33 34 35 36 37 38 39 40 41 42 43 44 45 46 47 48 49 50 |

Copyright 2023-Present -The University of Texas Health Science Center at Houston |