| Tissue | Expression Dynamics | Abbreviation |
| Breast | 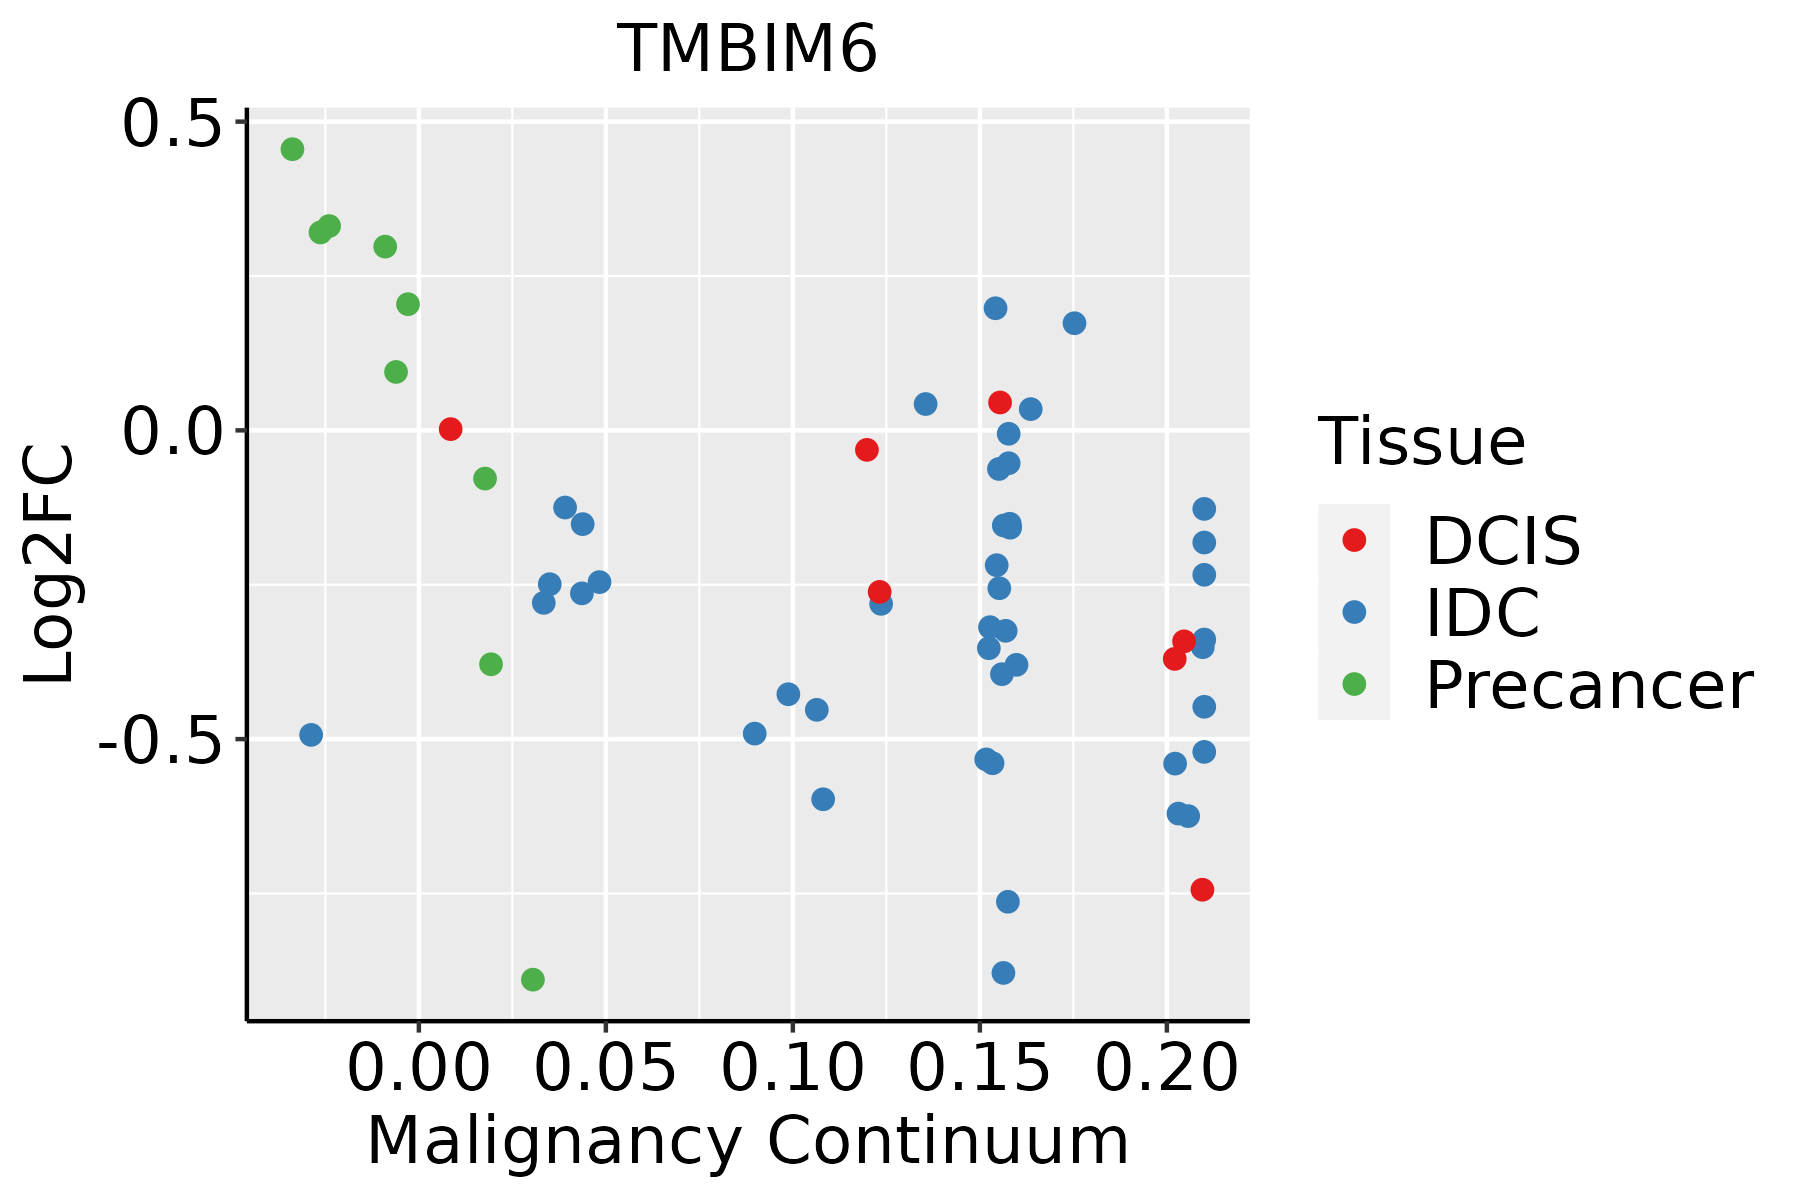 | IDC: Invasive ductal carcinoma |
| DCIS: Ductal carcinoma in situ |
| Precancer(BRCA1-mut): Precancerous lesion from BRCA1 mutation carriers |
| Cervix | 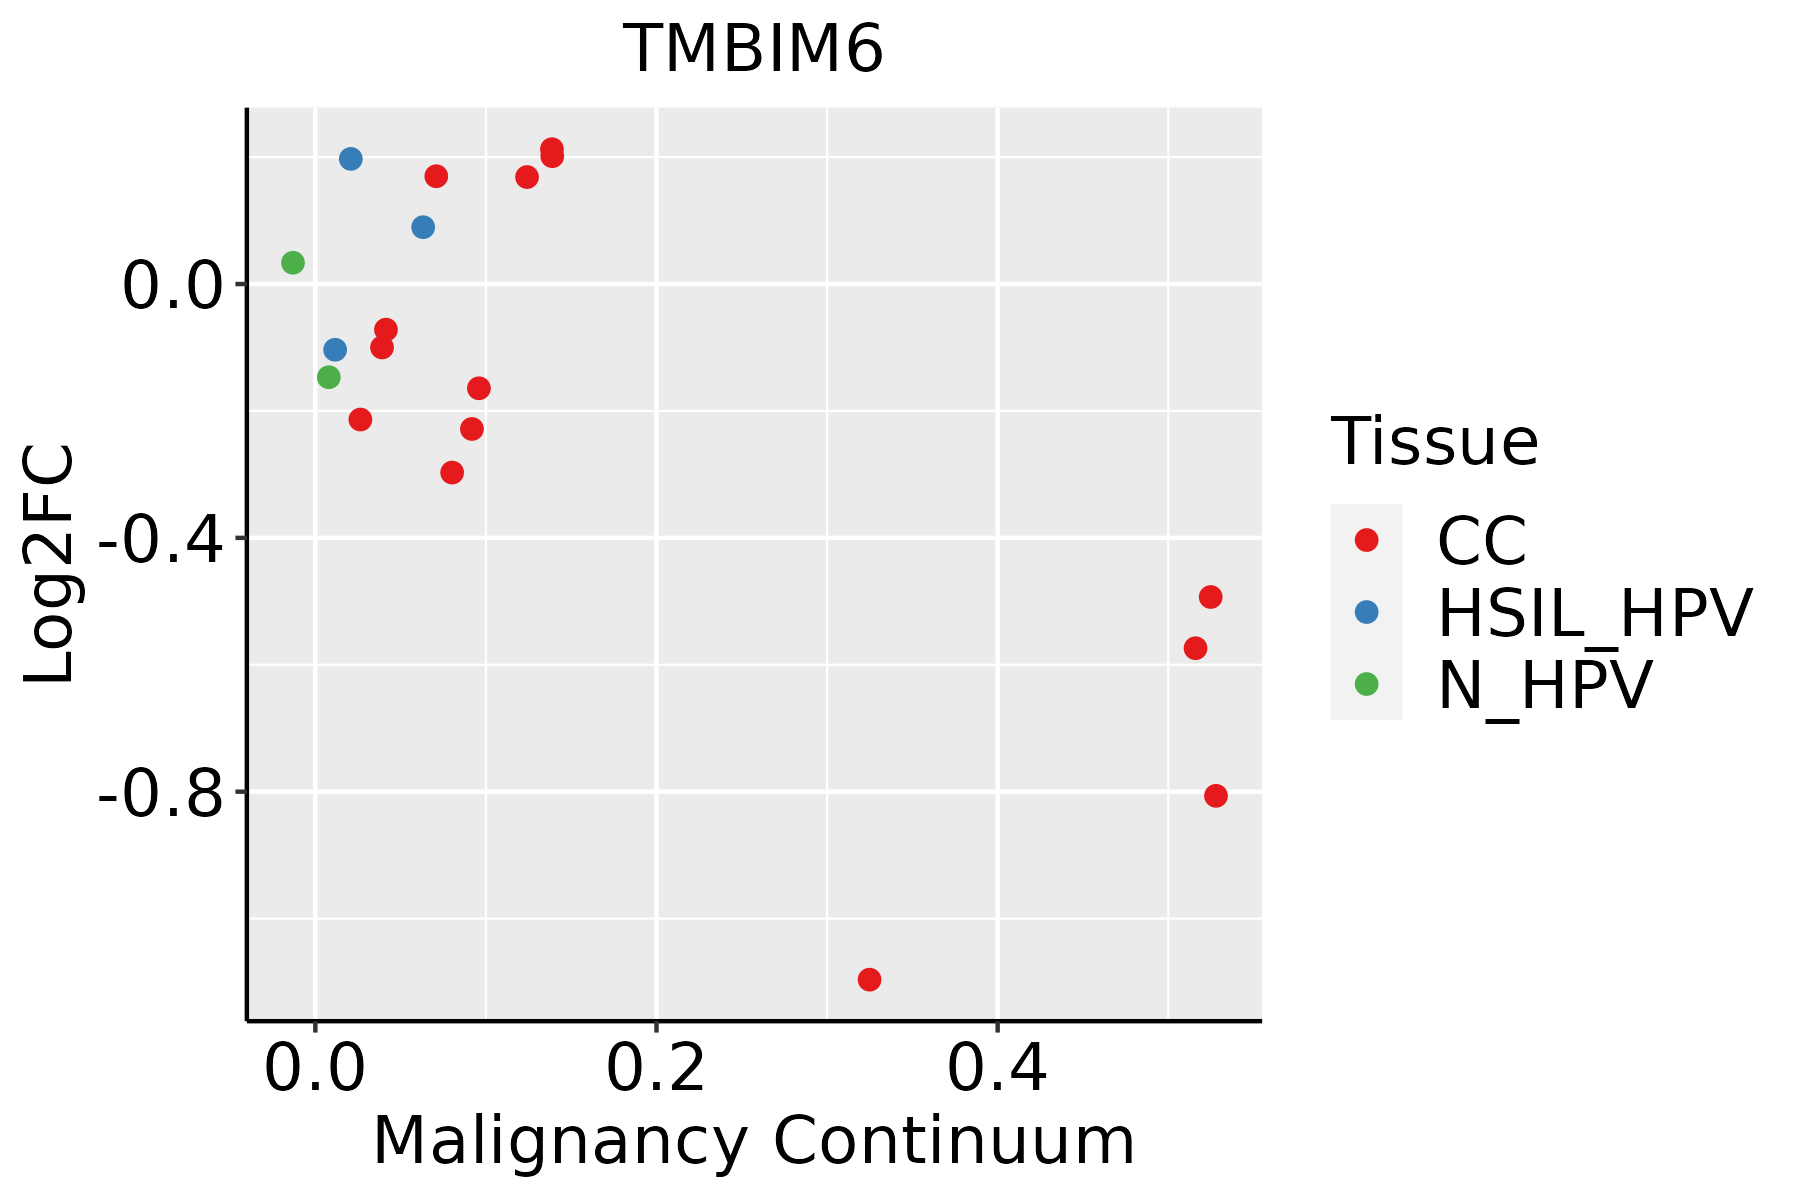 | CC: Cervix cancer |
| HSIL_HPV: HPV-infected high-grade squamous intraepithelial lesions |
| N_HPV: HPV-infected normal cervix |
| Colorectum (GSE201348) |  | FAP: Familial adenomatous polyposis |
| CRC: Colorectal cancer |
| Colorectum (HTA11) |  | AD: Adenomas |
| SER: Sessile serrated lesions |
| MSI-H: Microsatellite-high colorectal cancer |
| MSS: Microsatellite stable colorectal cancer |
| Endometrium | 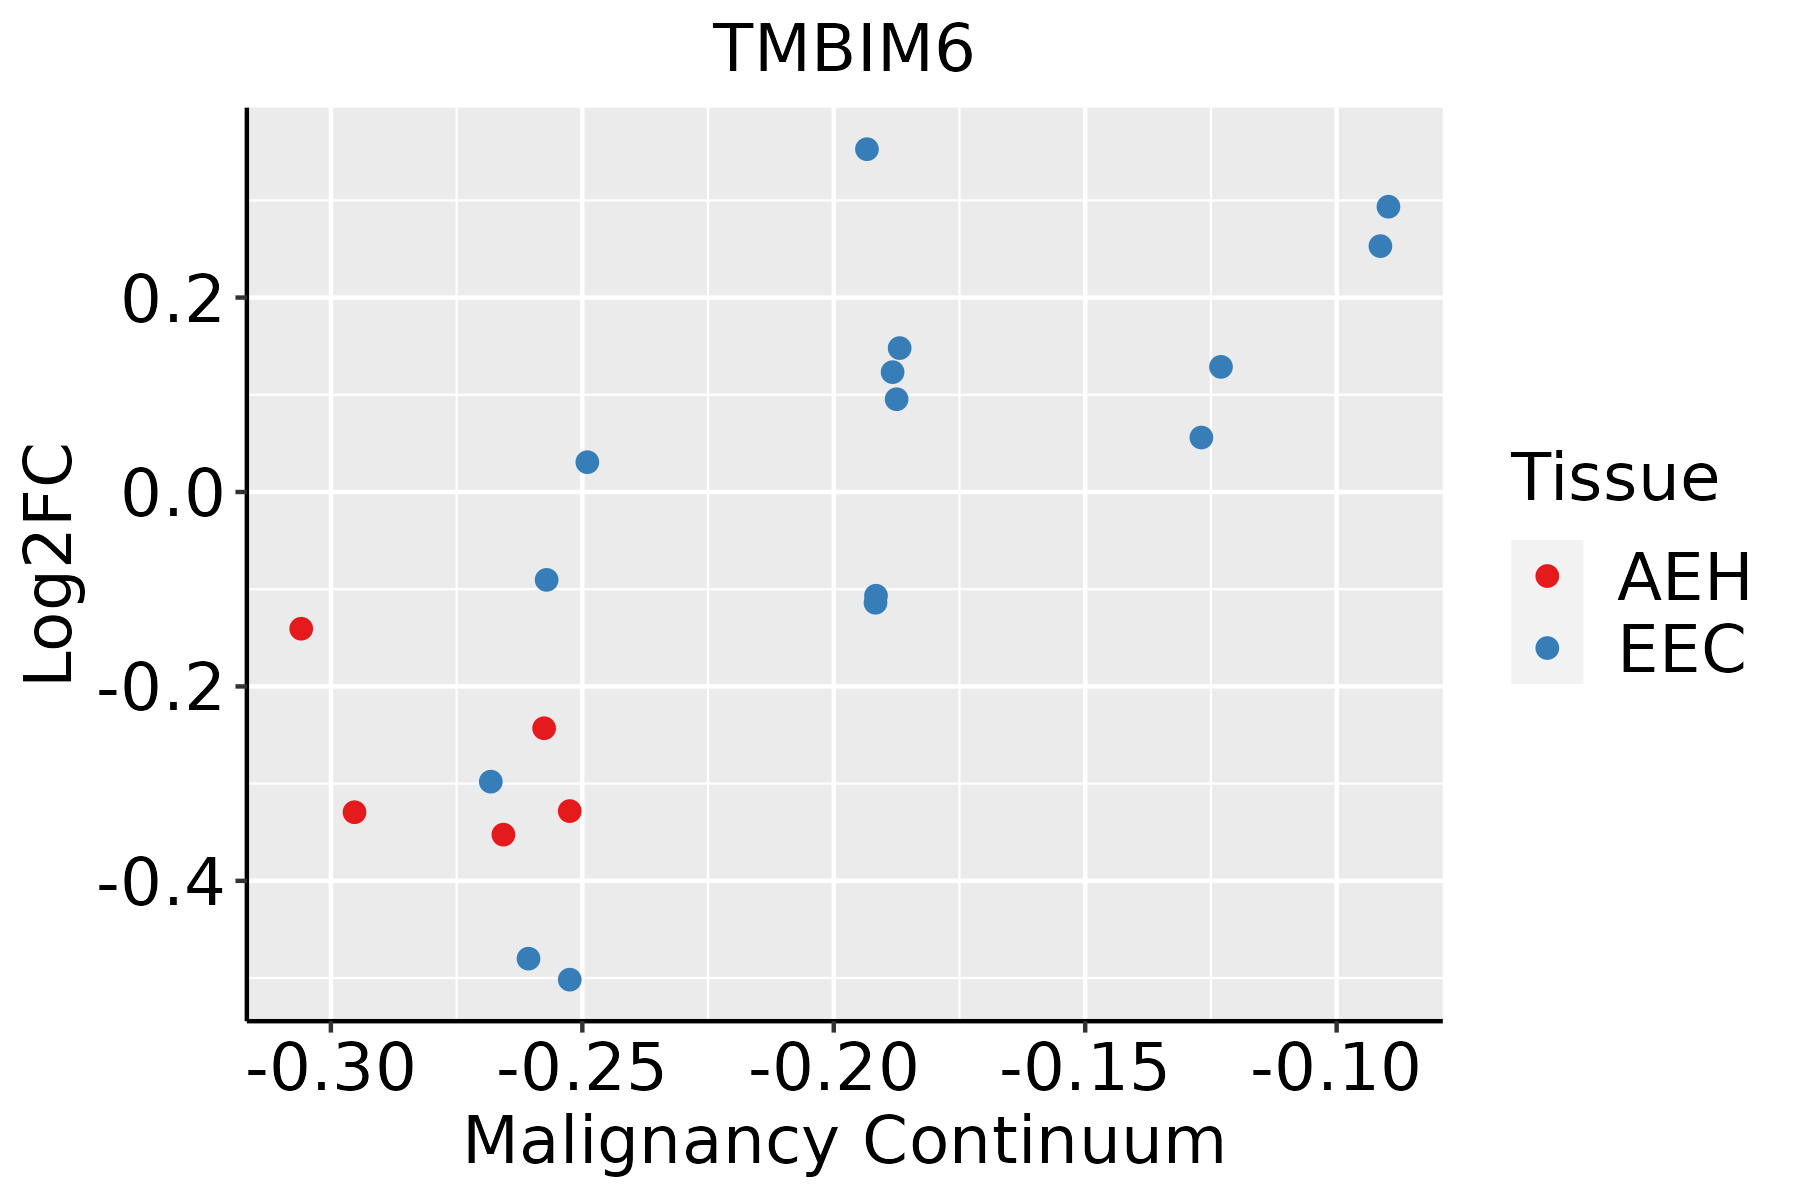 | AEH: Atypical endometrial hyperplasia |
| EEC: Endometrioid Cancer |
| Esophagus | 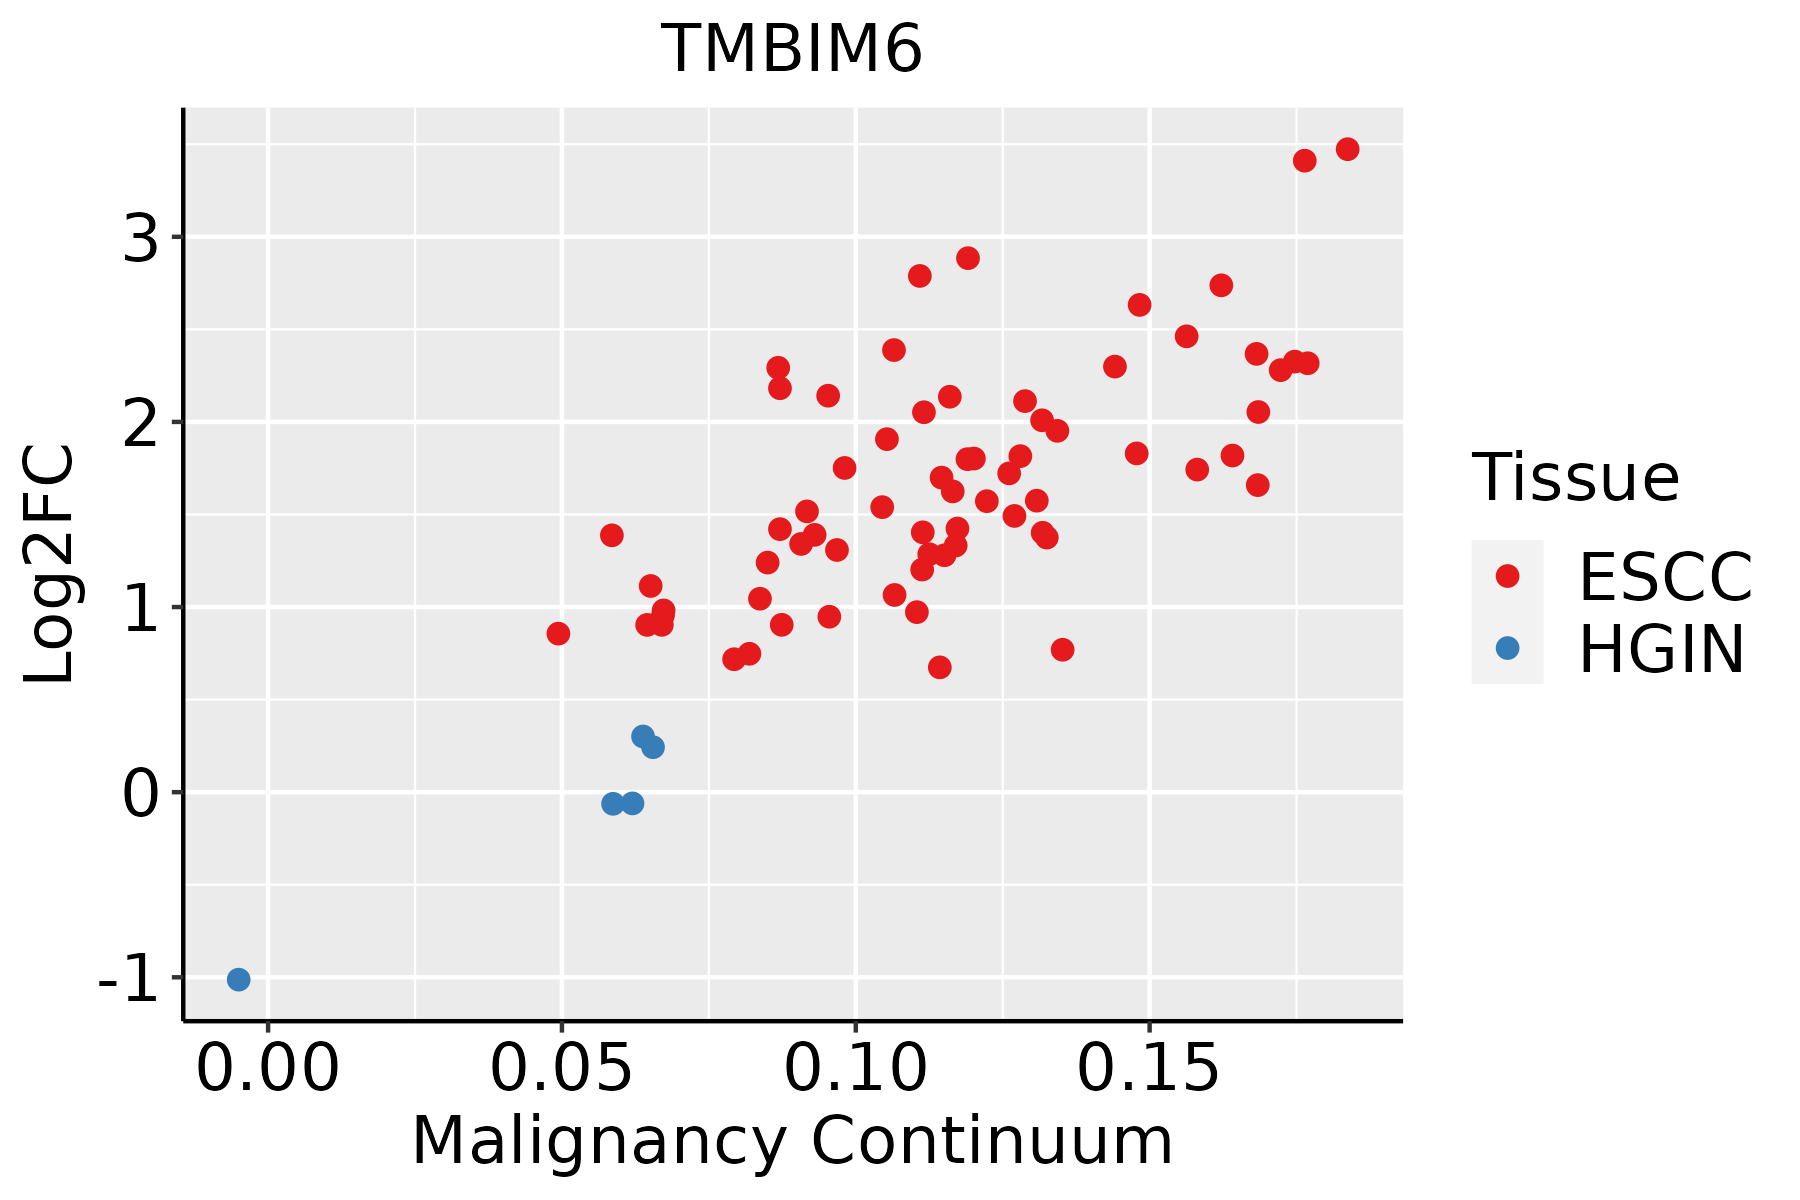 | ESCC: Esophageal squamous cell carcinoma |
| HGIN: High-grade intraepithelial neoplasias |
| LGIN: Low-grade intraepithelial neoplasias |
| GC |  | CAG: Chronic atrophic gastritis |
| CAG with IM: Chronic atrophic gastritis with intestinal metaplasia |
| CSG: Chronic superficial gastritis |
| GC: Gastric cancer |
| SIM: Severe intestinal metaplasia |
| WIM: Wild intestinal metaplasia |
| Liver | 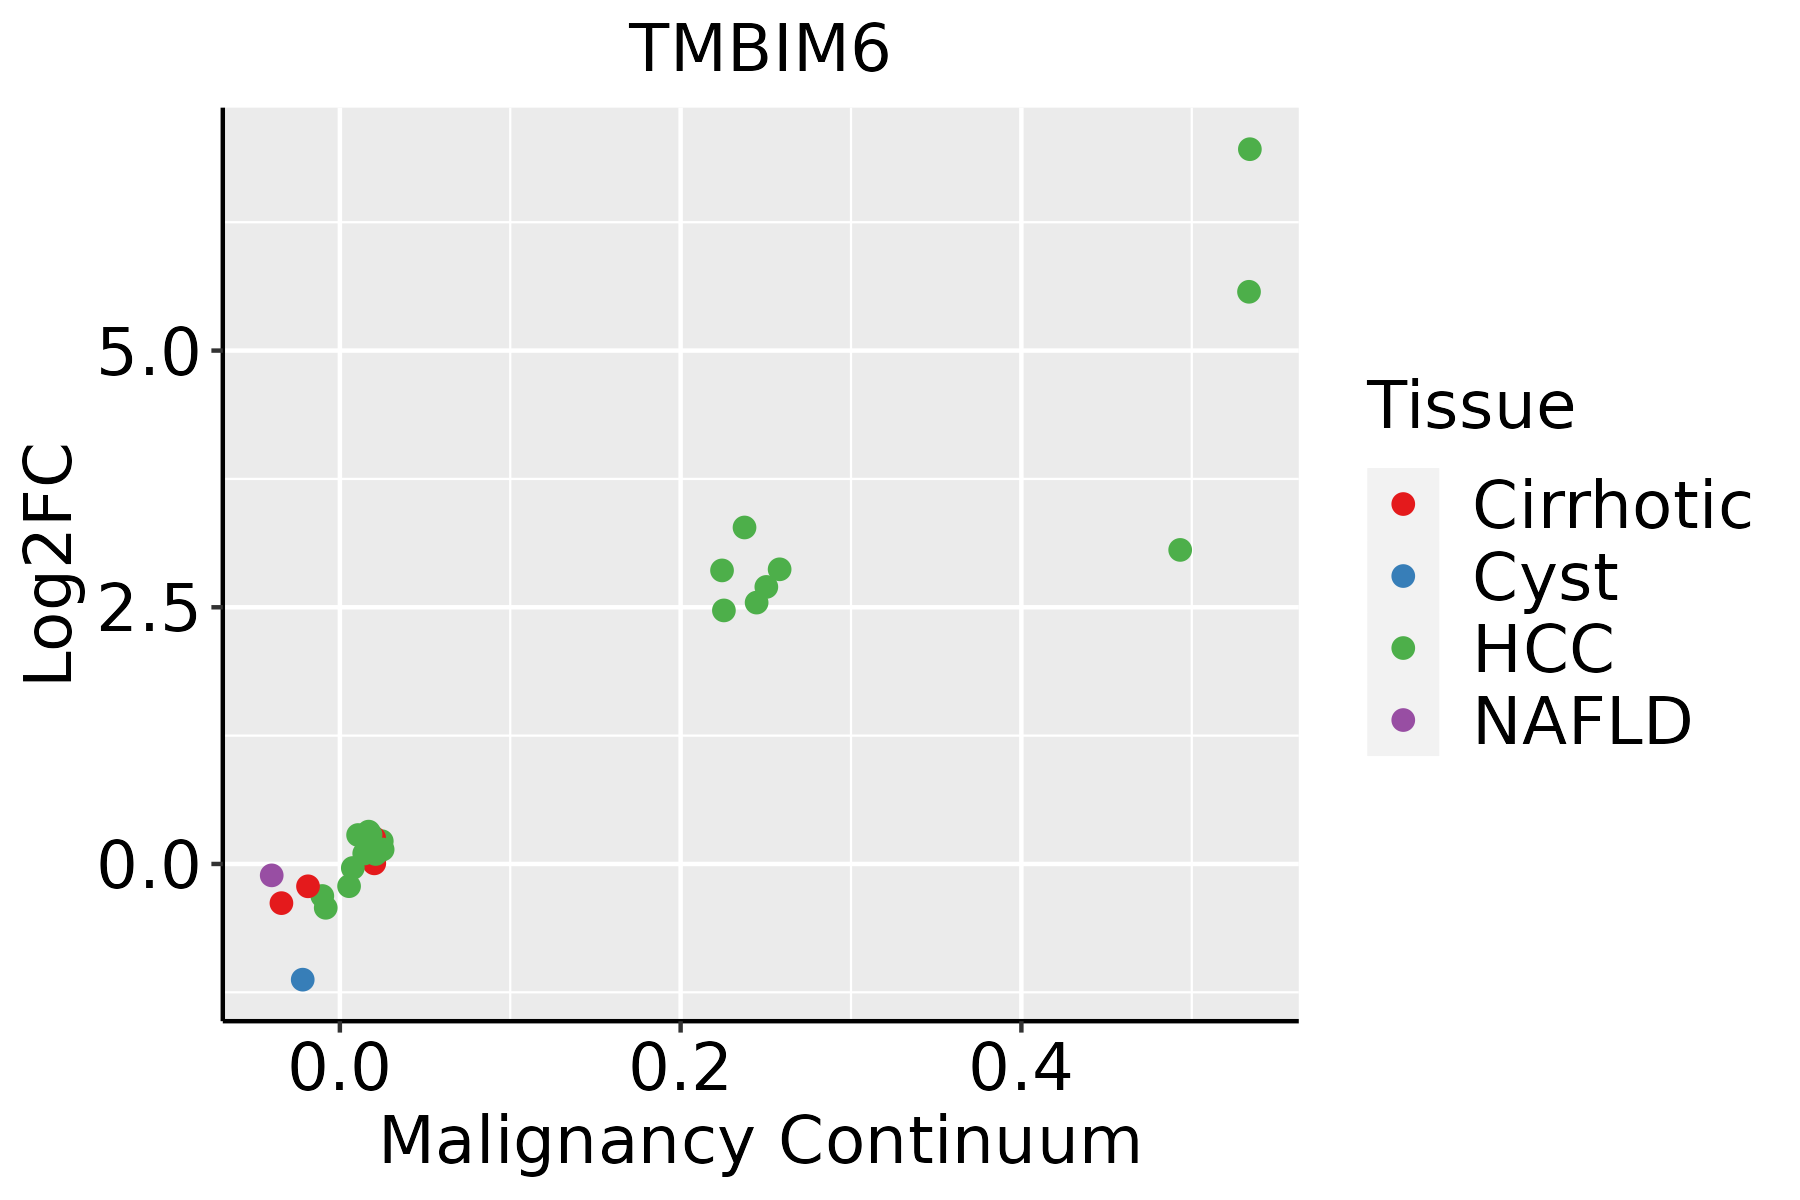 | HCC: Hepatocellular carcinoma |
| NAFLD: Non-alcoholic fatty liver disease |
| Lung | 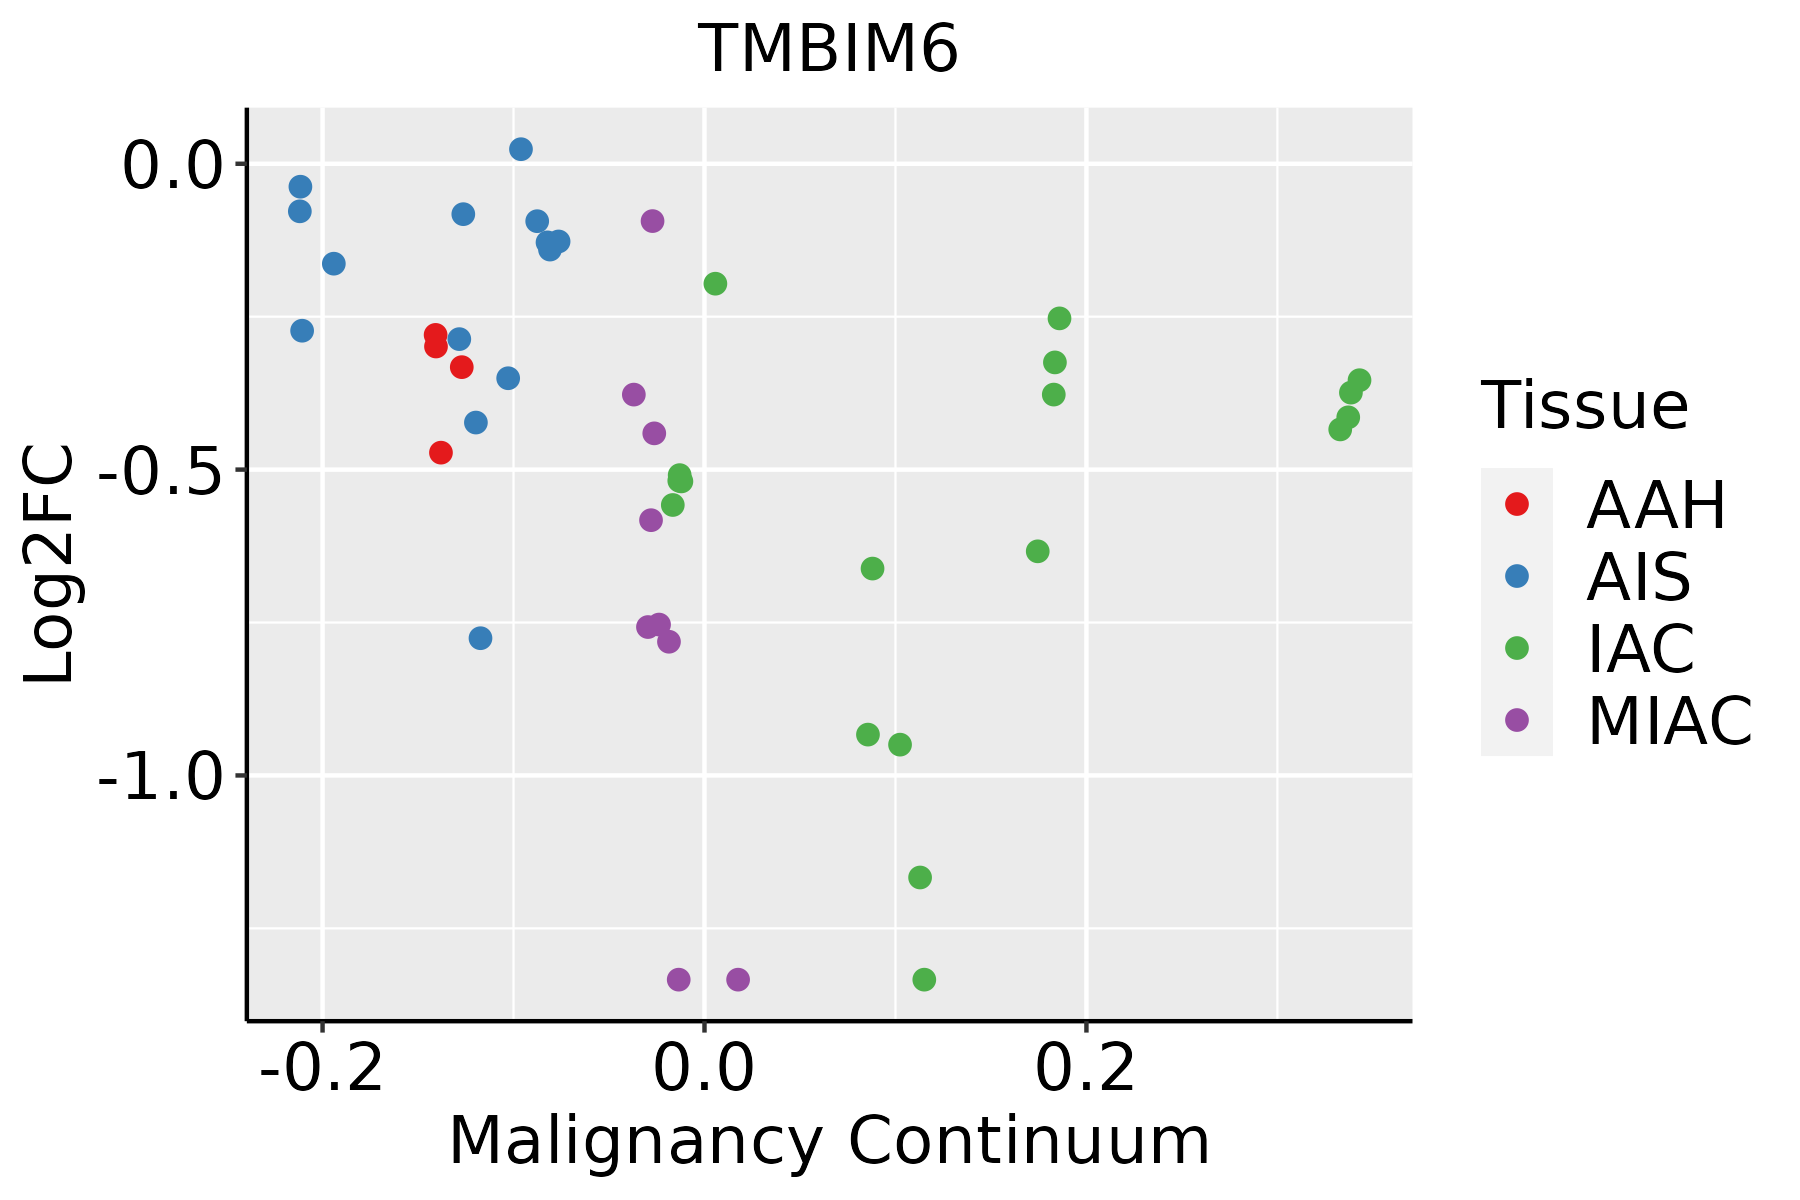 | AAH: Atypical adenomatous hyperplasia |
| AIS: Adenocarcinoma in situ |
| IAC: Invasive lung adenocarcinoma |
| MIA: Minimally invasive adenocarcinoma |
| Oral Cavity |  | EOLP: Erosive Oral lichen planus |
| LP: leukoplakia |
| NEOLP: Non-erosive oral lichen planus |
| OSCC: Oral squamous cell carcinoma |
| Prostate | 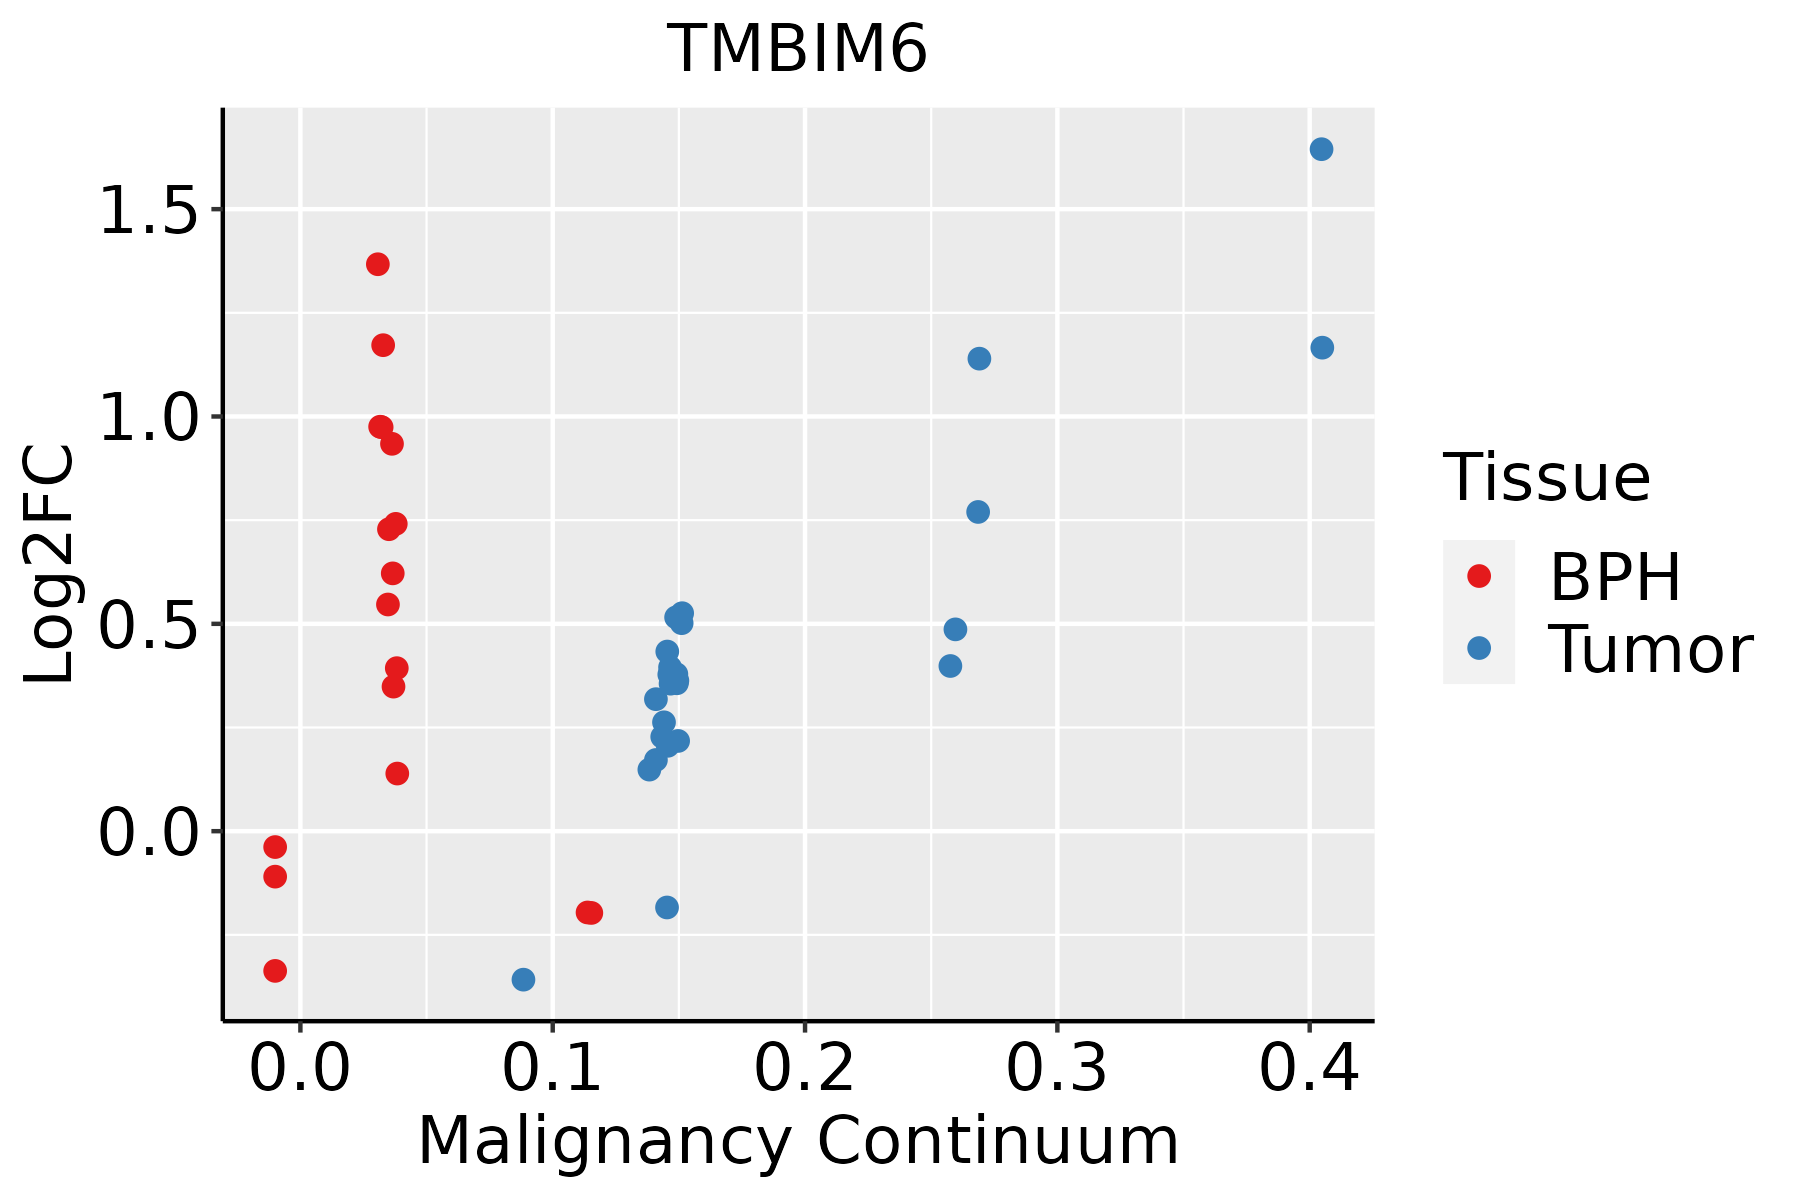 | BPH: Benign Prostatic Hyperplasia |
| Skin | 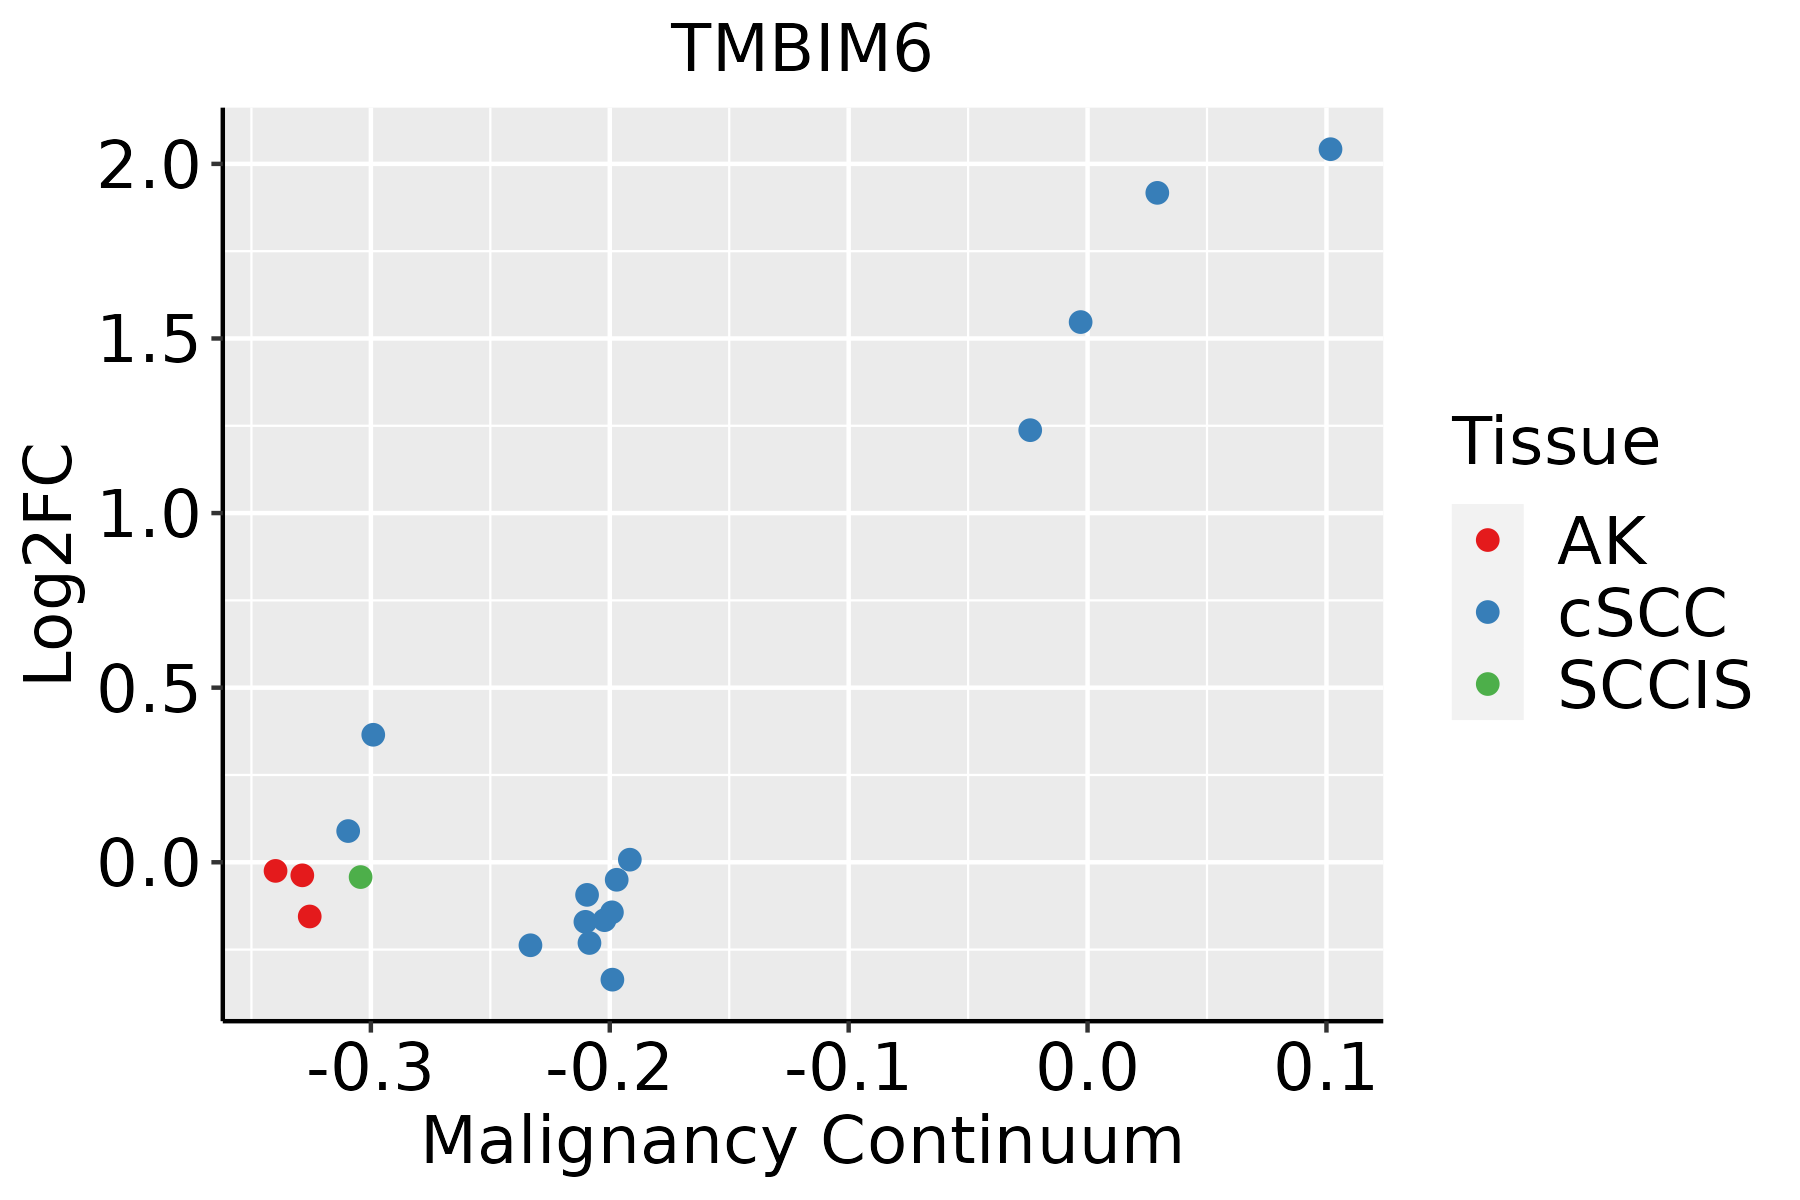 | AK: Actinic keratosis |
| cSCC: Cutaneous squamous cell carcinoma |
| SCCIS:squamous cell carcinoma in situ |
| Thyroid |  | ATC: Anaplastic thyroid cancer |
| HT: Hashimoto's thyroiditis |
| PTC: Papillary thyroid cancer |
| GO ID | Tissue | Disease Stage | Description | Gene Ratio | Bg Ratio | pvalue | p.adjust | Count |
| GO:190589728 | Thyroid | ATC | regulation of response to endoplasmic reticulum stress | 54/6293 | 82/18723 | 2.34e-09 | 5.58e-08 | 54 |
| GO:0070059113 | Thyroid | ATC | intrinsic apoptotic signaling pathway in response to endoplasmic reticulum stress | 43/6293 | 63/18723 | 1.98e-08 | 3.90e-07 | 43 |
| GO:007145325 | Thyroid | ATC | cellular response to oxygen levels | 94/6293 | 177/18723 | 6.62e-08 | 1.17e-06 | 94 |
| GO:190357327 | Thyroid | ATC | negative regulation of response to endoplasmic reticulum stress | 32/6293 | 44/18723 | 1.28e-07 | 2.12e-06 | 32 |
| GO:005110027 | Thyroid | ATC | negative regulation of binding | 86/6293 | 162/18723 | 2.41e-07 | 3.73e-06 | 86 |
| GO:003311935 | Thyroid | ATC | negative regulation of RNA splicing | 21/6293 | 25/18723 | 3.02e-07 | 4.52e-06 | 21 |
| GO:003629425 | Thyroid | ATC | cellular response to decreased oxygen levels | 85/6293 | 161/18723 | 3.86e-07 | 5.65e-06 | 85 |
| GO:0043620210 | Thyroid | ATC | regulation of DNA-templated transcription in response to stress | 35/6293 | 53/18723 | 1.39e-06 | 1.74e-05 | 35 |
| GO:004361829 | Thyroid | ATC | regulation of transcription from RNA polymerase II promoter in response to stress | 32/6293 | 47/18723 | 1.42e-06 | 1.77e-05 | 32 |
| GO:007145624 | Thyroid | ATC | cellular response to hypoxia | 78/6293 | 151/18723 | 3.44e-06 | 3.86e-05 | 78 |
| GO:003246925 | Thyroid | ATC | endoplasmic reticulum calcium ion homeostasis | 19/6293 | 25/18723 | 1.77e-05 | 1.62e-04 | 19 |
| GO:000110124 | Thyroid | ATC | response to acid chemical | 69/6293 | 135/18723 | 1.95e-05 | 1.76e-04 | 69 |
| GO:1902236112 | Thyroid | ATC | negative regulation of endoplasmic reticulum stress-induced intrinsic apoptotic signaling pathway | 16/6293 | 20/18723 | 2.79e-05 | 2.36e-04 | 16 |
| GO:003209119 | Thyroid | ATC | negative regulation of protein binding | 51/6293 | 94/18723 | 2.97e-05 | 2.48e-04 | 51 |
| GO:003206923 | Thyroid | ATC | regulation of nuclease activity | 17/6293 | 22/18723 | 3.47e-05 | 2.84e-04 | 17 |
| GO:190223518 | Thyroid | ATC | regulation of endoplasmic reticulum stress-induced intrinsic apoptotic signaling pathway | 22/6293 | 32/18723 | 5.14e-05 | 3.99e-04 | 22 |
| GO:004320022 | Thyroid | ATC | response to amino acid | 58/6293 | 116/18723 | 1.88e-04 | 1.26e-03 | 58 |
| GO:005134629 | Thyroid | ATC | negative regulation of hydrolase activity | 155/6293 | 379/18723 | 1.64e-03 | 8.23e-03 | 155 |
| GO:009720132 | Thyroid | ATC | negative regulation of transcription from RNA polymerase II promoter in response to stress | 9/6293 | 12/18723 | 4.10e-03 | 1.75e-02 | 9 |
| GO:005105114 | Thyroid | ATC | negative regulation of transport | 183/6293 | 470/18723 | 8.12e-03 | 3.13e-02 | 183 |
| Pathway ID | Tissue | Disease Stage | Description | Gene Ratio | Bg Ratio | pvalue | p.adjust | qvalue | Count |
| hsa0513018 | Breast | Precancer | Pathogenic Escherichia coli infection | 38/684 | 197/8465 | 3.12e-07 | 5.81e-06 | 4.45e-06 | 38 |
| hsa0513019 | Breast | Precancer | Pathogenic Escherichia coli infection | 38/684 | 197/8465 | 3.12e-07 | 5.81e-06 | 4.45e-06 | 38 |
| hsa0513024 | Breast | IDC | Pathogenic Escherichia coli infection | 42/867 | 197/8465 | 2.66e-06 | 3.92e-05 | 2.94e-05 | 42 |
| hsa0513034 | Breast | IDC | Pathogenic Escherichia coli infection | 42/867 | 197/8465 | 2.66e-06 | 3.92e-05 | 2.94e-05 | 42 |
| hsa0513043 | Breast | DCIS | Pathogenic Escherichia coli infection | 42/846 | 197/8465 | 1.40e-06 | 2.15e-05 | 1.59e-05 | 42 |
| hsa0513053 | Breast | DCIS | Pathogenic Escherichia coli infection | 42/846 | 197/8465 | 1.40e-06 | 2.15e-05 | 1.59e-05 | 42 |
| hsa0513020 | Cervix | CC | Pathogenic Escherichia coli infection | 63/1267 | 197/8465 | 9.28e-10 | 2.00e-08 | 1.19e-08 | 63 |
| hsa05130110 | Cervix | CC | Pathogenic Escherichia coli infection | 63/1267 | 197/8465 | 9.28e-10 | 2.00e-08 | 1.19e-08 | 63 |
| hsa0513044 | Cervix | N_HPV | Pathogenic Escherichia coli infection | 25/349 | 197/8465 | 4.71e-07 | 8.00e-06 | 6.25e-06 | 25 |
| hsa0513054 | Cervix | N_HPV | Pathogenic Escherichia coli infection | 25/349 | 197/8465 | 4.71e-07 | 8.00e-06 | 6.25e-06 | 25 |
| hsa05130 | Colorectum | AD | Pathogenic Escherichia coli infection | 79/2092 | 197/8465 | 1.05e-06 | 1.36e-05 | 8.65e-06 | 79 |
| hsa051301 | Colorectum | AD | Pathogenic Escherichia coli infection | 79/2092 | 197/8465 | 1.05e-06 | 1.36e-05 | 8.65e-06 | 79 |
| hsa051302 | Colorectum | SER | Pathogenic Escherichia coli infection | 60/1580 | 197/8465 | 3.63e-05 | 4.31e-04 | 3.13e-04 | 60 |
| hsa051303 | Colorectum | SER | Pathogenic Escherichia coli infection | 60/1580 | 197/8465 | 3.63e-05 | 4.31e-04 | 3.13e-04 | 60 |
| hsa051304 | Colorectum | MSS | Pathogenic Escherichia coli infection | 73/1875 | 197/8465 | 1.10e-06 | 1.48e-05 | 9.06e-06 | 73 |
| hsa051305 | Colorectum | MSS | Pathogenic Escherichia coli infection | 73/1875 | 197/8465 | 1.10e-06 | 1.48e-05 | 9.06e-06 | 73 |
| hsa051306 | Colorectum | MSI-H | Pathogenic Escherichia coli infection | 31/797 | 197/8465 | 2.90e-03 | 2.93e-02 | 2.46e-02 | 31 |
| hsa051307 | Colorectum | MSI-H | Pathogenic Escherichia coli infection | 31/797 | 197/8465 | 2.90e-03 | 2.93e-02 | 2.46e-02 | 31 |
| hsa051308 | Colorectum | FAP | Pathogenic Escherichia coli infection | 62/1404 | 197/8465 | 1.37e-07 | 3.08e-06 | 1.87e-06 | 62 |
| hsa051309 | Colorectum | FAP | Pathogenic Escherichia coli infection | 62/1404 | 197/8465 | 1.37e-07 | 3.08e-06 | 1.87e-06 | 62 |
| Hugo Symbol | Variant Class | Variant Classification | dbSNP RS | HGVSc | HGVSp | HGVSp Short | SWISSPROT | BIOTYPE | SIFT | PolyPhen | Tumor Sample Barcode | Tissue | Histology | Sex | Age | Stage | Therapy Types | Drugs | Outcome |
| TMBIM6 | SNV | Missense_Mutation | novel | c.104G>T | p.Arg35Leu | p.R35L | P55061 | protein_coding | tolerated_low_confidence(0.08) | benign(0.001) | TCGA-A7-A0DB-01 | Breast | breast invasive carcinoma | Female | <65 | I/II | Hormone Therapy | arimidex | SD |
| TMBIM6 | deletion | Frame_Shift_Del | novel | c.702delN | p.Gly235AspfsTer36 | p.G235Dfs*36 | P55061 | protein_coding | | | TCGA-D8-A27V-01 | Breast | breast invasive carcinoma | Female | <65 | I/II | Hormone Therapy | tamoxiphen | SD |
| TMBIM6 | SNV | Missense_Mutation | | c.35N>T | p.Gln12Leu | p.Q12L | P55061 | protein_coding | deleterious_low_confidence(0) | benign(0) | TCGA-AZ-5407-01 | Colorectum | colon adenocarcinoma | Female | <65 | I/II | Unknown | Unknown | SD |
| TMBIM6 | SNV | Missense_Mutation | | c.728N>A | p.Val243Asp | p.V243D | P55061 | protein_coding | deleterious(0) | probably_damaging(0.989) | TCGA-D5-6928-01 | Colorectum | colon adenocarcinoma | Male | >=65 | I/II | Unknown | Unknown | SD |
| TMBIM6 | SNV | Missense_Mutation | | c.185T>C | p.Phe62Ser | p.F62S | P55061 | protein_coding | deleterious(0) | possibly_damaging(0.677) | TCGA-D5-7000-01 | Colorectum | colon adenocarcinoma | Female | >=65 | I/II | Unknown | Unknown | SD |
| TMBIM6 | SNV | Missense_Mutation | novel | c.675N>G | p.Ile225Met | p.I225M | P55061 | protein_coding | tolerated(0.23) | benign(0.012) | TCGA-AJ-A3EL-01 | Endometrium | uterine corpus endometrioid carcinoma | Female | <65 | I/II | Unknown | Unknown | SD |
| TMBIM6 | SNV | Missense_Mutation | novel | c.497N>A | p.Ala166Asp | p.A166D | P55061 | protein_coding | tolerated(0.53) | benign(0.007) | TCGA-AX-A1CE-01 | Endometrium | uterine corpus endometrioid carcinoma | Female | <65 | I/II | Unspecific | Paclitaxel | SD |
| TMBIM6 | SNV | Missense_Mutation | | c.521N>T | p.Thr174Ile | p.T174I | P55061 | protein_coding | deleterious(0) | probably_damaging(0.992) | TCGA-B5-A11E-01 | Endometrium | uterine corpus endometrioid carcinoma | Female | <65 | I/II | Unknown | Unknown | SD |
| TMBIM6 | insertion | Frame_Shift_Ins | novel | c.731_732insA | p.Asp246Ter | p.D246* | P55061 | protein_coding | | | TCGA-A5-A0R9-01 | Endometrium | uterine corpus endometrioid carcinoma | Female | <65 | I/II | Unknown | Unknown | SD |
| TMBIM6 | insertion | Nonsense_Mutation | novel | c.732_733insGAAGGATAATGGGAAGGC | p.Leu244_Phe245insGluGlyTerTrpGluGly | p.L244_F245insEG*WEG | P55061 | protein_coding | | | TCGA-A5-A0R9-01 | Endometrium | uterine corpus endometrioid carcinoma | Female | <65 | I/II | Unknown | Unknown | SD |


