
|
|||||
|
 | |
| |
| |
| |
| |
| |
|
Gene: CLU |
Gene summary for CLU |
| Gene information | Species | Human | Gene symbol | CLU | Gene ID | 1191 |
| Gene name | clusterin | |
| Gene Alias | AAG4 | |
| Cytomap | 8p21.1 | |
| Gene Type | protein-coding | GO ID | GO:0000902 | UniProtAcc | P10909 |
Top |
Malignant transformation analysis |
| Identification of the aberrant gene expression in precancerous and cancerous lesions by comparing the gene expression of stem-like cells in diseased tissues with normal stem cells |
| Entrez ID | Symbol | Replicates | Species | Organ | Tissue | Adj P-value | Log2FC | Malignancy |
| 1191 | CLU | GSM4909282 | Human | Breast | IDC | 3.33e-34 | -8.49e-01 | -0.0288 |
| 1191 | CLU | GSM4909285 | Human | Breast | IDC | 5.64e-39 | -8.76e-01 | 0.21 |
| 1191 | CLU | GSM4909288 | Human | Breast | IDC | 3.98e-03 | -3.45e-01 | 0.0988 |
| 1191 | CLU | GSM4909290 | Human | Breast | IDC | 2.17e-38 | -9.43e-01 | 0.2096 |
| 1191 | CLU | GSM4909293 | Human | Breast | IDC | 2.68e-14 | -5.99e-01 | 0.1581 |
| 1191 | CLU | GSM4909294 | Human | Breast | IDC | 1.78e-10 | -4.40e-01 | 0.2022 |
| 1191 | CLU | GSM4909296 | Human | Breast | IDC | 6.83e-33 | -7.74e-01 | 0.1524 |
| 1191 | CLU | GSM4909297 | Human | Breast | IDC | 3.03e-10 | -2.40e-01 | 0.1517 |
| 1191 | CLU | GSM4909298 | Human | Breast | IDC | 1.61e-07 | -5.29e-01 | 0.1551 |
| 1191 | CLU | GSM4909299 | Human | Breast | IDC | 3.59e-17 | 5.67e-01 | 0.035 |
| 1191 | CLU | GSM4909300 | Human | Breast | IDC | 9.03e-05 | 4.60e-01 | 0.0334 |
| 1191 | CLU | GSM4909301 | Human | Breast | IDC | 1.76e-22 | -7.36e-01 | 0.1577 |
| 1191 | CLU | GSM4909304 | Human | Breast | IDC | 8.74e-22 | -7.57e-01 | 0.1636 |
| 1191 | CLU | GSM4909311 | Human | Breast | IDC | 5.72e-38 | -7.49e-01 | 0.1534 |
| 1191 | CLU | GSM4909312 | Human | Breast | IDC | 1.55e-32 | -7.91e-01 | 0.1552 |
| 1191 | CLU | GSM4909313 | Human | Breast | IDC | 3.75e-02 | 1.83e-01 | 0.0391 |
| 1191 | CLU | GSM4909315 | Human | Breast | IDC | 2.63e-04 | -3.33e-01 | 0.21 |
| 1191 | CLU | GSM4909316 | Human | Breast | IDC | 4.55e-04 | -5.96e-01 | 0.21 |
| 1191 | CLU | GSM4909318 | Human | Breast | IDC | 2.93e-05 | -7.64e-01 | 0.2031 |
| 1191 | CLU | GSM4909319 | Human | Breast | IDC | 2.47e-39 | -4.32e-01 | 0.1563 |
| Page: 1 2 3 4 5 6 7 8 9 10 11 12 |
| Tissue | Expression Dynamics | Abbreviation |
| Breast | 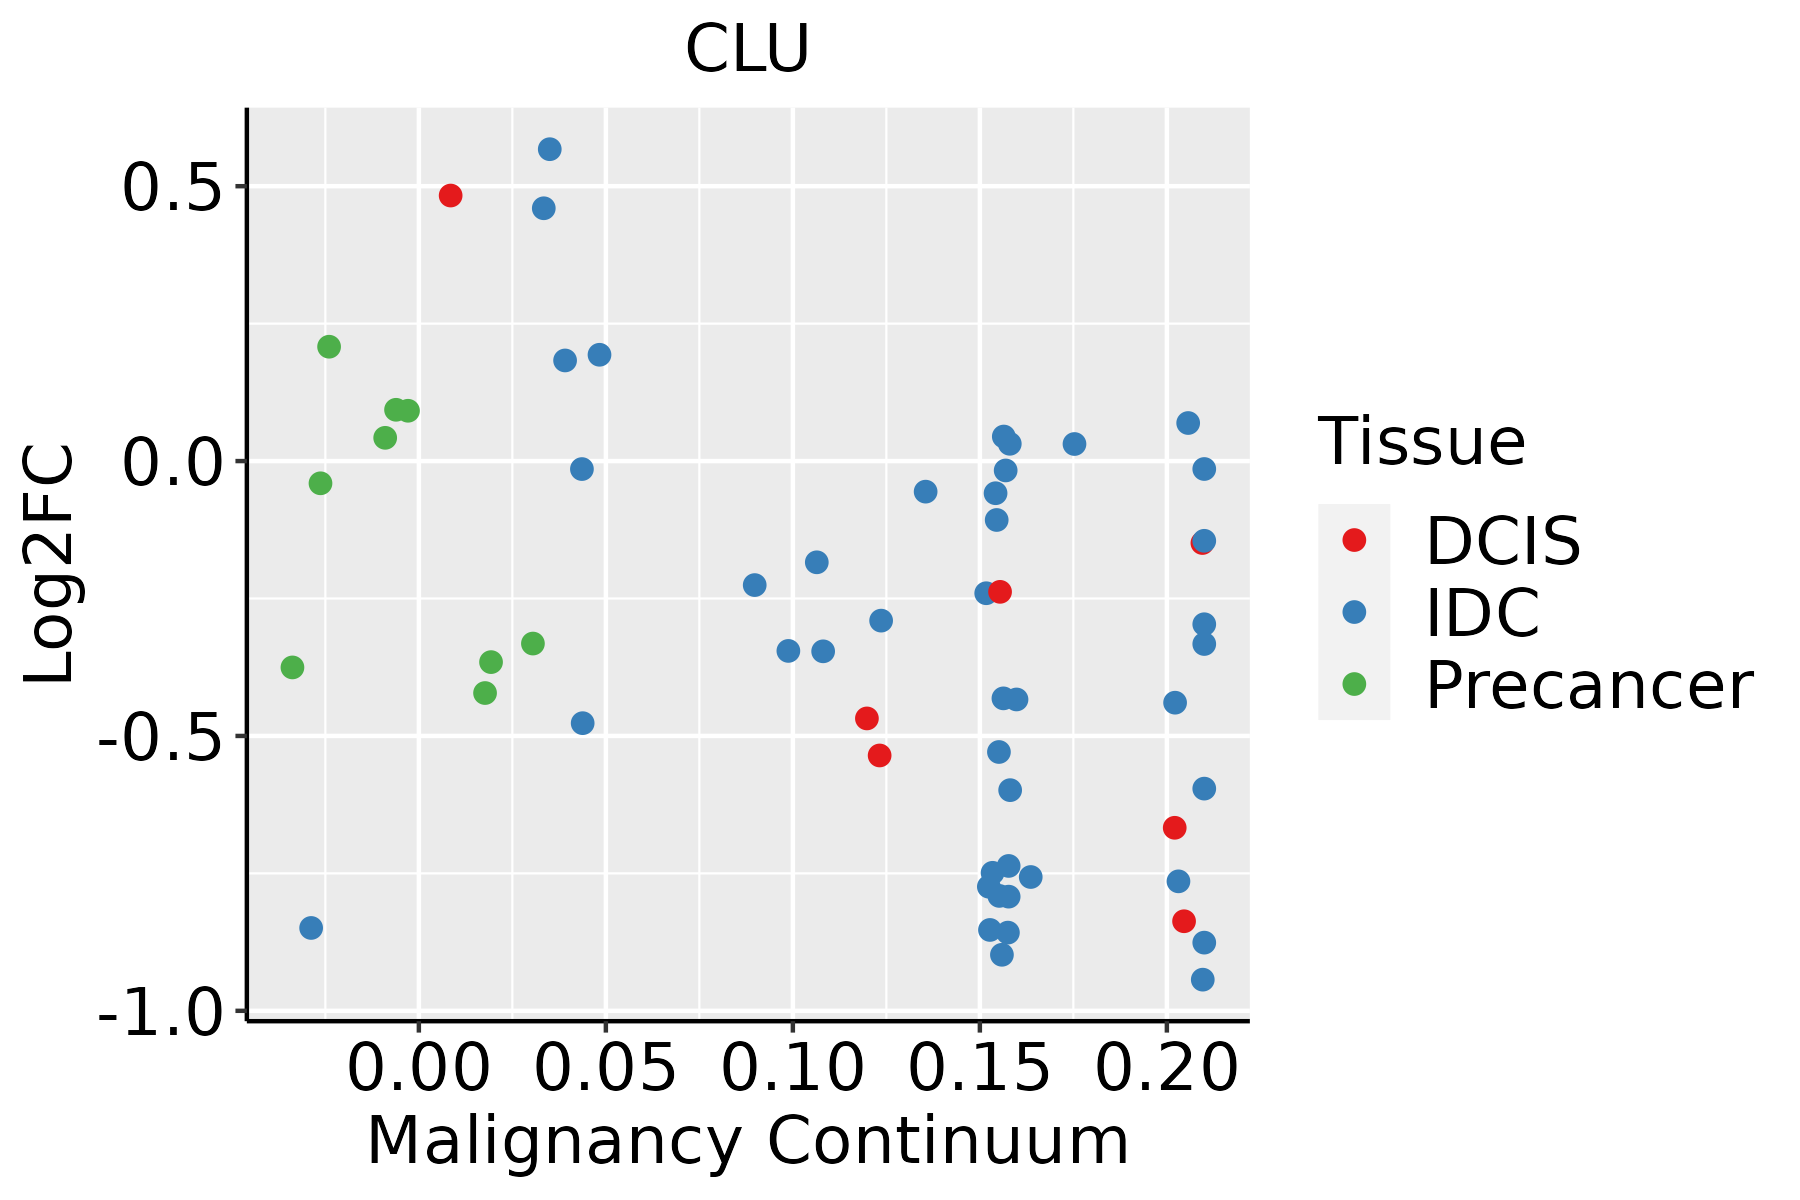 | IDC: Invasive ductal carcinoma |
| DCIS: Ductal carcinoma in situ | ||
| Precancer(BRCA1-mut): Precancerous lesion from BRCA1 mutation carriers | ||
| Cervix |  | CC: Cervix cancer |
| HSIL_HPV: HPV-infected high-grade squamous intraepithelial lesions | ||
| N_HPV: HPV-infected normal cervix | ||
| Endometrium | 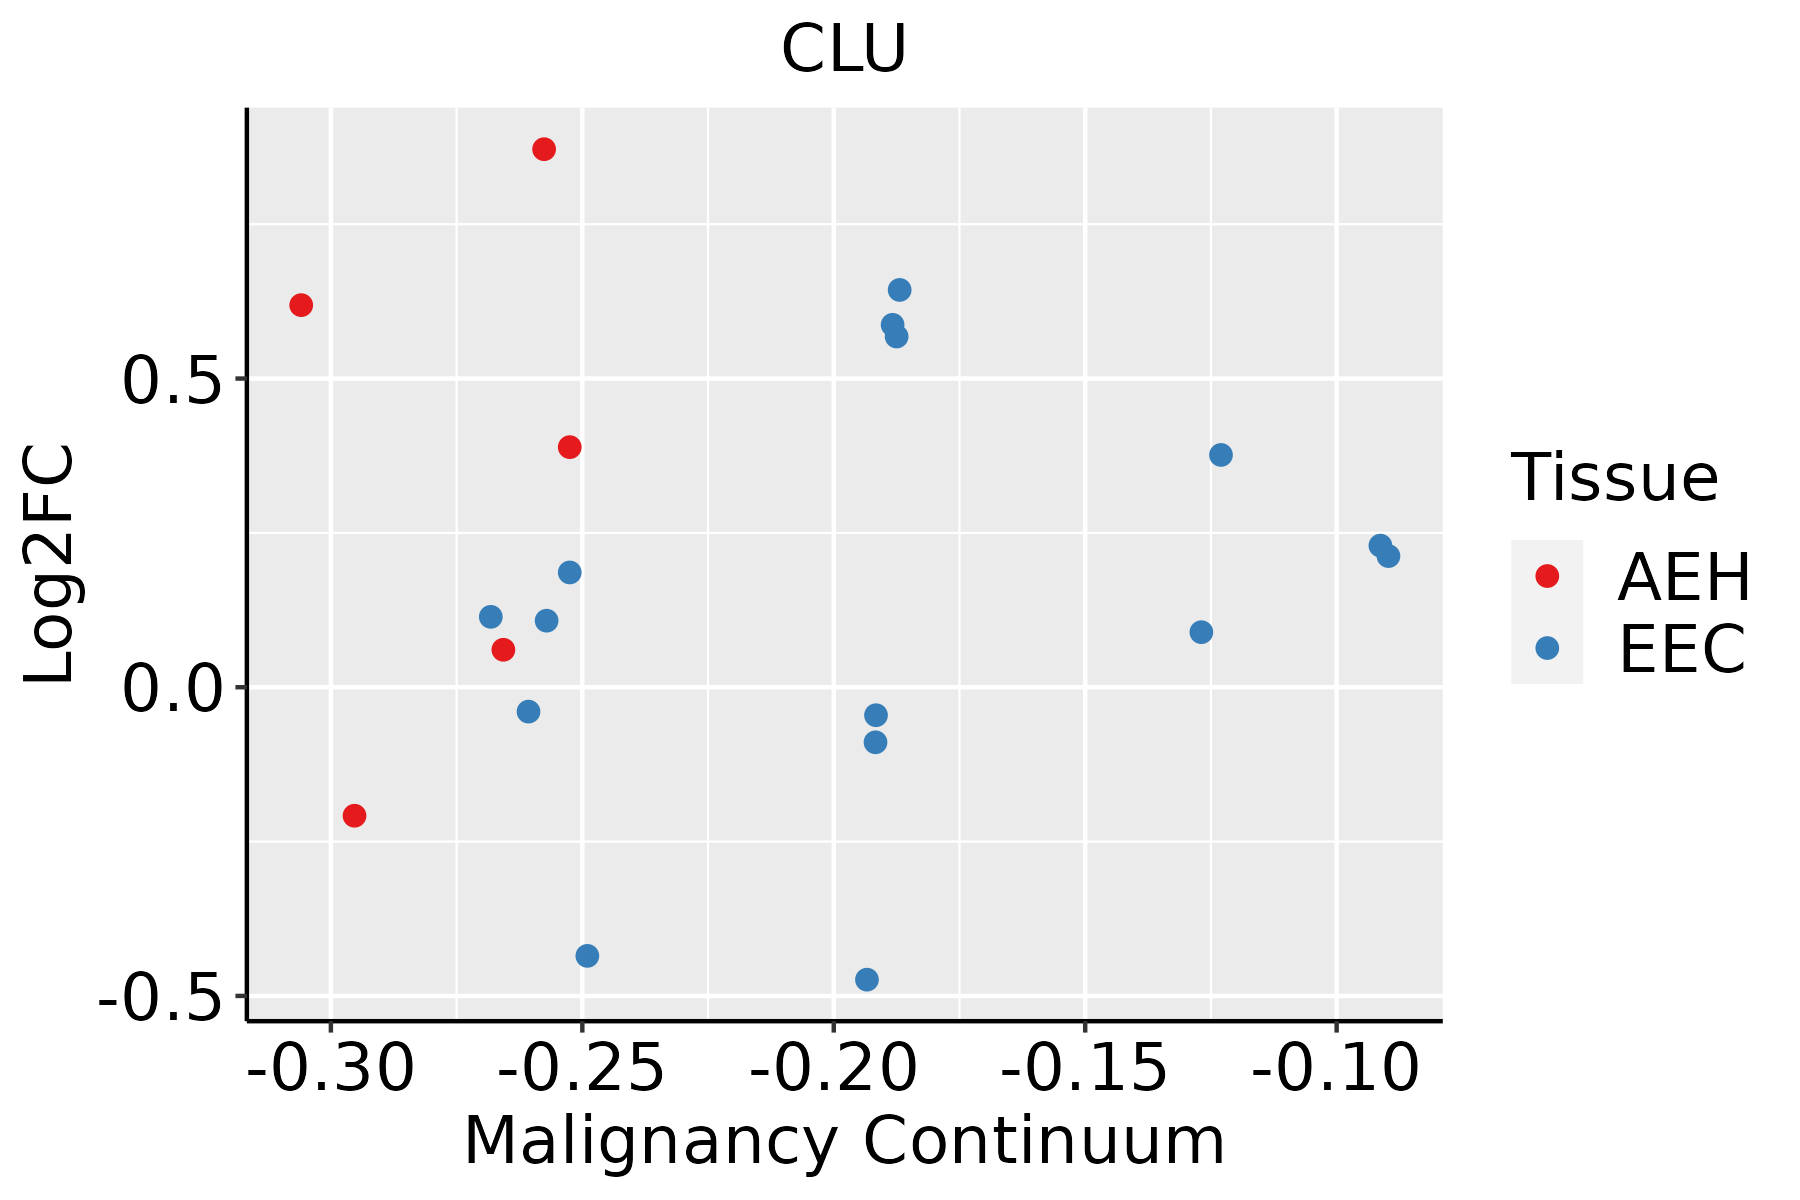 | AEH: Atypical endometrial hyperplasia |
| EEC: Endometrioid Cancer | ||
| Esophagus |  | ESCC: Esophageal squamous cell carcinoma |
| HGIN: High-grade intraepithelial neoplasias | ||
| LGIN: Low-grade intraepithelial neoplasias | ||
| GC | 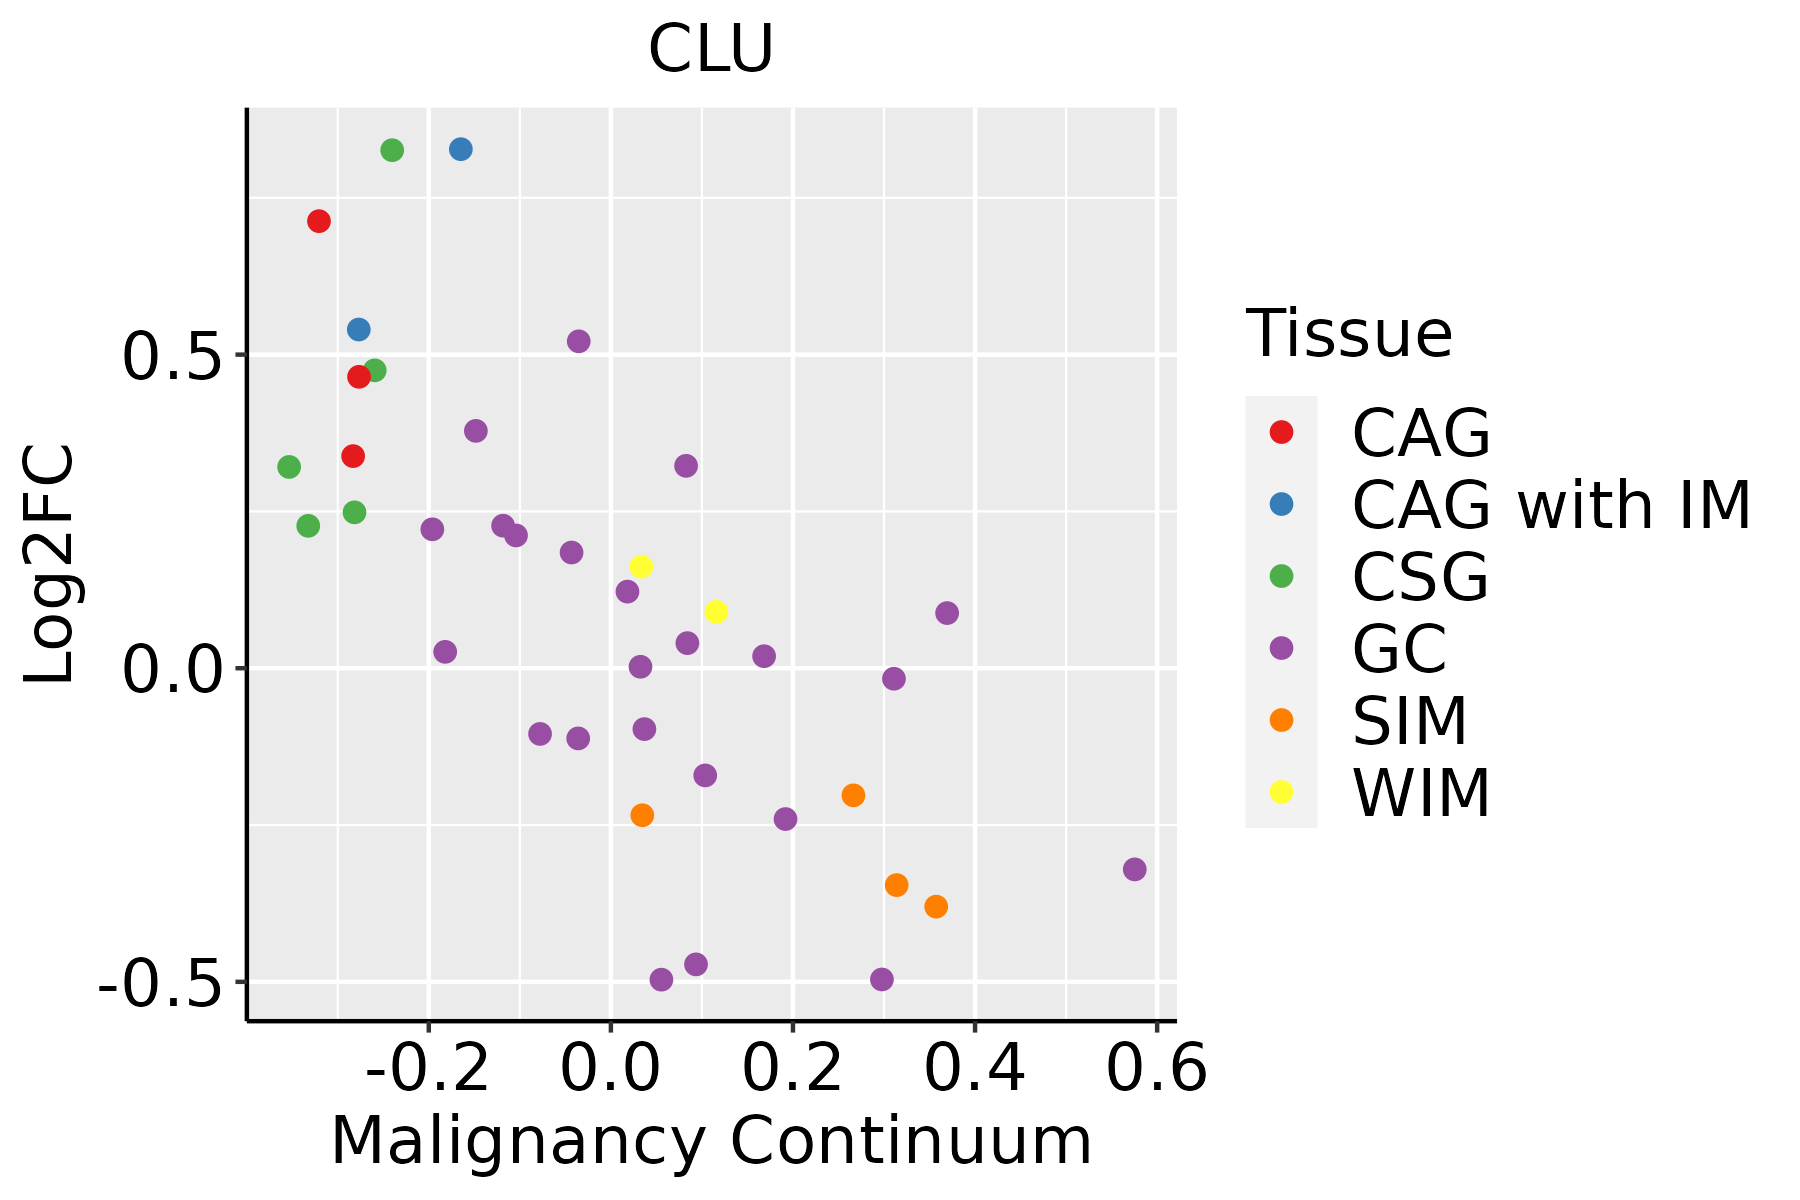 | CAG: Chronic atrophic gastritis |
| CAG with IM: Chronic atrophic gastritis with intestinal metaplasia | ||
| CSG: Chronic superficial gastritis | ||
| GC: Gastric cancer | ||
| SIM: Severe intestinal metaplasia | ||
| WIM: Wild intestinal metaplasia | ||
| Liver | 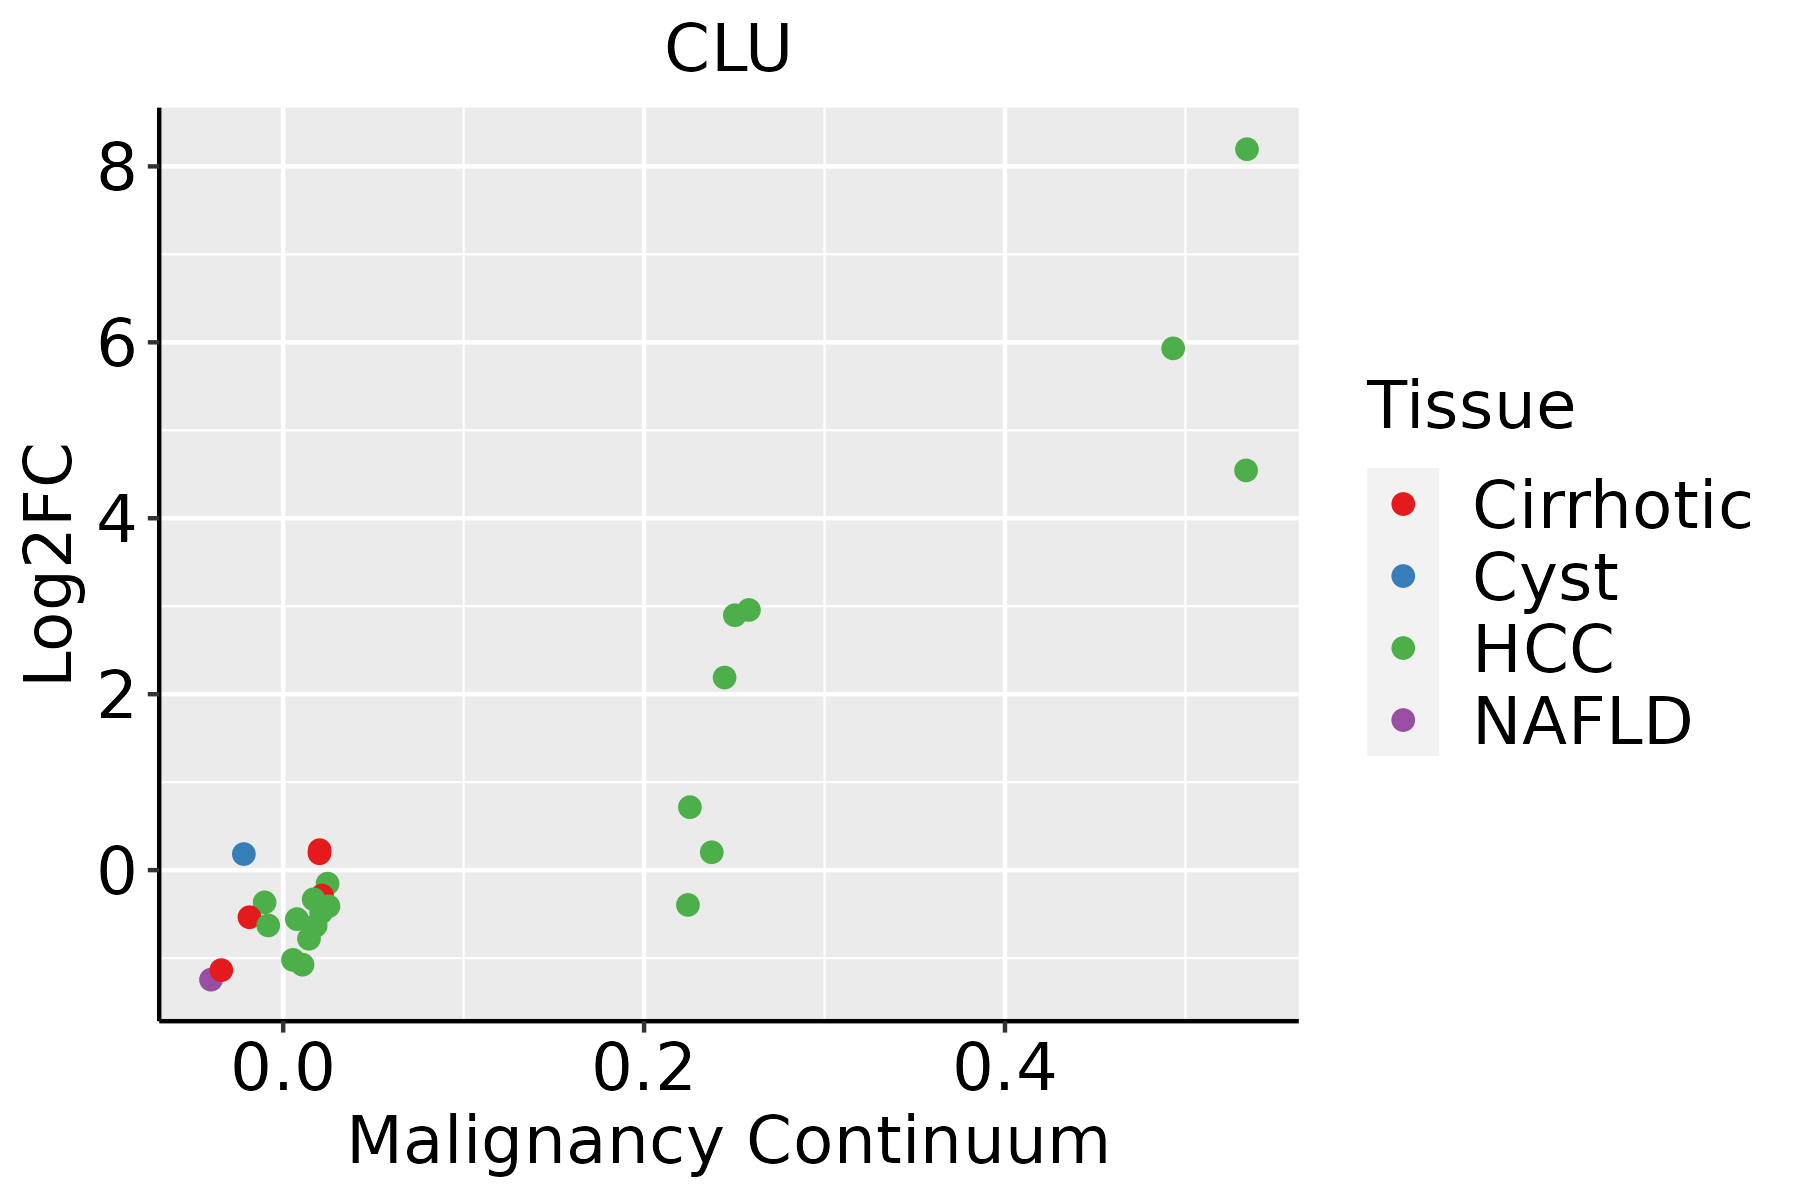 | HCC: Hepatocellular carcinoma |
| NAFLD: Non-alcoholic fatty liver disease | ||
| Oral Cavity | 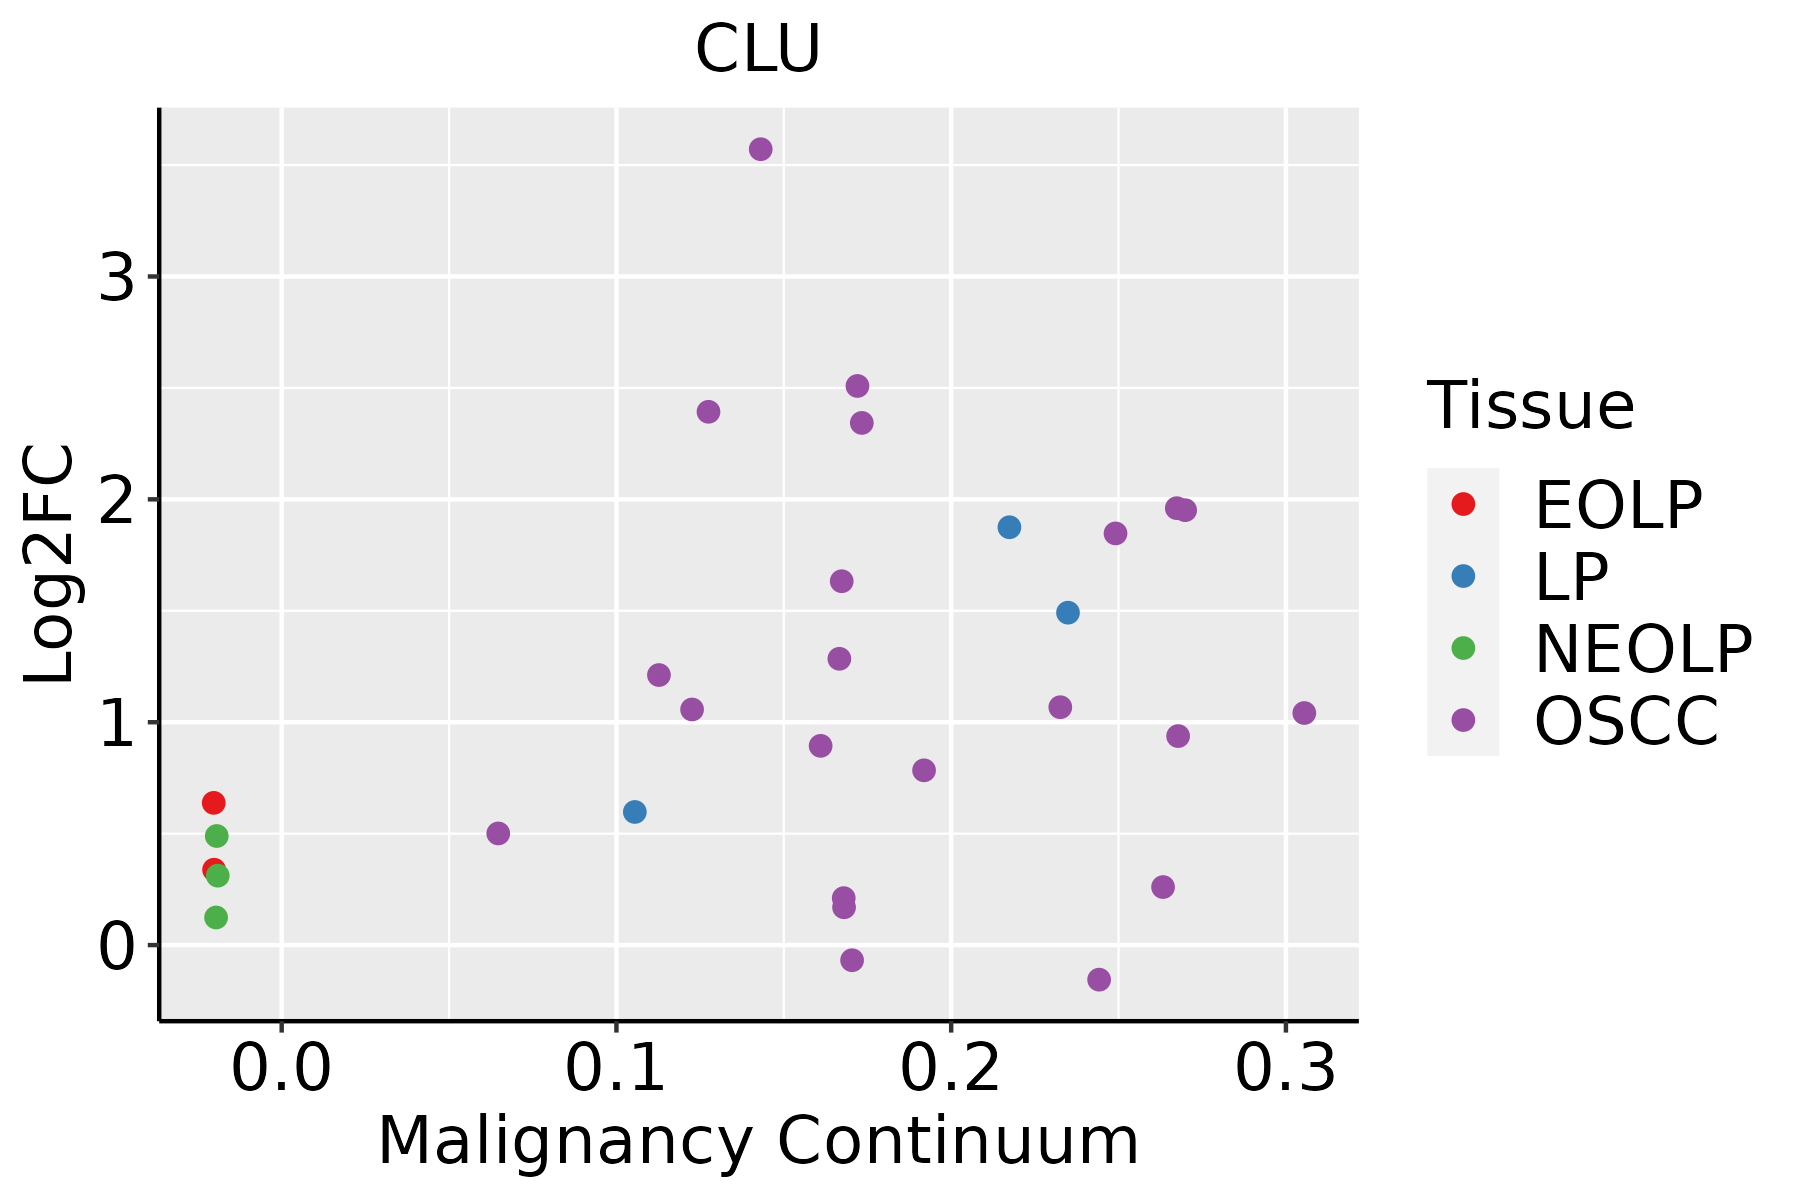 | EOLP: Erosive Oral lichen planus |
| LP: leukoplakia | ||
| NEOLP: Non-erosive oral lichen planus | ||
| OSCC: Oral squamous cell carcinoma | ||
| Prostate | 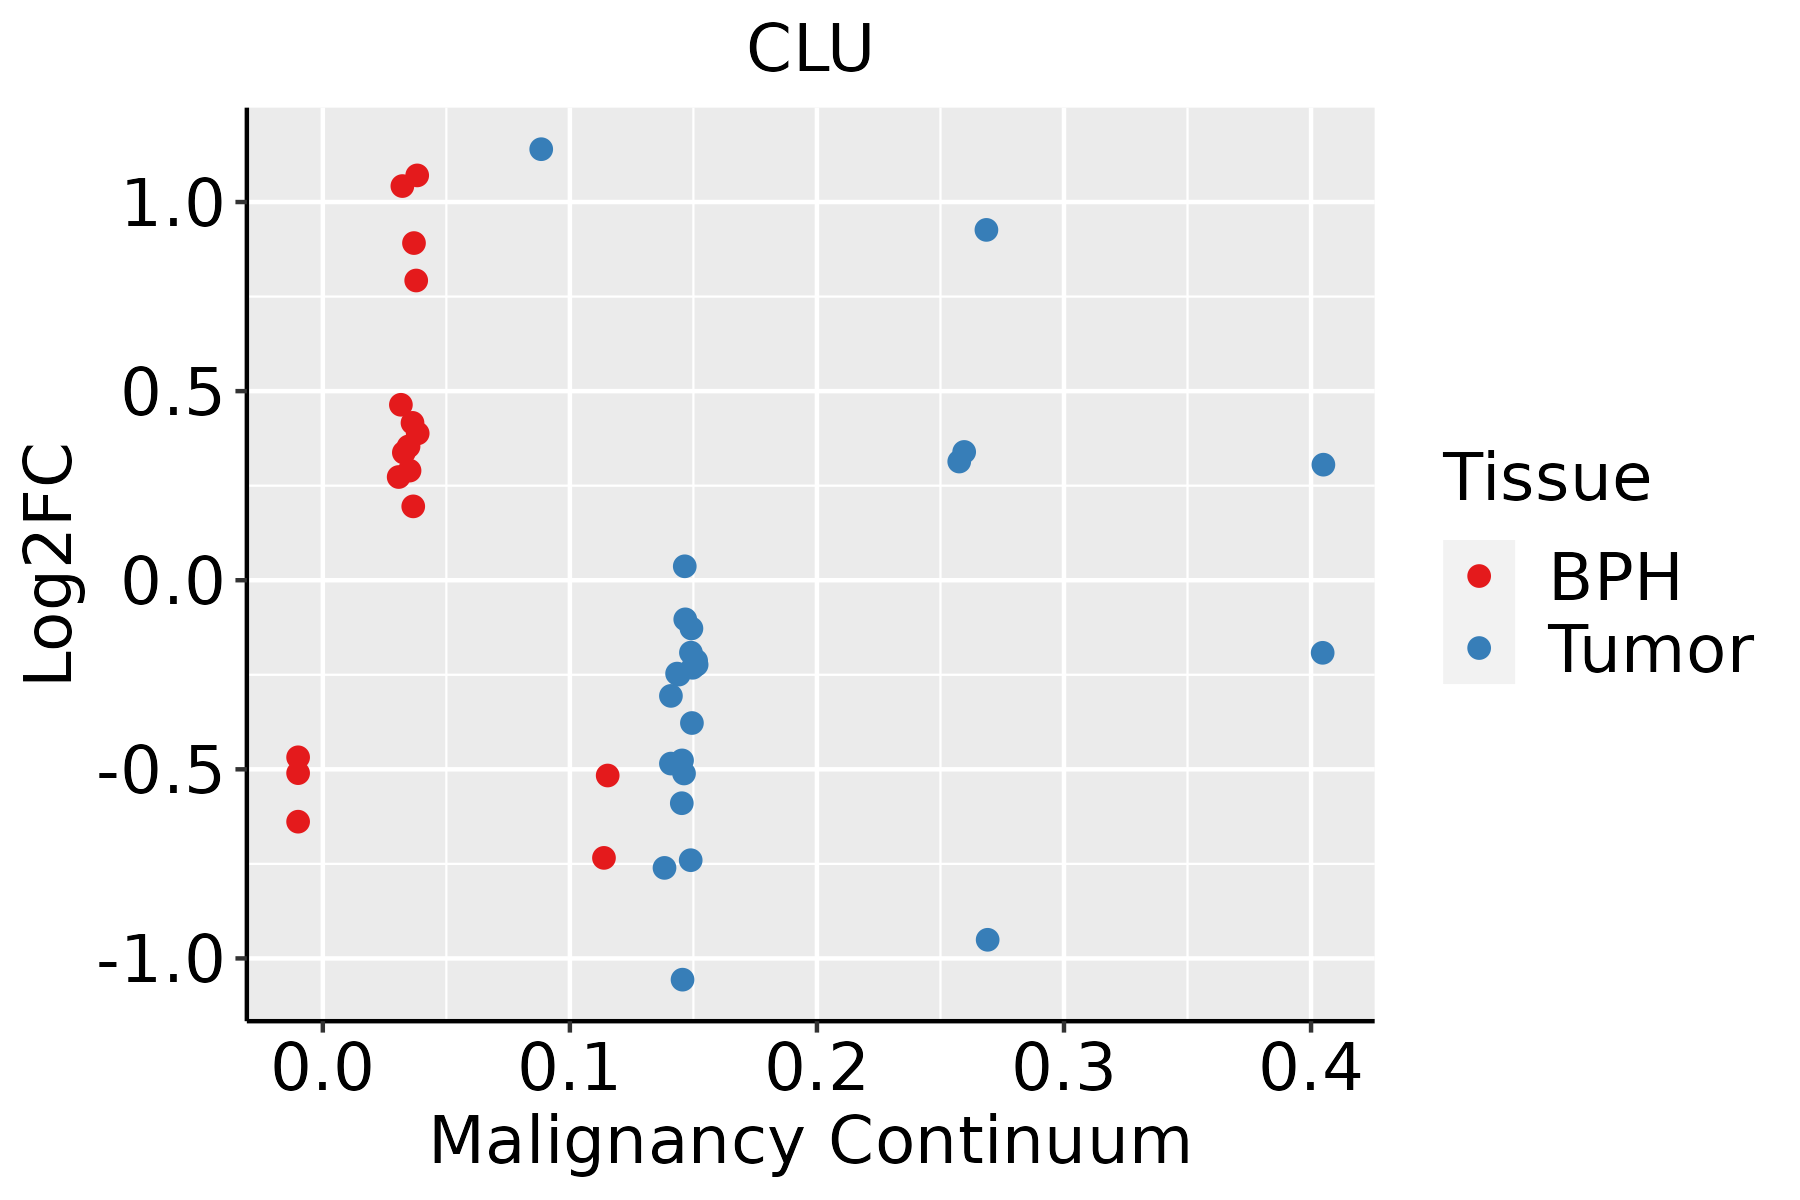 | BPH: Benign Prostatic Hyperplasia |
| Skin |  | AK: Actinic keratosis |
| cSCC: Cutaneous squamous cell carcinoma | ||
| SCCIS:squamous cell carcinoma in situ | ||
| Thyroid | 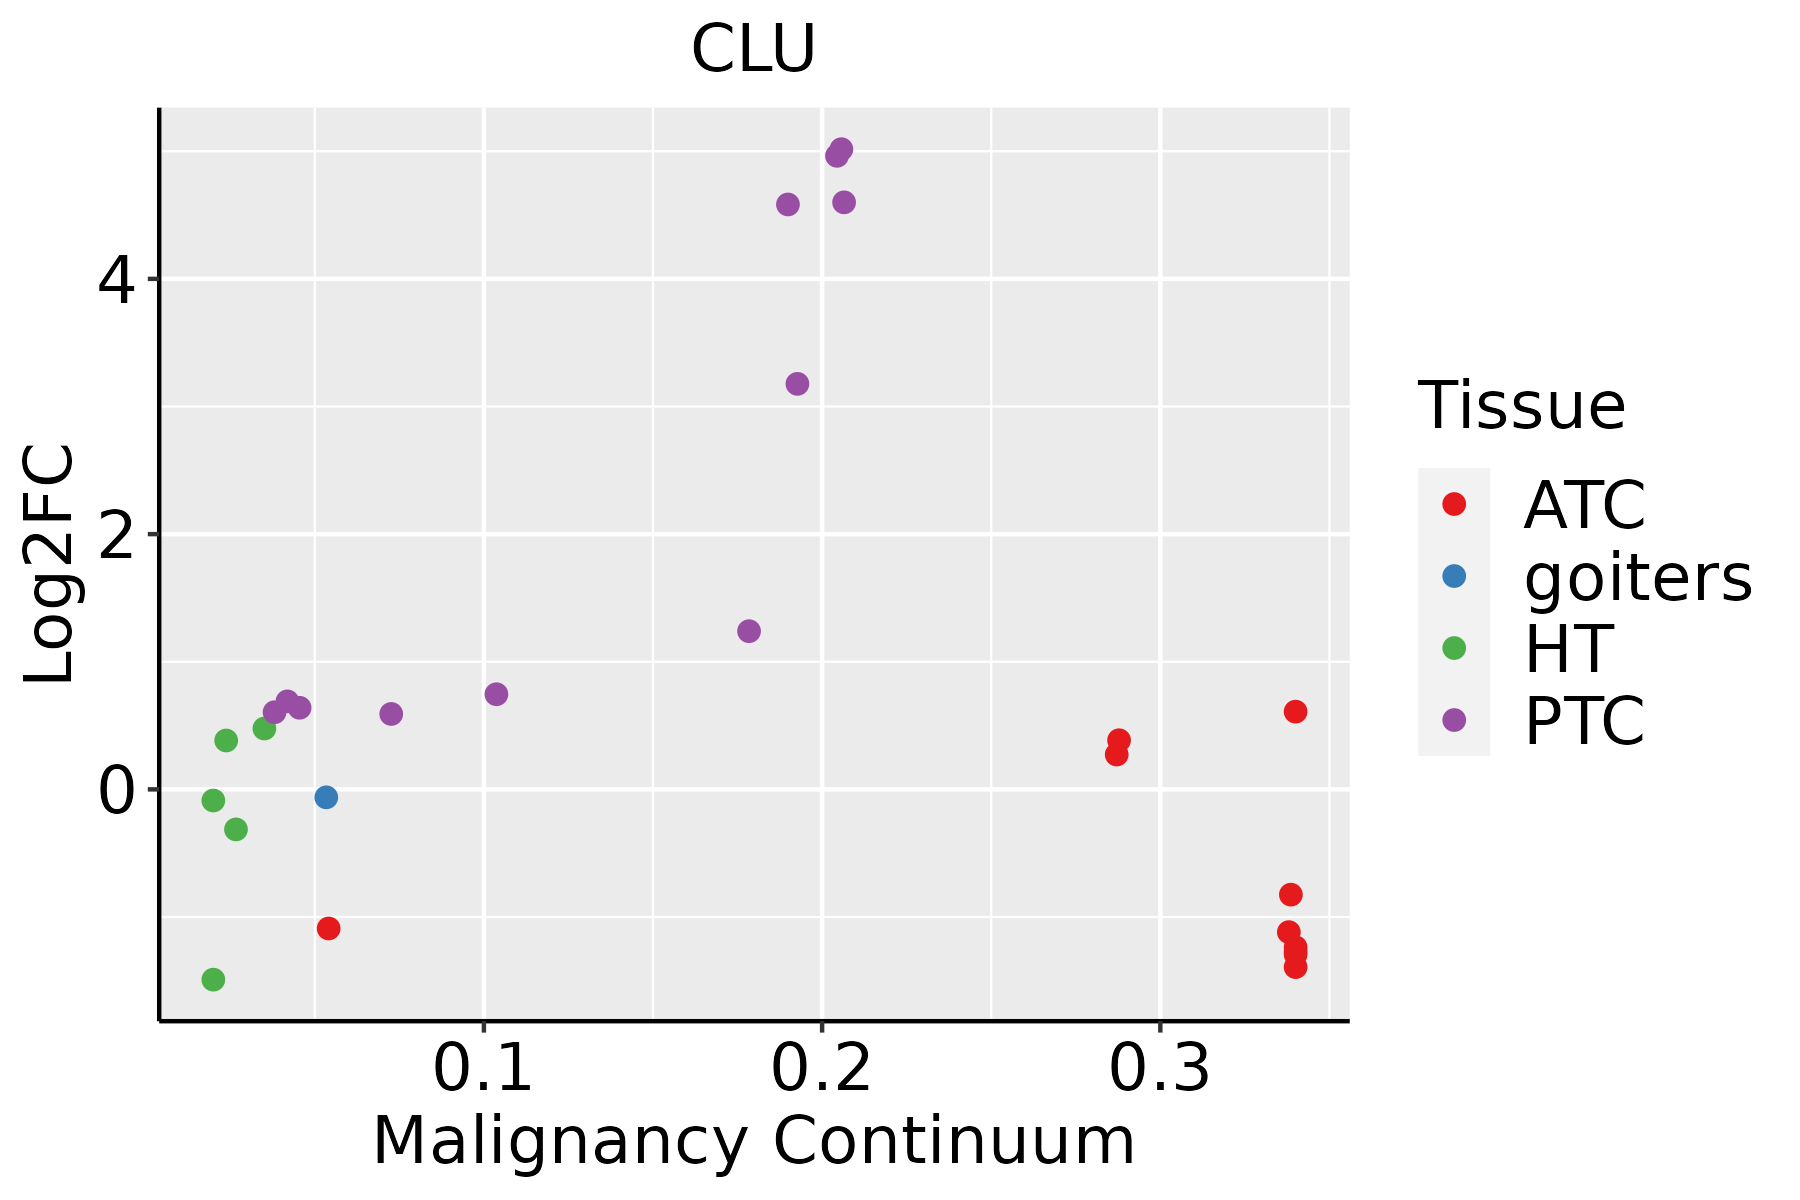 | ATC: Anaplastic thyroid cancer |
| HT: Hashimoto's thyroiditis | ||
| PTC: Papillary thyroid cancer |
| ∗log2FC in expression of this searched gene in stem-like cells from each diseased tissue sample relative to stem-like cells in normal samples in each tissue plotted against the malignancy continuum. Samples are colored based on if they are from different disease stage. |
Top |
Malignant transformation related pathway analysis |
| Find out the enriched GO biological processes and KEGG pathways involved in transition from healthy to precancer to cancer |
| Tissue | Disease Stage | Enriched GO biological Processes |
| Colorectum | AD |  |
| Colorectum | SER |  |
| Colorectum | MSS |  |
| Colorectum | MSI-H |  |
| Colorectum | FAP |  |
| ∗Top 15 enriched GO BP terms are showed in the bar plot of each disease state in each tissue. Each row represents a significant GO biological process which is colored according to the -log10(p.adjust). |
| Page: 1 2 3 4 5 6 7 8 9 |
| GO ID | Tissue | Disease Stage | Description | Gene Ratio | Bg Ratio | pvalue | p.adjust | Count |
| GO:001082123 | Oral cavity | EOLP | regulation of mitochondrion organization | 34/2218 | 144/18723 | 5.63e-05 | 7.18e-04 | 34 |
| GO:005109021 | Oral cavity | EOLP | regulation of DNA-binding transcription factor activity | 80/2218 | 440/18723 | 5.77e-05 | 7.31e-04 | 80 |
| GO:004825915 | Oral cavity | EOLP | regulation of receptor-mediated endocytosis | 28/2218 | 110/18723 | 6.12e-05 | 7.68e-04 | 28 |
| GO:000703422 | Oral cavity | EOLP | vacuolar transport | 36/2218 | 157/18723 | 6.66e-05 | 8.27e-04 | 36 |
| GO:200006024 | Oral cavity | EOLP | positive regulation of ubiquitin-dependent protein catabolic process | 27/2218 | 107/18723 | 9.64e-05 | 1.12e-03 | 27 |
| GO:190357324 | Oral cavity | EOLP | negative regulation of response to endoplasmic reticulum stress | 15/2218 | 44/18723 | 9.66e-05 | 1.12e-03 | 15 |
| GO:007266613 | Oral cavity | EOLP | establishment of protein localization to vacuole | 16/2218 | 49/18723 | 1.03e-04 | 1.17e-03 | 16 |
| GO:190290424 | Oral cavity | EOLP | negative regulation of supramolecular fiber organization | 37/2218 | 167/18723 | 1.14e-04 | 1.27e-03 | 37 |
| GO:003367419 | Oral cavity | EOLP | positive regulation of kinase activity | 82/2218 | 467/18723 | 1.58e-04 | 1.68e-03 | 82 |
| GO:190589724 | Oral cavity | EOLP | regulation of response to endoplasmic reticulum stress | 22/2218 | 82/18723 | 1.60e-04 | 1.69e-03 | 22 |
| GO:000863023 | Oral cavity | EOLP | intrinsic apoptotic signaling pathway in response to DNA damage | 25/2218 | 99/18723 | 1.70e-04 | 1.78e-03 | 25 |
| GO:190121423 | Oral cavity | EOLP | regulation of neuron death | 60/2218 | 319/18723 | 1.83e-04 | 1.87e-03 | 60 |
| GO:000662314 | Oral cavity | EOLP | protein targeting to vacuole | 13/2218 | 37/18723 | 1.98e-04 | 2.00e-03 | 13 |
| GO:007266522 | Oral cavity | EOLP | protein localization to vacuole | 19/2218 | 67/18723 | 2.01e-04 | 2.02e-03 | 19 |
| GO:000704122 | Oral cavity | EOLP | lysosomal transport | 27/2218 | 114/18723 | 2.97e-04 | 2.79e-03 | 27 |
| GO:190305224 | Oral cavity | EOLP | positive regulation of proteolysis involved in cellular protein catabolic process | 30/2218 | 133/18723 | 3.51e-04 | 3.21e-03 | 30 |
| GO:004542816 | Oral cavity | EOLP | regulation of nitric oxide biosynthetic process | 17/2218 | 62/18723 | 6.56e-04 | 5.46e-03 | 17 |
| GO:003243623 | Oral cavity | EOLP | positive regulation of proteasomal ubiquitin-dependent protein catabolic process | 22/2218 | 90/18723 | 6.59e-04 | 5.48e-03 | 22 |
| GO:000662212 | Oral cavity | EOLP | protein targeting to lysosome | 9/2218 | 23/18723 | 7.79e-04 | 6.22e-03 | 9 |
| GO:008016416 | Oral cavity | EOLP | regulation of nitric oxide metabolic process | 17/2218 | 64/18723 | 9.71e-04 | 7.35e-03 | 17 |
| Page: 1 2 3 4 5 6 7 8 9 10 11 12 13 14 15 16 17 18 19 20 21 22 23 24 25 26 27 28 29 30 31 32 33 34 35 36 37 38 39 40 41 42 43 44 45 46 47 48 49 50 51 52 53 54 55 56 57 58 59 60 61 62 63 64 65 66 67 68 69 70 71 72 73 74 75 76 77 78 79 80 81 82 83 84 85 86 87 88 89 90 91 92 93 94 95 96 97 98 99 100 101 102 103 104 105 106 107 108 109 110 111 112 113 114 |
| Pathway ID | Tissue | Disease Stage | Description | Gene Ratio | Bg Ratio | pvalue | p.adjust | qvalue | Count |
| hsa04610 | Liver | NAFLD | Complement and coagulation cascades | 35/1043 | 86/8465 | 2.48e-11 | 2.04e-09 | 1.64e-09 | 35 |
| hsa046101 | Liver | NAFLD | Complement and coagulation cascades | 35/1043 | 86/8465 | 2.48e-11 | 2.04e-09 | 1.64e-09 | 35 |
| hsa046102 | Liver | Cirrhotic | Complement and coagulation cascades | 48/2530 | 86/8465 | 4.41e-07 | 5.44e-06 | 3.35e-06 | 48 |
| hsa046103 | Liver | Cirrhotic | Complement and coagulation cascades | 48/2530 | 86/8465 | 4.41e-07 | 5.44e-06 | 3.35e-06 | 48 |
| hsa046104 | Liver | HCC | Complement and coagulation cascades | 57/4020 | 86/8465 | 3.19e-04 | 1.45e-03 | 8.04e-04 | 57 |
| hsa046105 | Liver | HCC | Complement and coagulation cascades | 57/4020 | 86/8465 | 3.19e-04 | 1.45e-03 | 8.04e-04 | 57 |
| Page: 1 |
Top |
Cell-cell communication analysis |
| Identification of potential cell-cell interactions between two cell types and their ligand-receptor pairs for different disease states |
| Ligand | Receptor | LRpair | Pathway | Tissue | Disease Stage |
| Page: 1 |
Top |
Single-cell gene regulatory network inference analysis |
| Find out the significant the regulons (TFs) and the target genes of each regulon across cell types for different disease states |
| TF | Cell Type | Tissue | Disease Stage | Target Gene | RSS | Regulon Activity |
| ∗The dot plots of a searched regulon are shown for all cell subpopulations in each disease state of each tissue based on the regulon specific score inferred using pySCENIC and by calculating the average expression. |
| Page: 1 |
Top |
Somatic mutation of malignant transformation related genes |
| Annotation of somatic variants for genes involved in malignant transformation |
| Hugo Symbol | Variant Class | Variant Classification | dbSNP RS | HGVSc | HGVSp | HGVSp Short | SWISSPROT | BIOTYPE | SIFT | PolyPhen | Tumor Sample Barcode | Tissue | Histology | Sex | Age | Stage | Therapy Types | Drugs | Outcome |
| CLU | SNV | Missense_Mutation | novel | c.1199C>T | p.Ser400Phe | p.S400F | P10909 | protein_coding | deleterious(0) | possibly_damaging(0.708) | TCGA-3C-AALI-01 | Breast | breast invasive carcinoma | Female | <65 | I/II | Unspecific | Poly E | Complete Response |
| CLU | SNV | Missense_Mutation | novel | c.862N>G | p.Ile288Val | p.I288V | P10909 | protein_coding | deleterious(0.04) | possibly_damaging(0.524) | TCGA-D8-A1JF-01 | Breast | breast invasive carcinoma | Female | >=65 | III/IV | Unknown | Unknown | SD |
| CLU | SNV | Missense_Mutation | novel | c.58N>T | p.Val20Phe | p.V20F | P10909 | protein_coding | deleterious(0.01) | probably_damaging(0.991) | TCGA-V7-A7HQ-01 | Breast | breast invasive carcinoma | Female | >=65 | III/IV | Hormone Therapy | letrozole | CR |
| CLU | SNV | Missense_Mutation | c.139N>A | p.Gln47Lys | p.Q47K | P10909 | protein_coding | tolerated(0.31) | benign(0.005) | TCGA-AA-3510-01 | Colorectum | colon adenocarcinoma | Male | >=65 | I/II | Unknown | Unknown | SD | |
| CLU | SNV | Missense_Mutation | c.1027N>A | p.Glu343Lys | p.E343K | P10909 | protein_coding | tolerated(0.23) | possibly_damaging(0.503) | TCGA-AA-3672-01 | Colorectum | colon adenocarcinoma | Female | >=65 | III/IV | Unknown | Unknown | SD | |
| CLU | SNV | Missense_Mutation | rs769830551 | c.679C>T | p.Arg227Cys | p.R227C | P10909 | protein_coding | deleterious(0) | probably_damaging(1) | TCGA-AA-A01K-01 | Colorectum | colon adenocarcinoma | Female | >=65 | III/IV | Chemotherapy | folinic | CR |
| CLU | SNV | Missense_Mutation | rs146625005 | c.1135N>A | p.Glu379Lys | p.E379K | P10909 | protein_coding | tolerated(0.5) | benign(0.195) | TCGA-AA-A01R-01 | Colorectum | colon adenocarcinoma | Male | <65 | III/IV | Chemotherapy | 5-fluorouracil | PD |
| CLU | SNV | Missense_Mutation | c.236N>T | p.Lys79Met | p.K79M | P10909 | protein_coding | tolerated(0.08) | probably_damaging(0.995) | TCGA-AA-A02O-01 | Colorectum | colon adenocarcinoma | Male | >=65 | I/II | Unknown | Unknown | SD | |
| CLU | SNV | Missense_Mutation | novel | c.98N>G | p.Glu33Gly | p.E33G | P10909 | protein_coding | deleterious(0) | probably_damaging(0.949) | TCGA-AZ-4315-01 | Colorectum | colon adenocarcinoma | Male | <65 | I/II | Unknown | Unknown | SD |
| CLU | SNV | Missense_Mutation | c.657N>G | p.Phe219Leu | p.F219L | P10909 | protein_coding | tolerated(0.77) | benign(0.015) | TCGA-CK-4951-01 | Colorectum | colon adenocarcinoma | Female | >=65 | I/II | Unknown | Unknown | PD |
| Page: 1 2 3 4 |
Top |
Related drugs of malignant transformation related genes |
| Identification of chemicals and drugs interact with genes involved in malignant transfromation |
| (DGIdb 4.0) |
| Entrez ID | Symbol | Category | Interaction Types | Drug Claim Name | Drug Name | PMIDs |
| 1191 | CLU | CELL SURFACE, DRUGGABLE GENOME | OGX-011 | CUSTIRSEN SODIUM | ||
| 1191 | CLU | CELL SURFACE, DRUGGABLE GENOME | antisense oligonucleotide | CUSTIRSEN | CUSTIRSEN | |
| 1191 | CLU | CELL SURFACE, DRUGGABLE GENOME | PMSG | 1547735 | ||
| 1191 | CLU | CELL SURFACE, DRUGGABLE GENOME | inhibitor | OGX-011 | CUSTIRSEN SODIUM | |
| 1191 | CLU | CELL SURFACE, DRUGGABLE GENOME | LUBIPROSTONE | LUBIPROSTONE |
| Page: 1 |

Copyright 2023-Present -The University of Texas Health Science Center at Houston |