| Tissue | Expression Dynamics | Abbreviation |
| Endometrium | 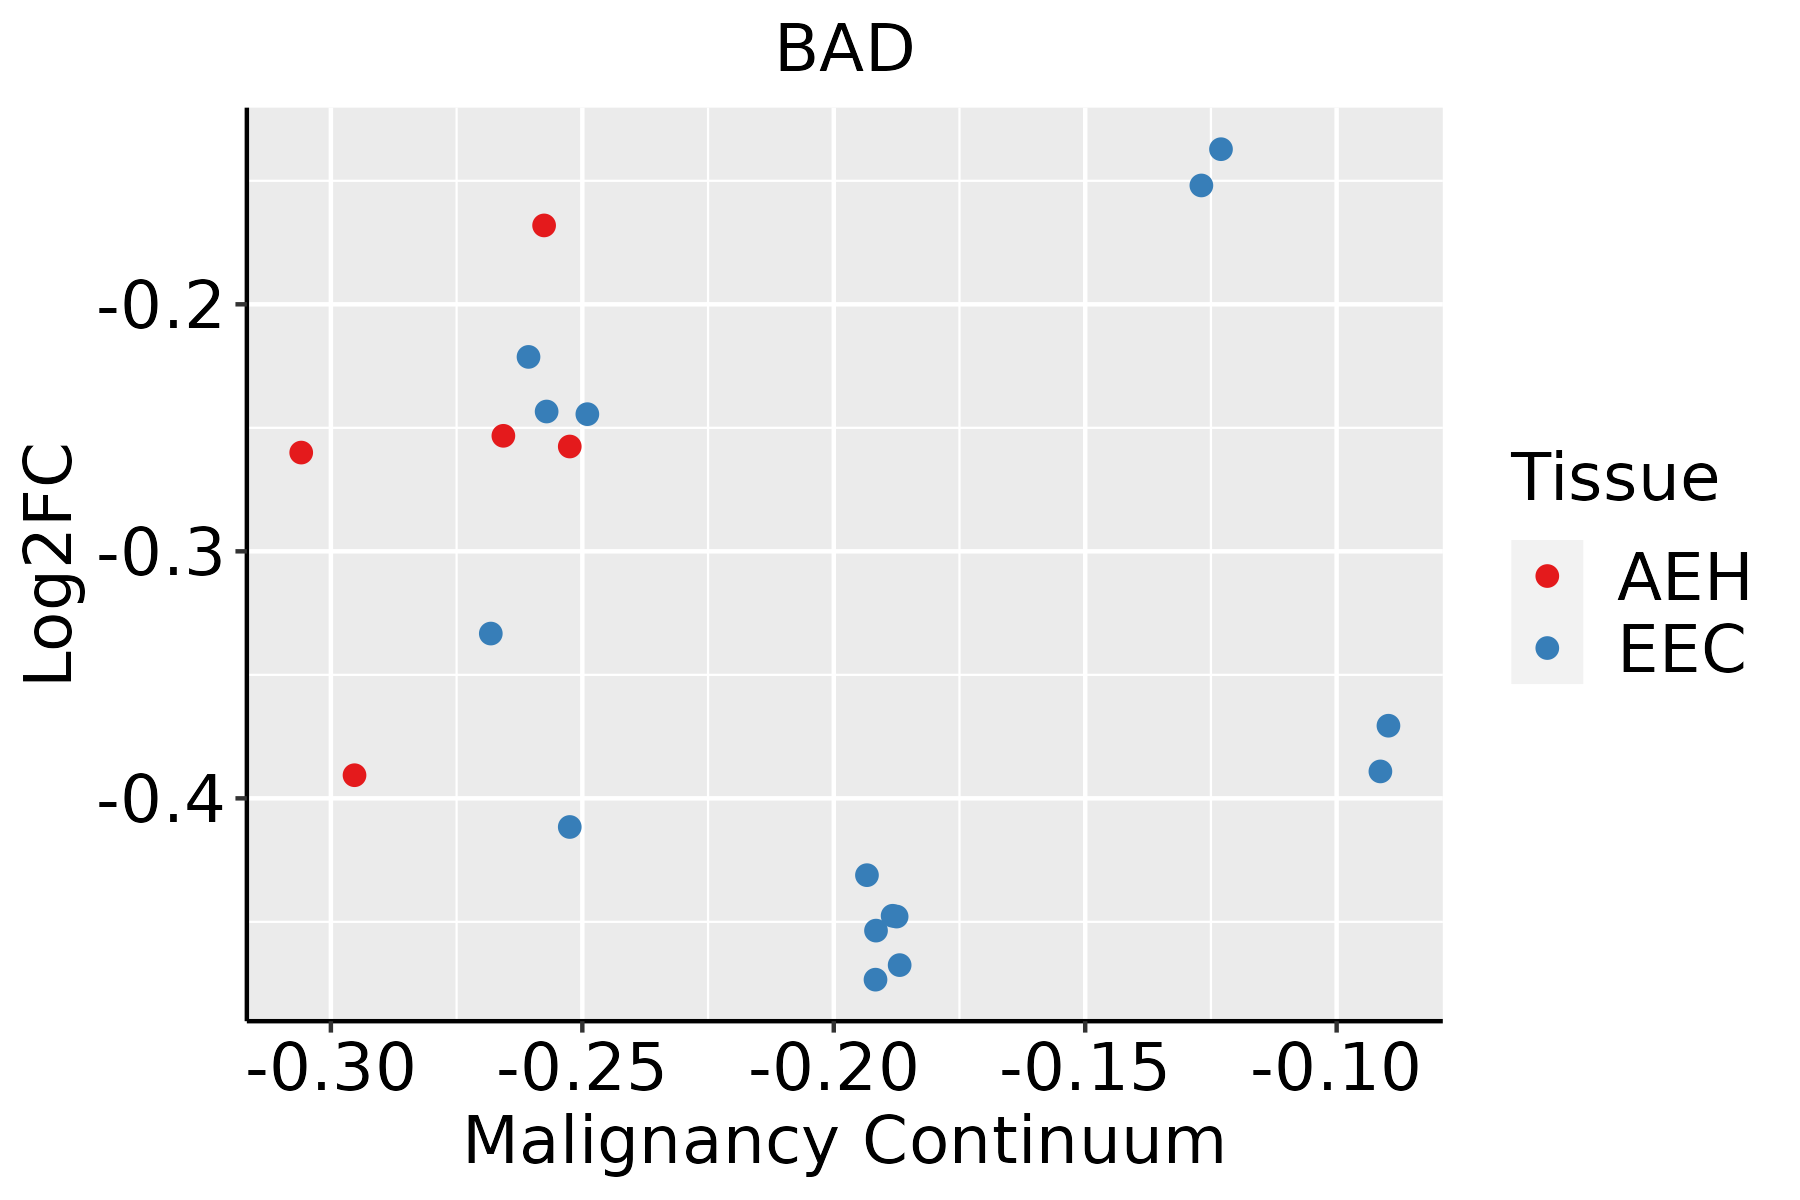 | AEH: Atypical endometrial hyperplasia |
| EEC: Endometrioid Cancer |
| Esophagus | 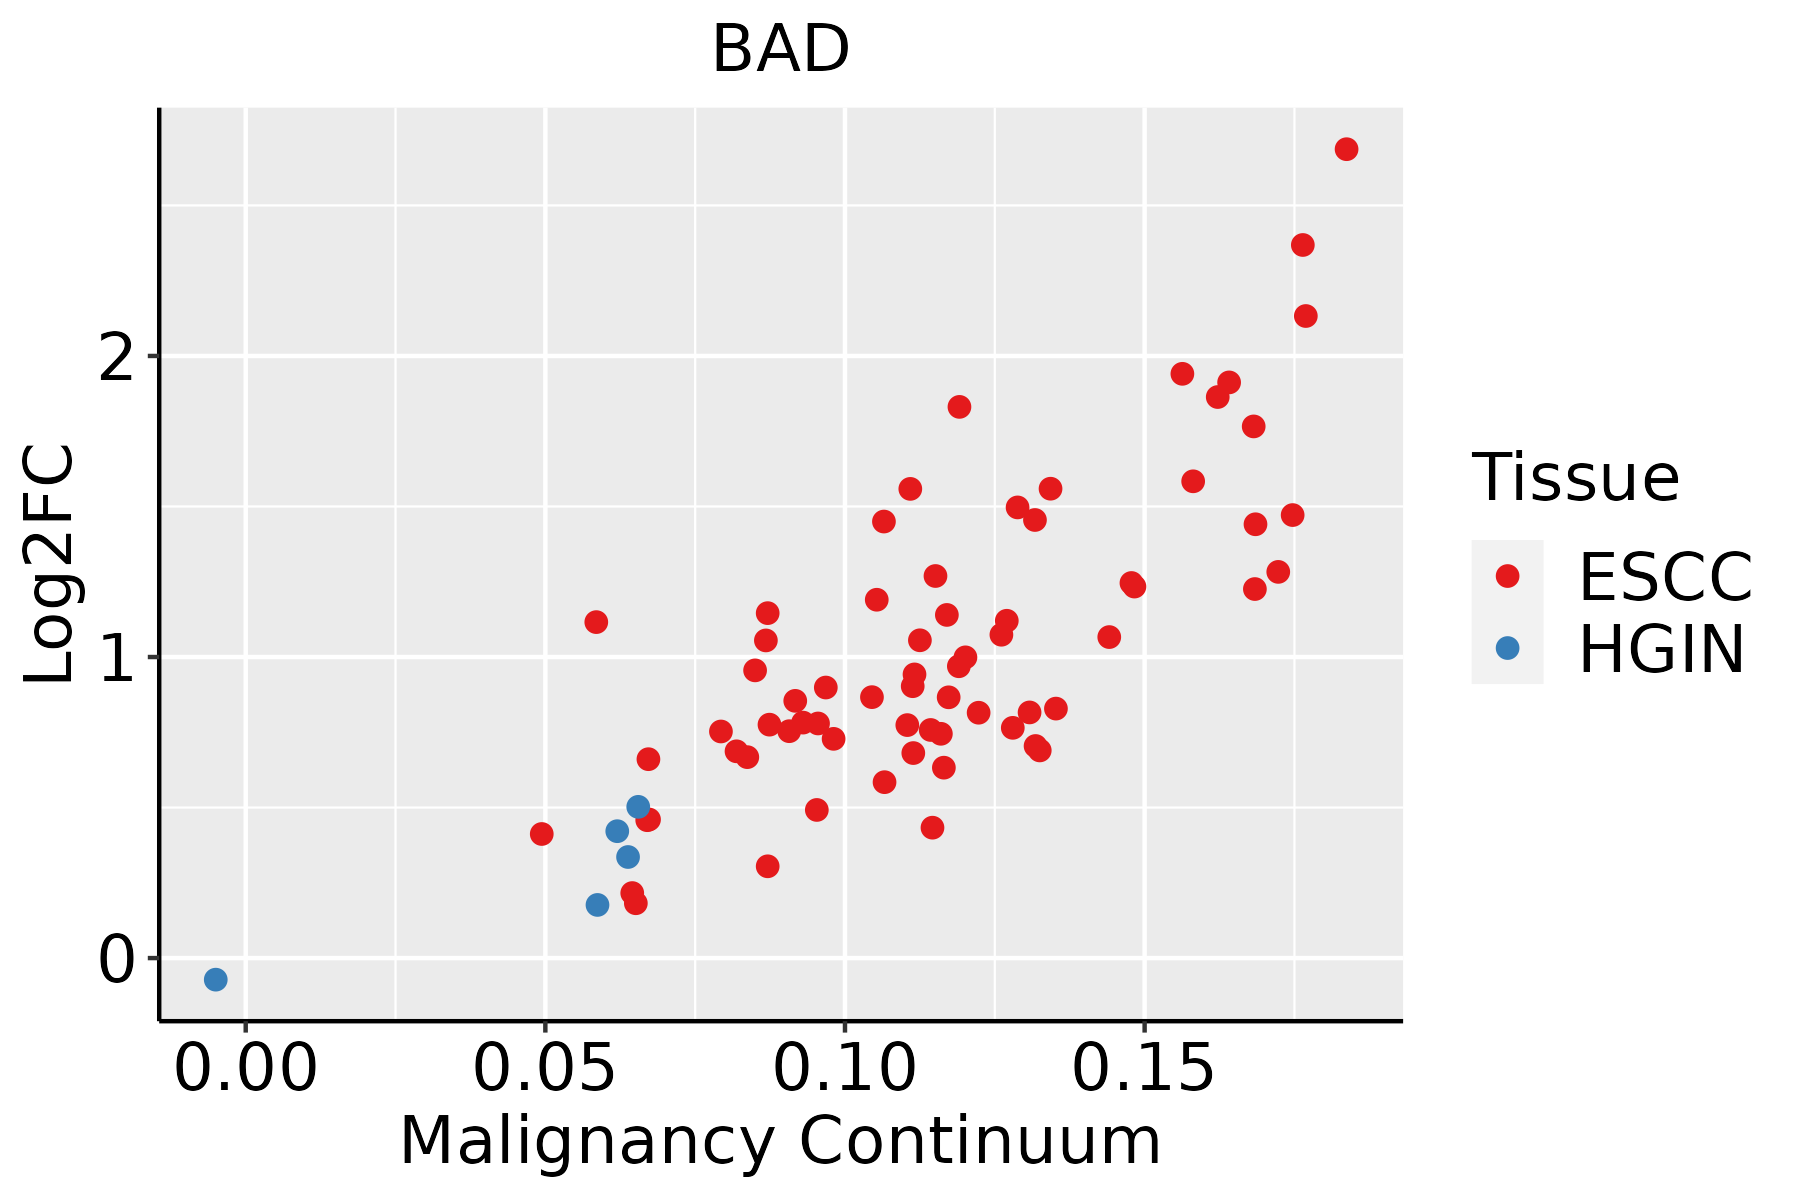 | ESCC: Esophageal squamous cell carcinoma |
| HGIN: High-grade intraepithelial neoplasias |
| LGIN: Low-grade intraepithelial neoplasias |
| Liver | 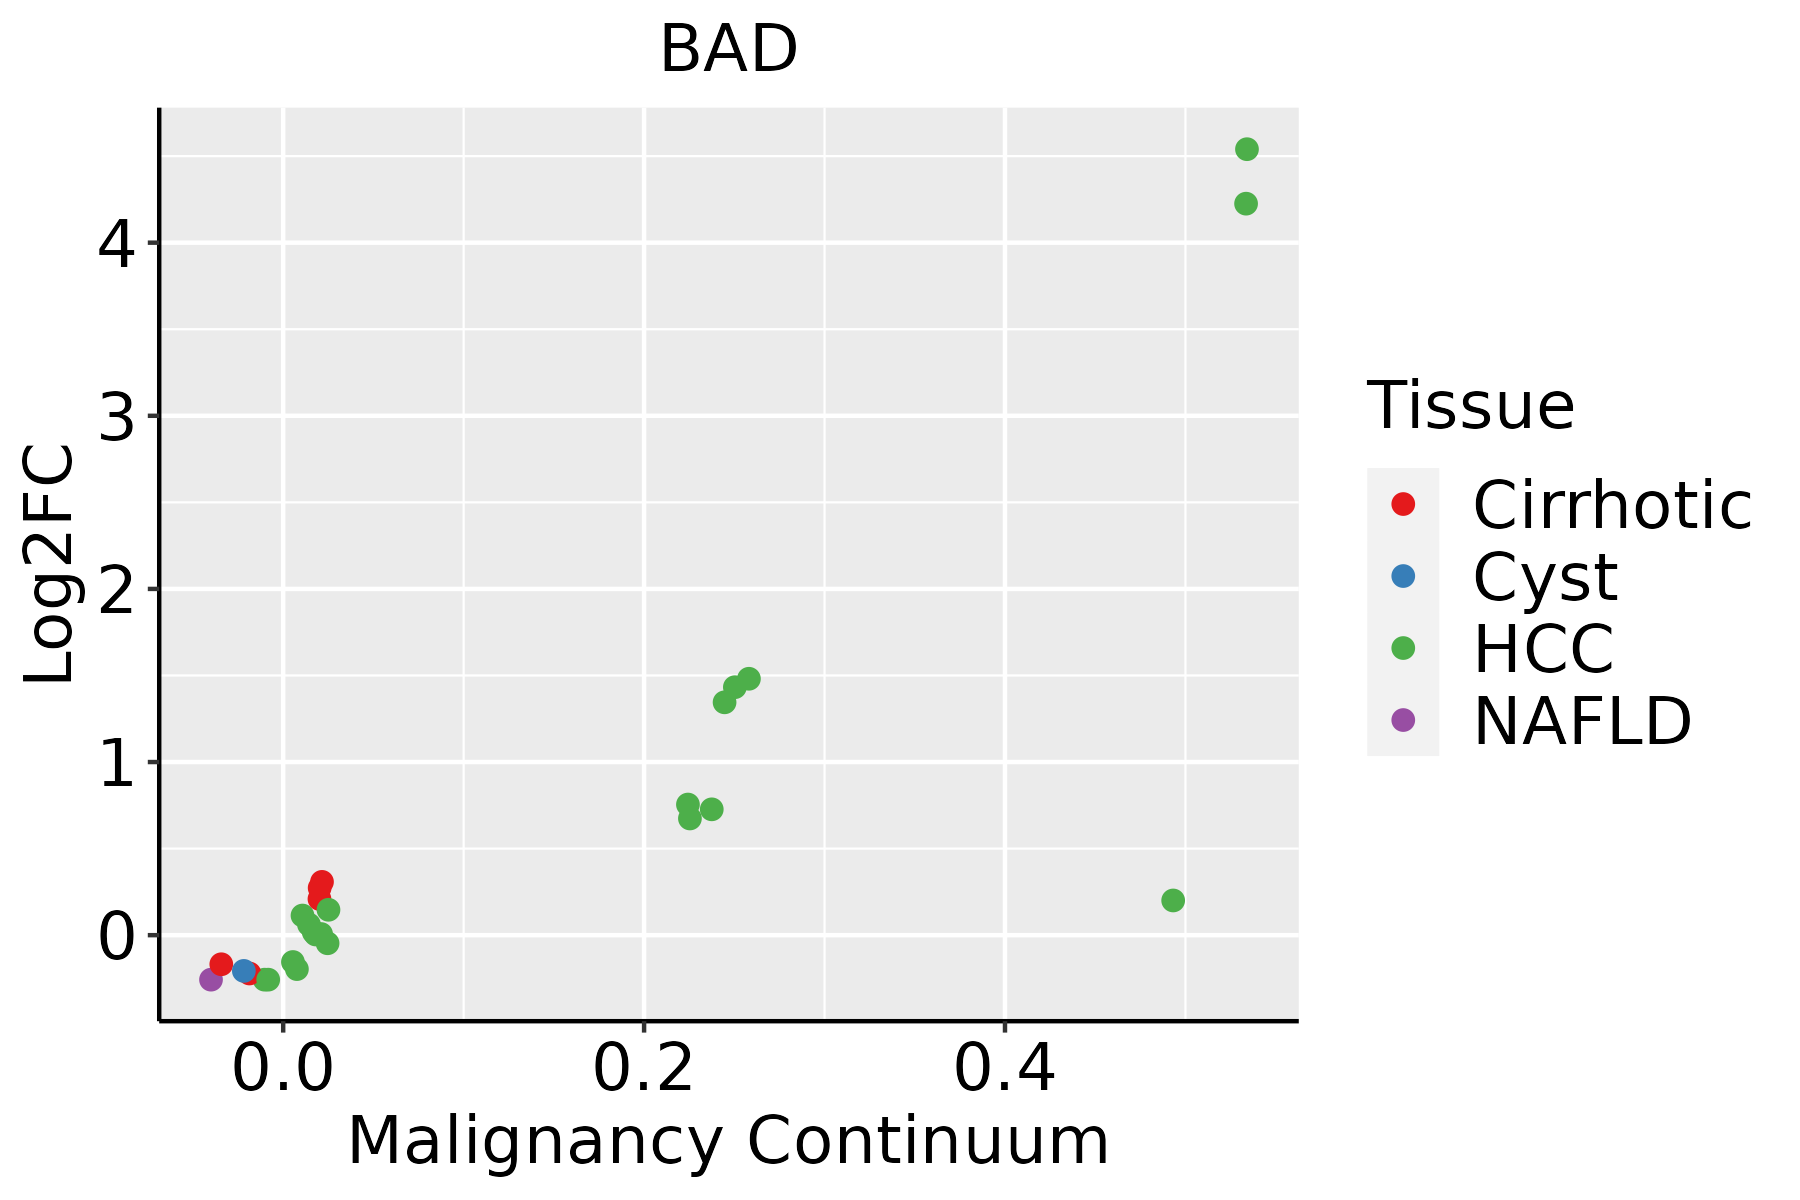 | HCC: Hepatocellular carcinoma |
| NAFLD: Non-alcoholic fatty liver disease |
| Oral Cavity | 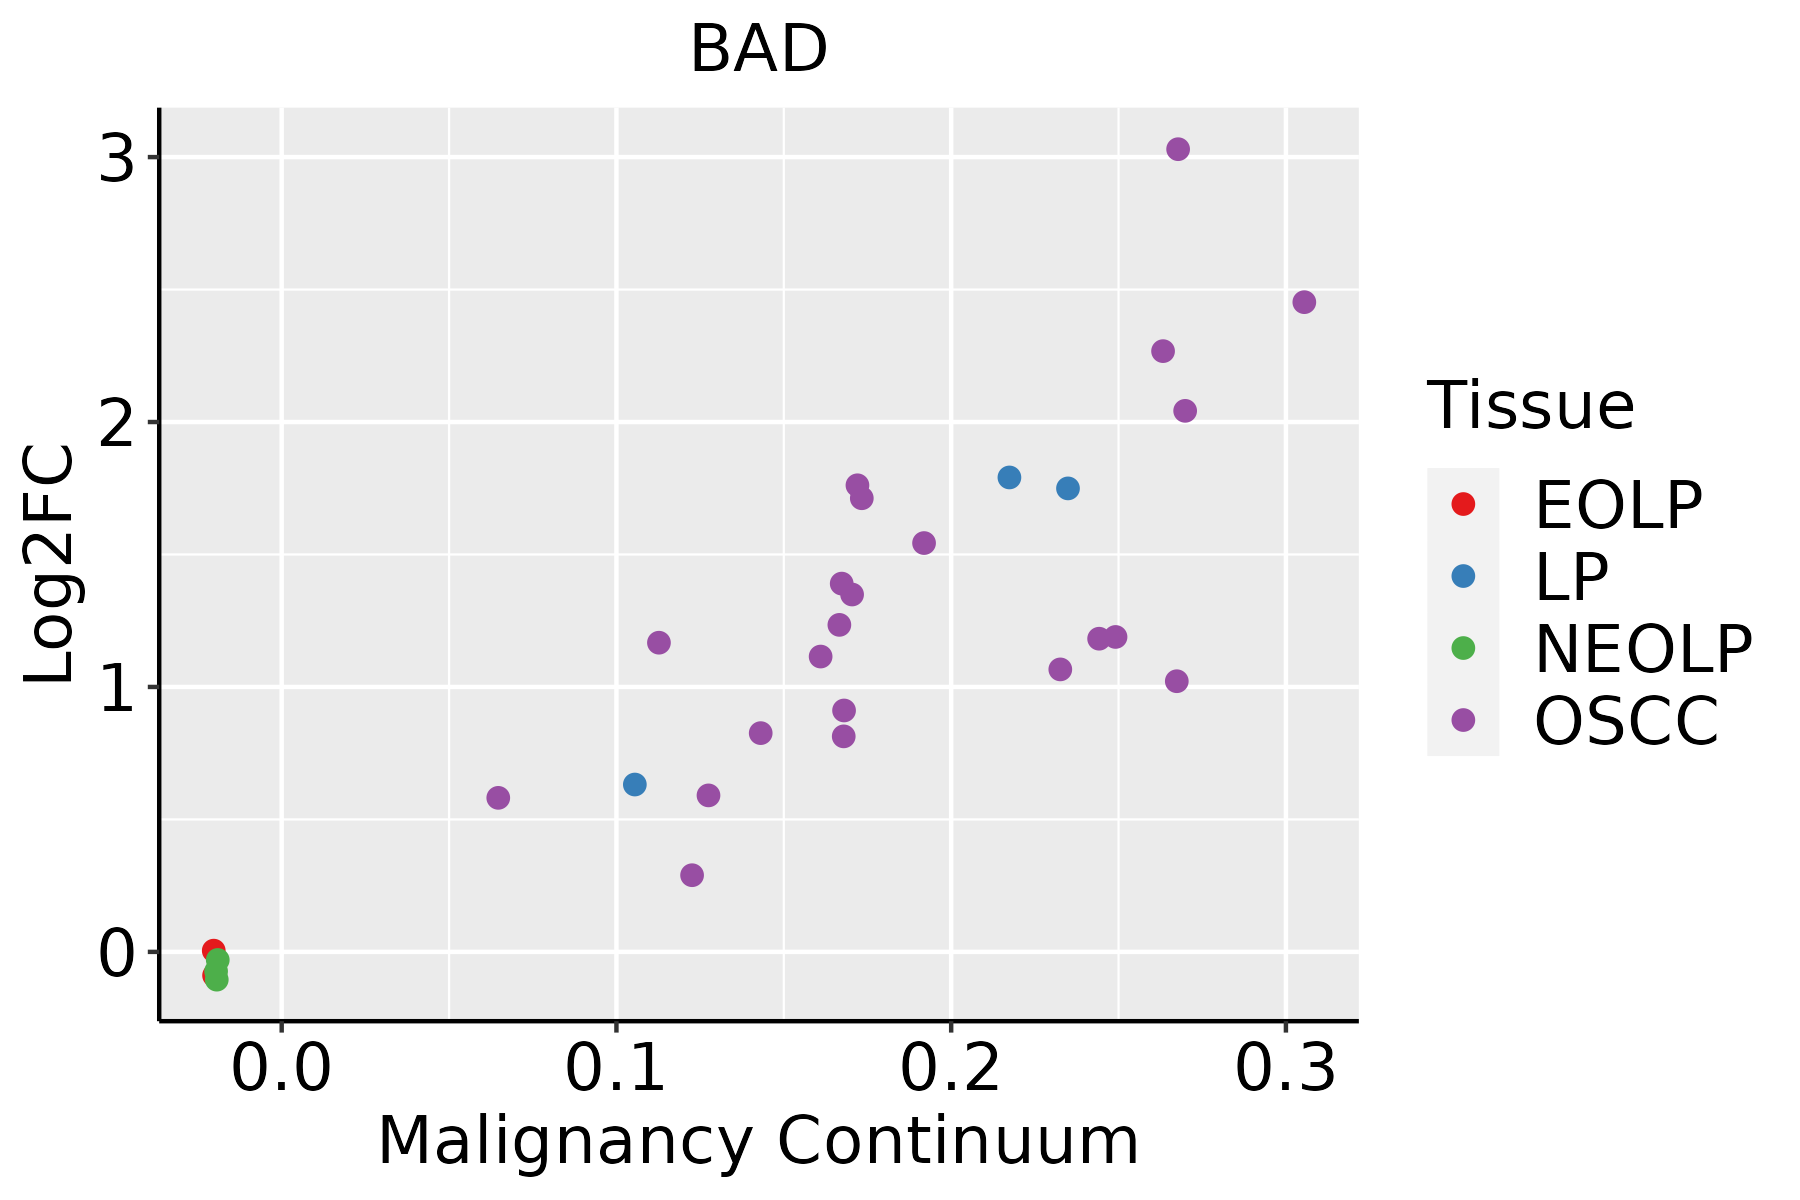 | EOLP: Erosive Oral lichen planus |
| LP: leukoplakia |
| NEOLP: Non-erosive oral lichen planus |
| OSCC: Oral squamous cell carcinoma |
| Prostate | 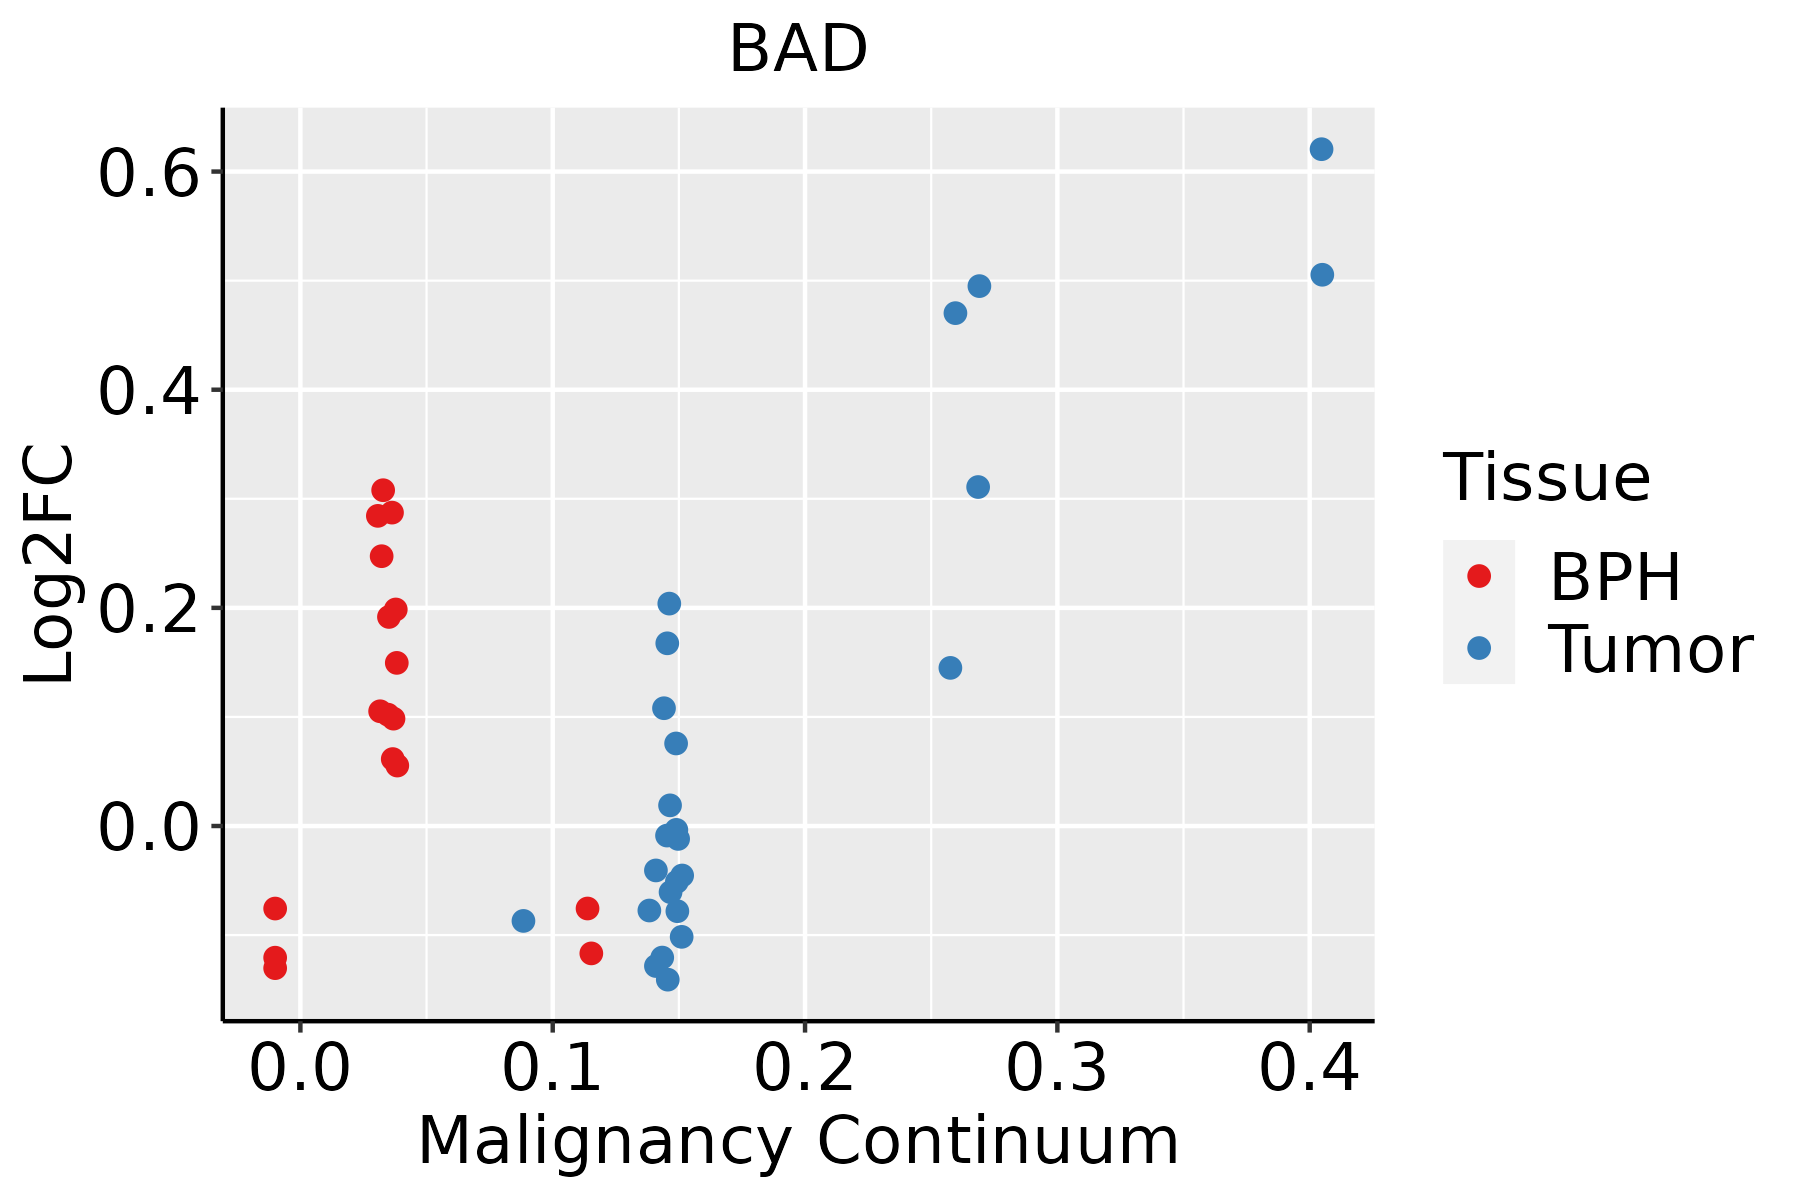 | BPH: Benign Prostatic Hyperplasia |
| Skin |  | AK: Actinic keratosis |
| cSCC: Cutaneous squamous cell carcinoma |
| SCCIS:squamous cell carcinoma in situ |
| Thyroid | 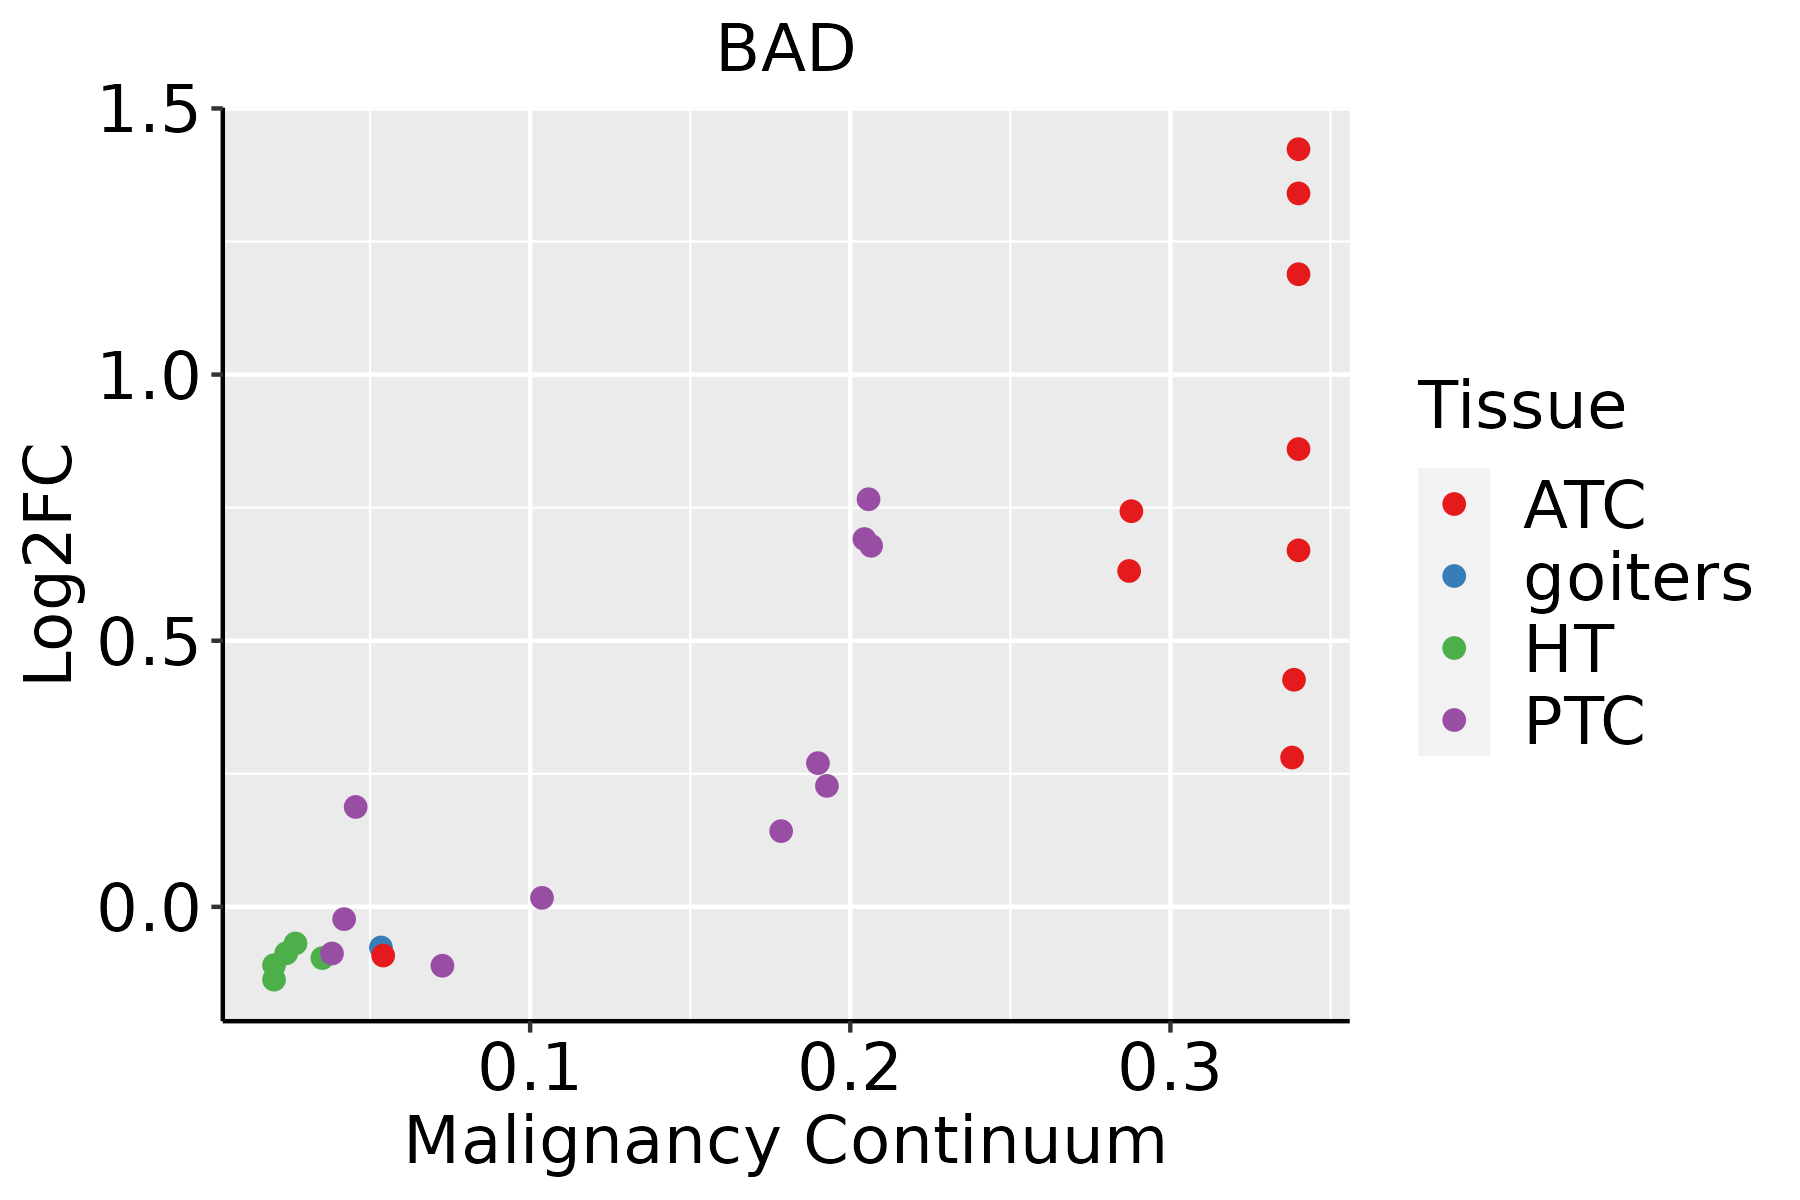 | ATC: Anaplastic thyroid cancer |
| HT: Hashimoto's thyroiditis |
| PTC: Papillary thyroid cancer |
| GO ID | Tissue | Disease Stage | Description | Gene Ratio | Bg Ratio | pvalue | p.adjust | Count |
| GO:000691913 | Prostate | Tumor | activation of cysteine-type endopeptidase activity involved in apoptotic process | 25/3246 | 78/18723 | 1.11e-03 | 7.12e-03 | 25 |
| GO:009055915 | Prostate | Tumor | regulation of membrane permeability | 25/3246 | 78/18723 | 1.11e-03 | 7.12e-03 | 25 |
| GO:000110114 | Prostate | Tumor | response to acid chemical | 38/3246 | 135/18723 | 1.19e-03 | 7.56e-03 | 38 |
| GO:001605214 | Prostate | Tumor | carbohydrate catabolic process | 42/3246 | 154/18723 | 1.35e-03 | 8.44e-03 | 42 |
| GO:005070814 | Prostate | Tumor | regulation of protein secretion | 66/3246 | 268/18723 | 1.49e-03 | 9.19e-03 | 66 |
| GO:000697013 | Prostate | Tumor | response to osmotic stress | 26/3246 | 84/18723 | 1.58e-03 | 9.63e-03 | 26 |
| GO:005071413 | Prostate | Tumor | positive regulation of protein secretion | 38/3246 | 137/18723 | 1.60e-03 | 9.71e-03 | 38 |
| GO:000974916 | Prostate | Tumor | response to glucose | 54/3246 | 212/18723 | 1.74e-03 | 1.03e-02 | 54 |
| GO:005086314 | Prostate | Tumor | regulation of T cell activation | 78/3246 | 329/18723 | 1.86e-03 | 1.09e-02 | 78 |
| GO:003009811 | Prostate | Tumor | lymphocyte differentiation | 87/3246 | 374/18723 | 1.93e-03 | 1.12e-02 | 87 |
| GO:00193187 | Prostate | Tumor | hexose metabolic process | 59/3246 | 237/18723 | 1.96e-03 | 1.14e-02 | 59 |
| GO:003803411 | Prostate | Tumor | signal transduction in absence of ligand | 21/3246 | 65/18723 | 2.40e-03 | 1.35e-02 | 21 |
| GO:009719211 | Prostate | Tumor | extrinsic apoptotic signaling pathway in absence of ligand | 21/3246 | 65/18723 | 2.40e-03 | 1.35e-02 | 21 |
| GO:003235515 | Prostate | Tumor | response to estradiol | 38/3246 | 141/18723 | 2.78e-03 | 1.52e-02 | 38 |
| GO:004561911 | Prostate | Tumor | regulation of lymphocyte differentiation | 45/3246 | 174/18723 | 2.93e-03 | 1.58e-02 | 45 |
| GO:001067511 | Prostate | Tumor | regulation of cellular carbohydrate metabolic process | 39/3246 | 146/18723 | 2.93e-03 | 1.58e-02 | 39 |
| GO:001090611 | Prostate | Tumor | regulation of glucose metabolic process | 33/3246 | 119/18723 | 3.13e-03 | 1.65e-02 | 33 |
| GO:00059967 | Prostate | Tumor | monosaccharide metabolic process | 62/3246 | 257/18723 | 3.38e-03 | 1.75e-02 | 62 |
| GO:190353211 | Prostate | Tumor | positive regulation of secretion by cell | 67/3246 | 282/18723 | 3.53e-03 | 1.82e-02 | 67 |
| GO:190210712 | Prostate | Tumor | positive regulation of leukocyte differentiation | 41/3246 | 157/18723 | 3.63e-03 | 1.86e-02 | 41 |
| Pathway ID | Tissue | Disease Stage | Description | Gene Ratio | Bg Ratio | pvalue | p.adjust | qvalue | Count |
| hsa0502020 | Endometrium | AEH | Prion disease | 110/1197 | 273/8465 | 2.39e-27 | 2.44e-25 | 1.78e-25 | 110 |
| hsa0520826 | Endometrium | AEH | Chemical carcinogenesis - reactive oxygen species | 91/1197 | 223/8465 | 3.28e-23 | 1.33e-21 | 9.76e-22 | 91 |
| hsa0501420 | Endometrium | AEH | Amyotrophic lateral sclerosis | 123/1197 | 364/8465 | 2.17e-22 | 7.82e-21 | 5.72e-21 | 123 |
| hsa0501020 | Endometrium | AEH | Alzheimer disease | 124/1197 | 384/8465 | 1.20e-20 | 3.91e-19 | 2.86e-19 | 124 |
| hsa0502220 | Endometrium | AEH | Pathways of neurodegeneration - multiple diseases | 137/1197 | 476/8465 | 9.27e-18 | 2.32e-16 | 1.70e-16 | 137 |
| hsa0451015 | Endometrium | AEH | Focal adhesion | 58/1197 | 203/8465 | 4.99e-08 | 7.37e-07 | 5.39e-07 | 58 |
| hsa0472216 | Endometrium | AEH | Neurotrophin signaling pathway | 31/1197 | 119/8465 | 4.07e-04 | 3.07e-03 | 2.25e-03 | 31 |
| hsa0491920 | Endometrium | AEH | Thyroid hormone signaling pathway | 30/1197 | 121/8465 | 1.20e-03 | 7.52e-03 | 5.50e-03 | 30 |
| hsa0541726 | Endometrium | AEH | Lipid and atherosclerosis | 47/1197 | 215/8465 | 1.24e-03 | 7.62e-03 | 5.58e-03 | 47 |
| hsa052158 | Endometrium | AEH | Prostate cancer | 25/1197 | 97/8465 | 1.68e-03 | 1.01e-02 | 7.39e-03 | 25 |
| hsa0421010 | Endometrium | AEH | Apoptosis | 30/1197 | 136/8465 | 7.72e-03 | 4.05e-02 | 2.96e-02 | 30 |
| hsa0517018 | Endometrium | AEH | Human immunodeficiency virus 1 infection | 43/1197 | 212/8465 | 8.19e-03 | 4.22e-02 | 3.09e-02 | 43 |
| hsa05020110 | Endometrium | AEH | Prion disease | 110/1197 | 273/8465 | 2.39e-27 | 2.44e-25 | 1.78e-25 | 110 |
| hsa05208112 | Endometrium | AEH | Chemical carcinogenesis - reactive oxygen species | 91/1197 | 223/8465 | 3.28e-23 | 1.33e-21 | 9.76e-22 | 91 |
| hsa05014110 | Endometrium | AEH | Amyotrophic lateral sclerosis | 123/1197 | 364/8465 | 2.17e-22 | 7.82e-21 | 5.72e-21 | 123 |
| hsa05010110 | Endometrium | AEH | Alzheimer disease | 124/1197 | 384/8465 | 1.20e-20 | 3.91e-19 | 2.86e-19 | 124 |
| hsa05022110 | Endometrium | AEH | Pathways of neurodegeneration - multiple diseases | 137/1197 | 476/8465 | 9.27e-18 | 2.32e-16 | 1.70e-16 | 137 |
| hsa0451016 | Endometrium | AEH | Focal adhesion | 58/1197 | 203/8465 | 4.99e-08 | 7.37e-07 | 5.39e-07 | 58 |
| hsa0472217 | Endometrium | AEH | Neurotrophin signaling pathway | 31/1197 | 119/8465 | 4.07e-04 | 3.07e-03 | 2.25e-03 | 31 |
| hsa04919110 | Endometrium | AEH | Thyroid hormone signaling pathway | 30/1197 | 121/8465 | 1.20e-03 | 7.52e-03 | 5.50e-03 | 30 |
| TF | Cell Type | Tissue | Disease Stage | Target Gene | RSS | Regulon Activity |
| BAD | MYOFIB | Esophagus | ADJ | FIBCD1,SLC22A23,S100A3, etc. | 0.00e+00 |  |
| BAD | INCAF | Esophagus | ADJ | FIBCD1,SLC22A23,S100A3, etc. | 0.00e+00 | |
| BAD | SMC | Esophagus | ESCC | FIBCD1,SLC22A23,S100A3, etc. | 5.49e-03 |  |
| BAD | FIB | Esophagus | ESCC | FIBCD1,SLC22A23,S100A3, etc. | 0.00e+00 | |
| Hugo Symbol | Variant Class | Variant Classification | dbSNP RS | HGVSc | HGVSp | HGVSp Short | SWISSPROT | BIOTYPE | SIFT | PolyPhen | Tumor Sample Barcode | Tissue | Histology | Sex | Age | Stage | Therapy Types | Drugs | Outcome |
| BAD | SNV | Missense_Mutation | | c.351G>A | p.Met117Ile | p.M117I | Q92934 | protein_coding | deleterious(0) | probably_damaging(0.966) | TCGA-AC-A23H-01 | Breast | breast invasive carcinoma | Female | >=65 | I/II | Unknown | Unknown | PD |
| BAD | SNV | Missense_Mutation | | c.293N>A | p.Arg98His | p.R98H | Q92934 | protein_coding | deleterious(0.03) | possibly_damaging(0.688) | TCGA-EK-A2RK-01 | Cervix | cervical & endocervical cancer | Female | >=65 | I/II | Unknown | Unknown | SD |
| BAD | SNV | Missense_Mutation | | c.57G>C | p.Glu19Asp | p.E19D | Q92934 | protein_coding | tolerated_low_confidence(1) | benign(0.001) | TCGA-4N-A93T-01 | Colorectum | colon adenocarcinoma | Male | >=65 | III/IV | Chemotherapy | xeloda | SD |
| BAD | SNV | Missense_Mutation | rs775688969 | c.74N>A | p.Ser25Asn | p.S25N | Q92934 | protein_coding | tolerated(0.13) | benign(0.409) | TCGA-AA-A010-01 | Colorectum | colon adenocarcinoma | Female | <65 | I/II | Chemotherapy | folinic | CR |
| BAD | SNV | Missense_Mutation | novel | c.212G>T | p.Ser71Ile | p.S71I | Q92934 | protein_coding | deleterious(0.01) | possibly_damaging(0.857) | TCGA-AJ-A5DW-01 | Endometrium | uterine corpus endometrioid carcinoma | Female | <65 | I/II | Unknown | Unknown | SD |
| BAD | SNV | Missense_Mutation | novel | c.401N>T | p.Ser134Ile | p.S134I | Q92934 | protein_coding | deleterious(0) | probably_damaging(0.998) | TCGA-AX-A1CE-01 | Endometrium | uterine corpus endometrioid carcinoma | Female | <65 | I/II | Unspecific | Paclitaxel | SD |
| BAD | SNV | Missense_Mutation | novel | c.485N>A | p.Gly162Glu | p.G162E | Q92934 | protein_coding | deleterious_low_confidence(0) | probably_damaging(1) | TCGA-AX-A2HC-01 | Endometrium | uterine corpus endometrioid carcinoma | Female | <65 | III/IV | Chemotherapy | paclitaxel | PD |
| BAD | SNV | Missense_Mutation | | c.298N>A | p.Ala100Thr | p.A100T | Q92934 | protein_coding | deleterious(0) | probably_damaging(0.999) | TCGA-D1-A17R-01 | Endometrium | uterine corpus endometrioid carcinoma | Female | <65 | I/II | Unknown | Unknown | SD |
| BAD | SNV | Missense_Mutation | | c.128G>A | p.Gly43Asp | p.G43D | Q92934 | protein_coding | tolerated(0.08) | probably_damaging(1) | TCGA-FI-A2D5-01 | Endometrium | uterine corpus endometrioid carcinoma | Female | <65 | III/IV | Chemotherapy | carboplatinum | PD |
| BAD | SNV | Missense_Mutation | | c.483N>T | p.Arg161Ser | p.R161S | Q92934 | protein_coding | deleterious_low_confidence(0) | benign(0.272) | TCGA-CH-5739-01 | Prostate | prostate adenocarcinoma | Male | >=65 | 7 | Unknown | Unknown | SD |


