| Tissue | Expression Dynamics | Abbreviation |
| Cervix | 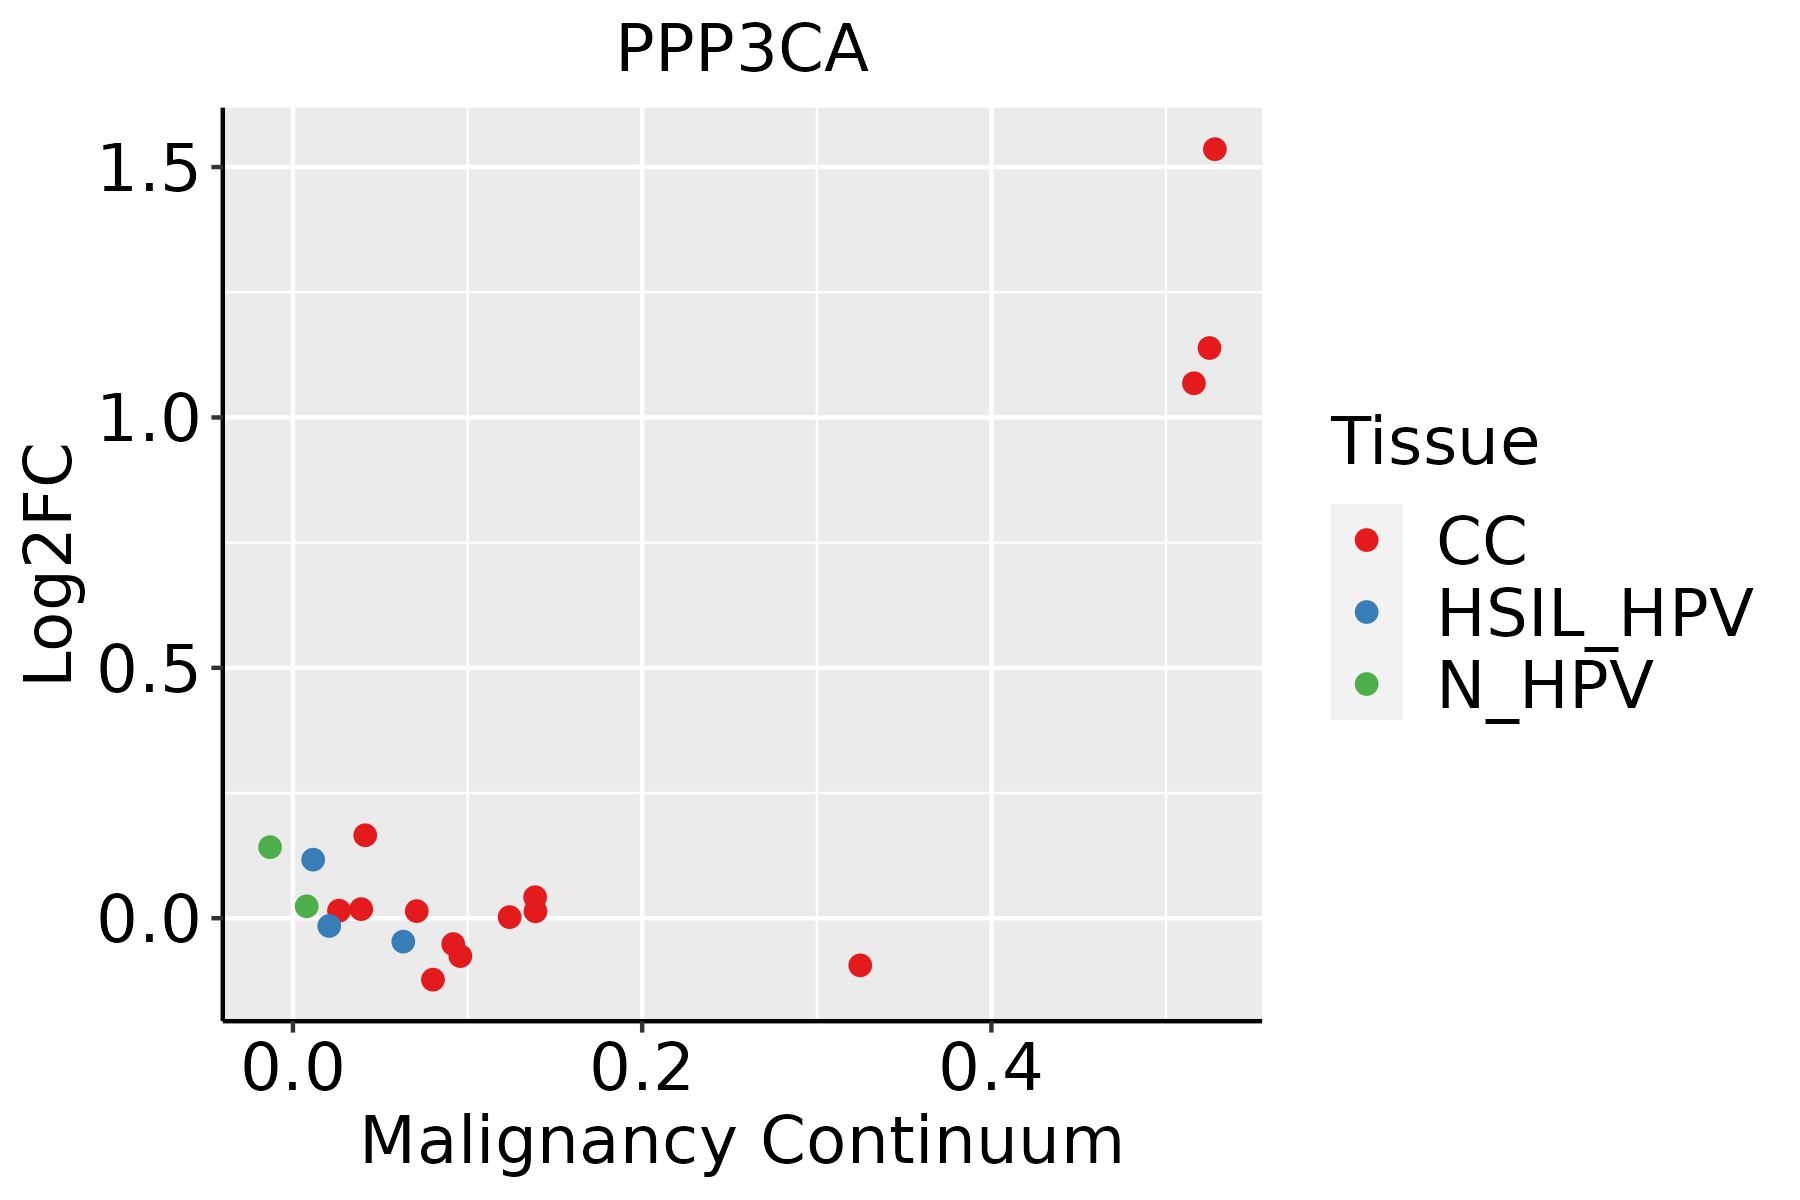 | CC: Cervix cancer |
| HSIL_HPV: HPV-infected high-grade squamous intraepithelial lesions |
| N_HPV: HPV-infected normal cervix |
| Colorectum (GSE201348) |  | FAP: Familial adenomatous polyposis |
| CRC: Colorectal cancer |
| Colorectum (HTA11) |  | AD: Adenomas |
| SER: Sessile serrated lesions |
| MSI-H: Microsatellite-high colorectal cancer |
| MSS: Microsatellite stable colorectal cancer |
| Esophagus |  | ESCC: Esophageal squamous cell carcinoma |
| HGIN: High-grade intraepithelial neoplasias |
| LGIN: Low-grade intraepithelial neoplasias |
| Lung |  | AAH: Atypical adenomatous hyperplasia |
| AIS: Adenocarcinoma in situ |
| IAC: Invasive lung adenocarcinoma |
| MIA: Minimally invasive adenocarcinoma |
| Oral Cavity |  | EOLP: Erosive Oral lichen planus |
| LP: leukoplakia |
| NEOLP: Non-erosive oral lichen planus |
| OSCC: Oral squamous cell carcinoma |
| Prostate | 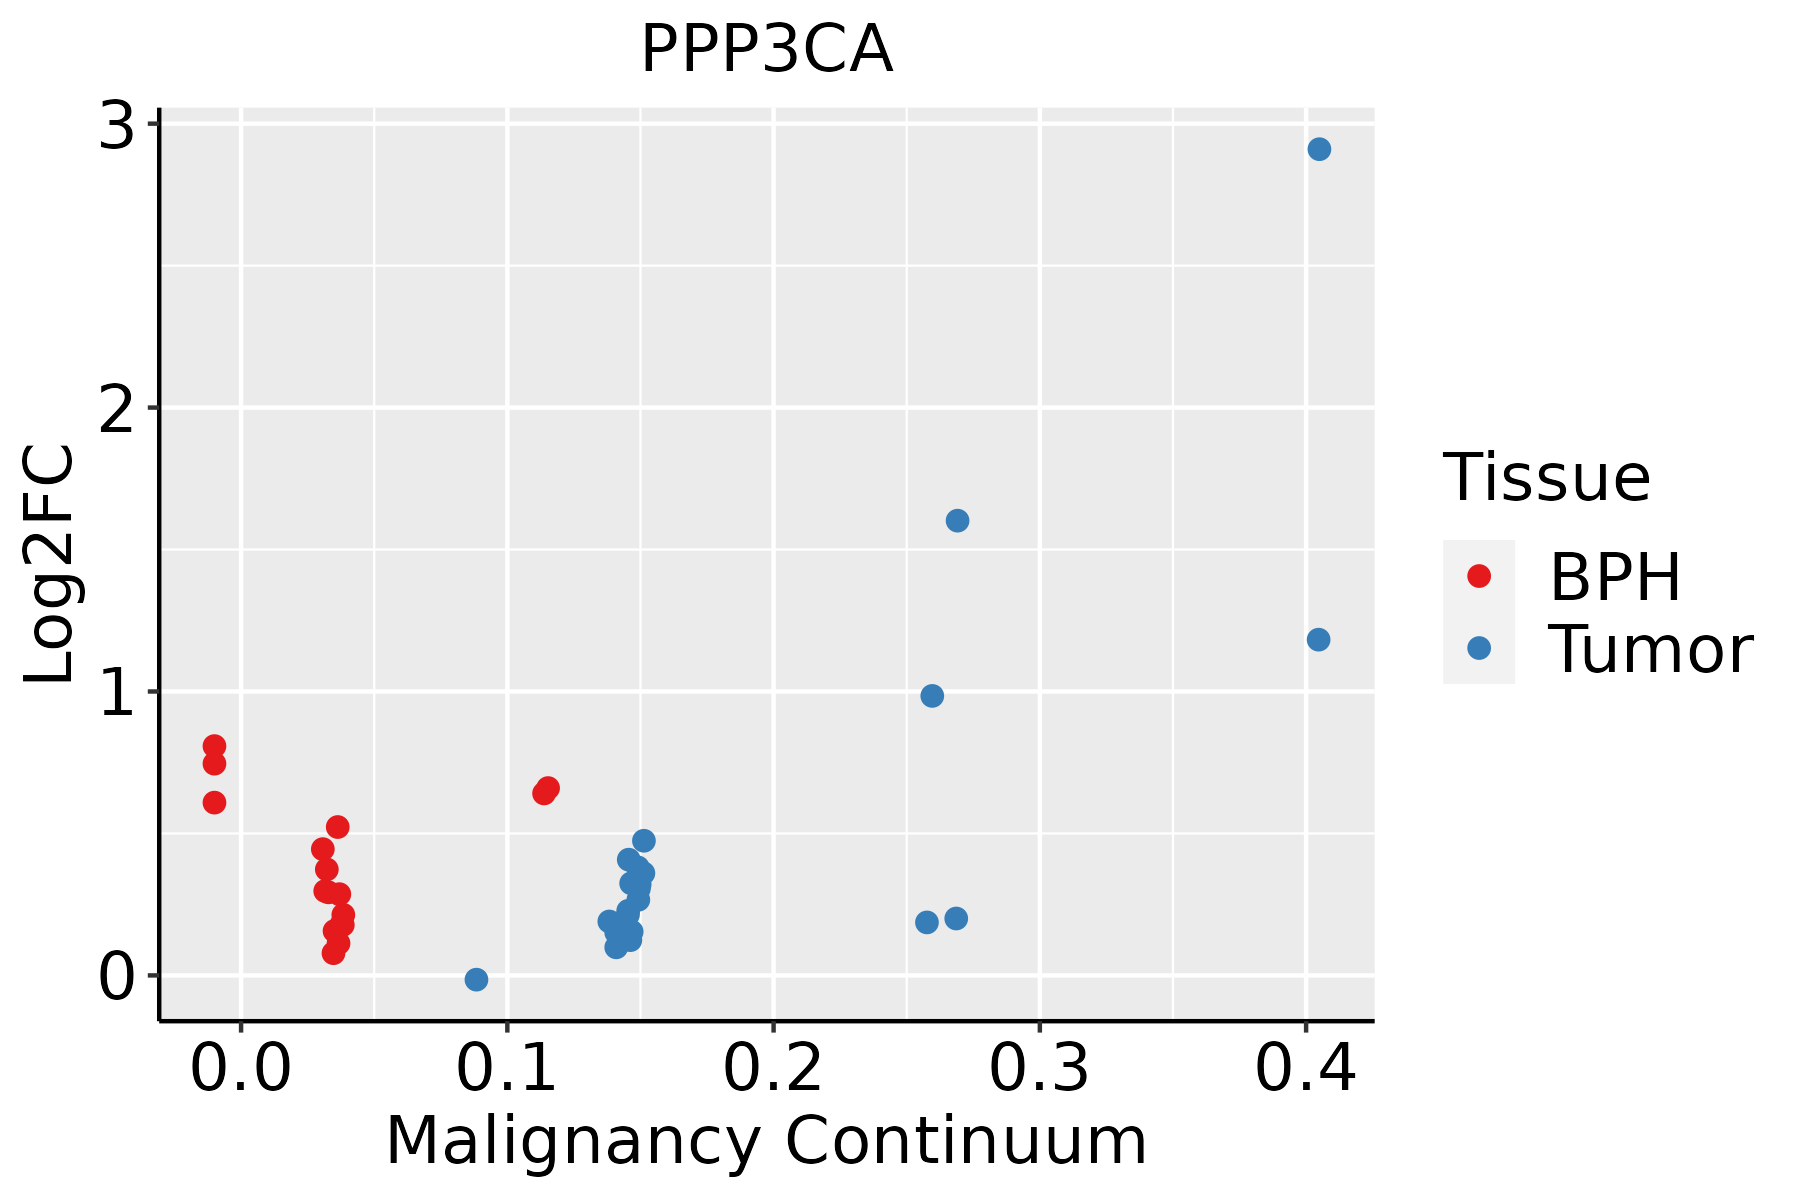 | BPH: Benign Prostatic Hyperplasia |
| Skin | 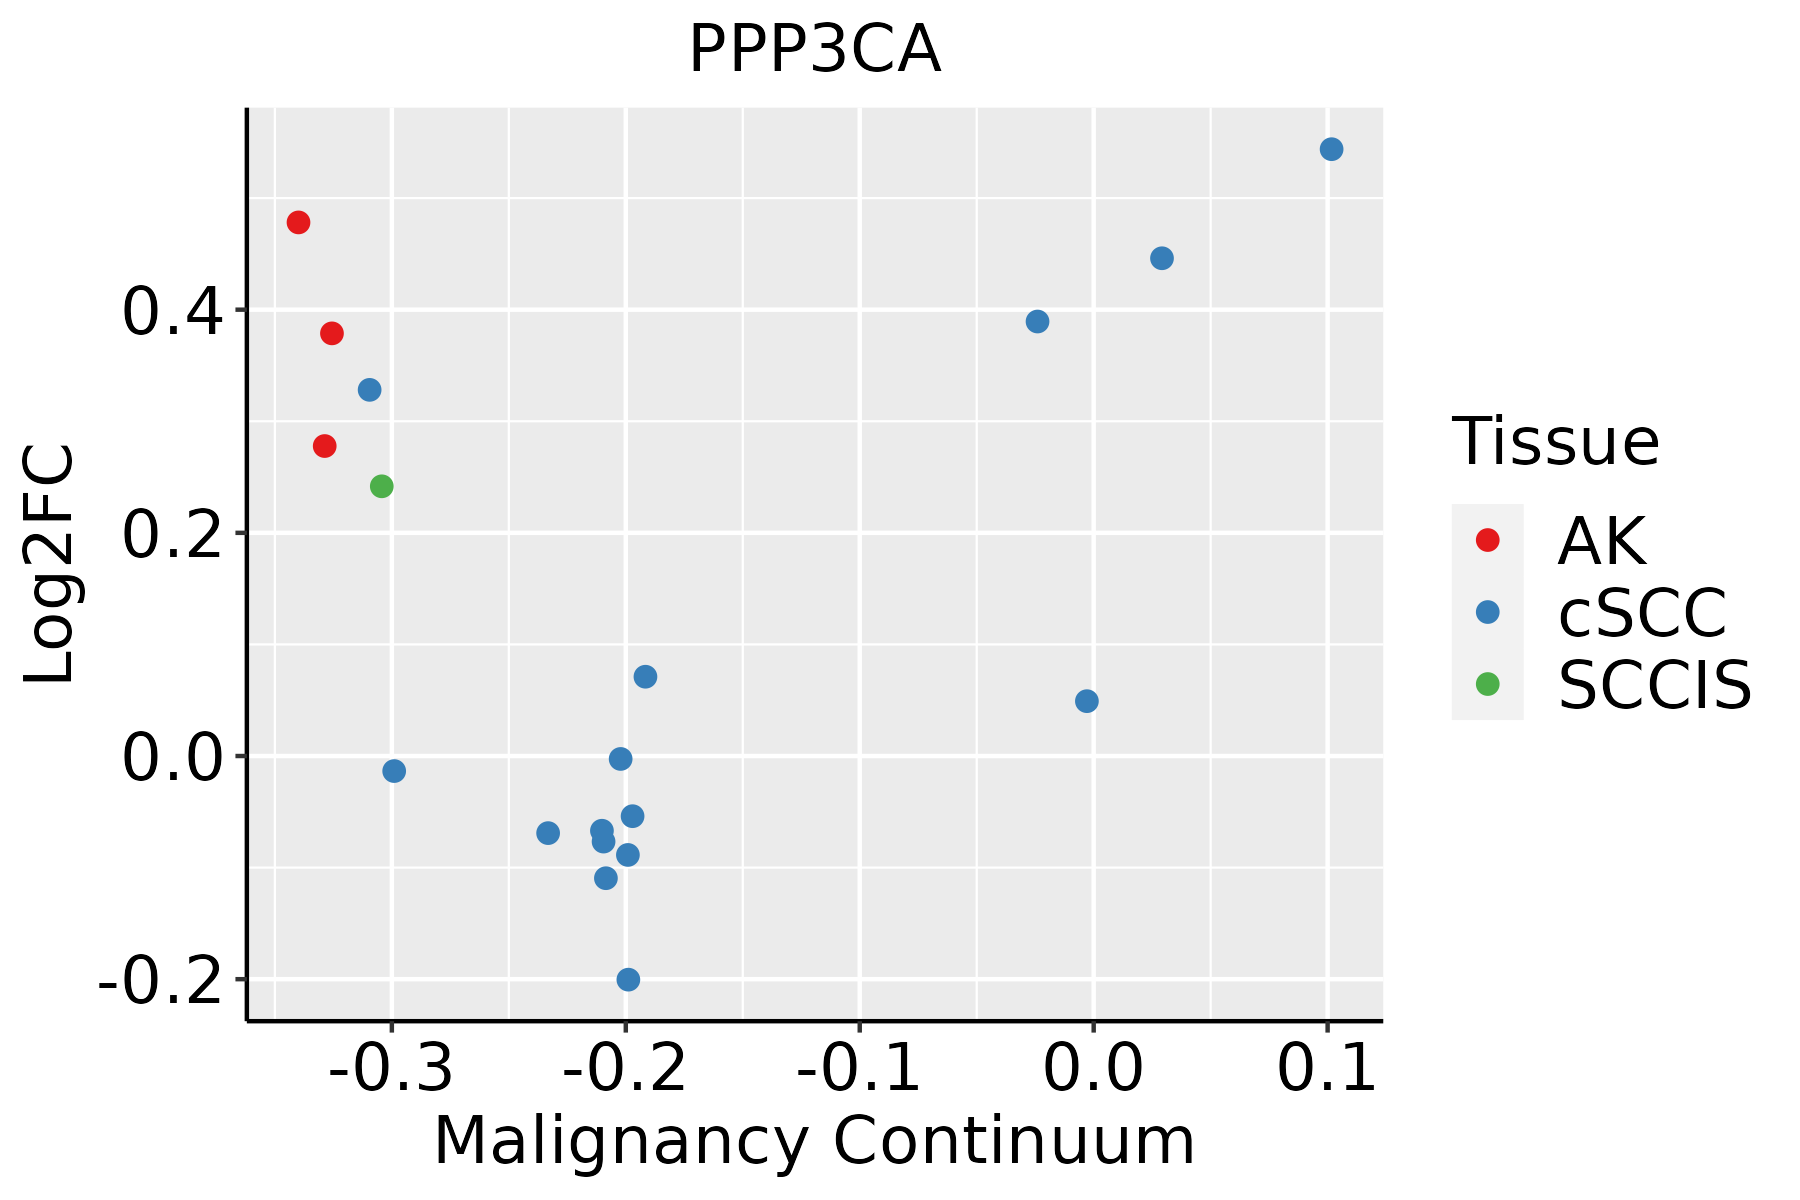 | AK: Actinic keratosis |
| cSCC: Cutaneous squamous cell carcinoma |
| SCCIS:squamous cell carcinoma in situ |
| Thyroid | 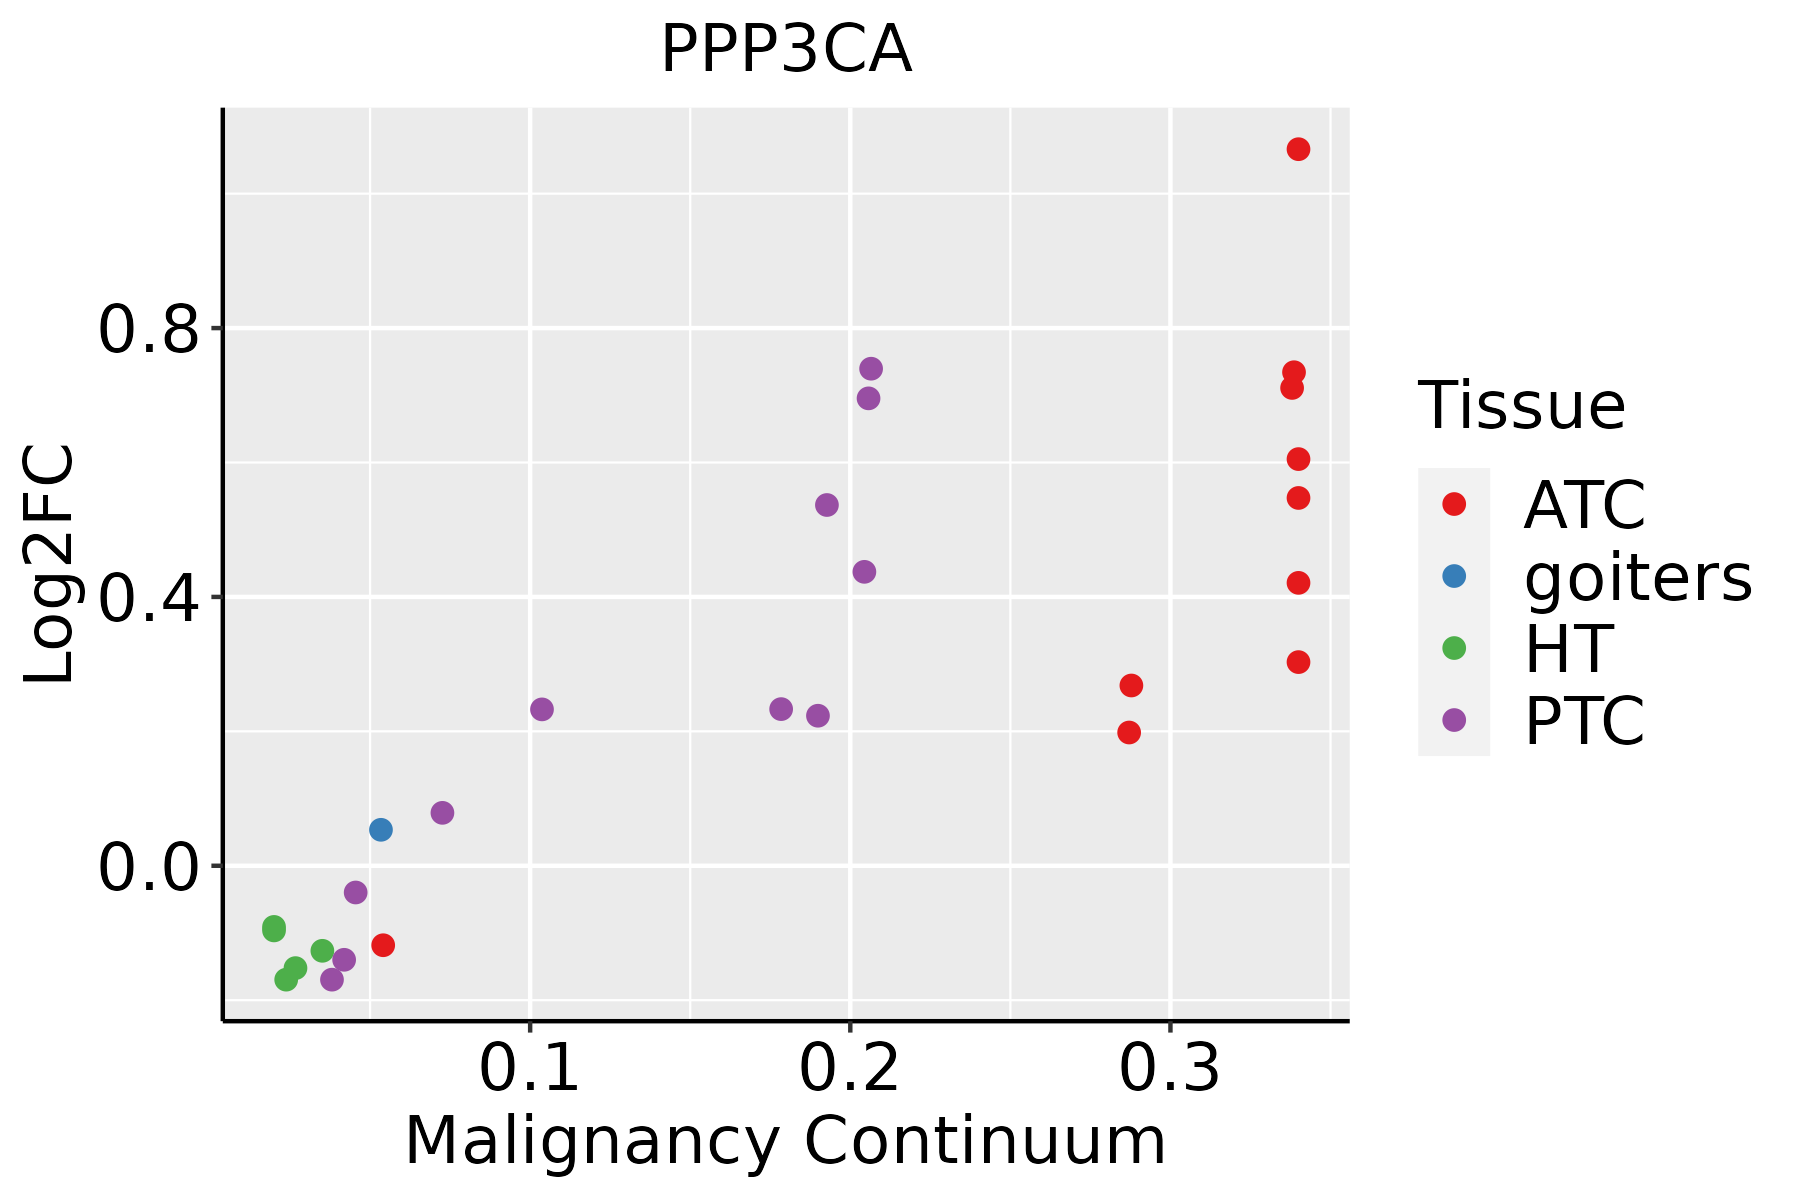 | ATC: Anaplastic thyroid cancer |
| HT: Hashimoto's thyroiditis |
| PTC: Papillary thyroid cancer |
| GO ID | Tissue | Disease Stage | Description | Gene Ratio | Bg Ratio | pvalue | p.adjust | Count |
| GO:001703822 | Thyroid | ATC | protein import | 110/6293 | 206/18723 | 3.49e-09 | 8.09e-08 | 110 |
| GO:0045807111 | Thyroid | ATC | positive regulation of endocytosis | 61/6293 | 100/18723 | 1.80e-08 | 3.59e-07 | 61 |
| GO:005117018 | Thyroid | ATC | import into nucleus | 86/6293 | 159/18723 | 8.02e-08 | 1.40e-06 | 86 |
| GO:000660617 | Thyroid | ATC | protein import into nucleus | 83/6293 | 155/18723 | 2.38e-07 | 3.70e-06 | 83 |
| GO:005110027 | Thyroid | ATC | negative regulation of binding | 86/6293 | 162/18723 | 2.41e-07 | 3.73e-06 | 86 |
| GO:004484316 | Thyroid | ATC | cell cycle G1/S phase transition | 119/6293 | 241/18723 | 2.68e-07 | 4.10e-06 | 119 |
| GO:005076723 | Thyroid | ATC | regulation of neurogenesis | 168/6293 | 364/18723 | 3.73e-07 | 5.48e-06 | 168 |
| GO:0016358110 | Thyroid | ATC | dendrite development | 119/6293 | 243/18723 | 4.65e-07 | 6.75e-06 | 119 |
| GO:000008216 | Thyroid | ATC | G1/S transition of mitotic cell cycle | 107/6293 | 214/18723 | 4.83e-07 | 6.99e-06 | 107 |
| GO:006053724 | Thyroid | ATC | muscle tissue development | 181/6293 | 403/18723 | 1.27e-06 | 1.62e-05 | 181 |
| GO:0045785210 | Thyroid | ATC | positive regulation of cell adhesion | 194/6293 | 437/18723 | 1.40e-06 | 1.75e-05 | 194 |
| GO:005196014 | Thyroid | ATC | regulation of nervous system development | 195/6293 | 443/18723 | 2.62e-06 | 3.06e-05 | 195 |
| GO:0010038210 | Thyroid | ATC | response to metal ion | 165/6293 | 373/18723 | 1.07e-05 | 1.05e-04 | 165 |
| GO:0006470111 | Thyroid | ATC | protein dephosphorylation | 129/6293 | 281/18723 | 1.11e-05 | 1.09e-04 | 129 |
| GO:005109022 | Thyroid | ATC | regulation of DNA-binding transcription factor activity | 190/6293 | 440/18723 | 1.49e-05 | 1.39e-04 | 190 |
| GO:001470622 | Thyroid | ATC | striated muscle tissue development | 168/6293 | 384/18723 | 1.91e-05 | 1.73e-04 | 168 |
| GO:001631117 | Thyroid | ATC | dephosphorylation | 179/6293 | 417/18723 | 3.88e-05 | 3.15e-04 | 179 |
| GO:004269216 | Thyroid | ATC | muscle cell differentiation | 165/6293 | 384/18723 | 7.17e-05 | 5.46e-04 | 165 |
| GO:000974333 | Thyroid | ATC | response to carbohydrate | 114/6293 | 253/18723 | 9.26e-05 | 6.81e-04 | 114 |
| GO:006014717 | Thyroid | ATC | regulation of posttranscriptional gene silencing | 31/6293 | 52/18723 | 1.06e-04 | 7.61e-04 | 31 |
| Pathway ID | Tissue | Disease Stage | Description | Gene Ratio | Bg Ratio | pvalue | p.adjust | qvalue | Count |
| hsa0502018 | Cervix | CC | Prion disease | 98/1267 | 273/8465 | 2.64e-18 | 1.42e-16 | 8.42e-17 | 98 |
| hsa0501018 | Cervix | CC | Alzheimer disease | 113/1267 | 384/8465 | 9.67e-14 | 3.92e-12 | 2.32e-12 | 113 |
| hsa0502218 | Cervix | CC | Pathways of neurodegeneration - multiple diseases | 128/1267 | 476/8465 | 2.87e-12 | 9.29e-11 | 5.50e-11 | 128 |
| hsa0501418 | Cervix | CC | Amyotrophic lateral sclerosis | 103/1267 | 364/8465 | 1.79e-11 | 4.47e-10 | 2.64e-10 | 103 |
| hsa0541720 | Cervix | CC | Lipid and atherosclerosis | 65/1267 | 215/8465 | 6.47e-09 | 1.10e-07 | 6.52e-08 | 65 |
| hsa0516720 | Cervix | CC | Kaposi sarcoma-associated herpesvirus infection | 60/1267 | 194/8465 | 9.74e-09 | 1.58e-07 | 9.33e-08 | 60 |
| hsa0516318 | Cervix | CC | Human cytomegalovirus infection | 65/1267 | 225/8465 | 4.59e-08 | 6.47e-07 | 3.83e-07 | 65 |
| hsa0421810 | Cervix | CC | Cellular senescence | 49/1267 | 156/8465 | 1.30e-07 | 1.63e-06 | 9.61e-07 | 49 |
| hsa0516620 | Cervix | CC | Human T-cell leukemia virus 1 infection | 61/1267 | 222/8465 | 8.13e-07 | 7.98e-06 | 4.72e-06 | 61 |
| hsa0517016 | Cervix | CC | Human immunodeficiency virus 1 infection | 55/1267 | 212/8465 | 1.80e-05 | 1.42e-04 | 8.40e-05 | 55 |
| hsa043609 | Cervix | CC | Axon guidance | 47/1267 | 182/8465 | 8.13e-05 | 5.38e-04 | 3.18e-04 | 47 |
| hsa043109 | Cervix | CC | Wnt signaling pathway | 43/1267 | 171/8465 | 3.03e-04 | 1.64e-03 | 9.68e-04 | 43 |
| hsa05152 | Cervix | CC | Tuberculosis | 42/1267 | 180/8465 | 1.78e-03 | 7.21e-03 | 4.26e-03 | 42 |
| hsa046596 | Cervix | CC | Th17 cell differentiation | 28/1267 | 108/8465 | 1.99e-03 | 7.98e-03 | 4.72e-03 | 28 |
| hsa04658 | Cervix | CC | Th1 and Th2 cell differentiation | 24/1267 | 92/8465 | 3.71e-03 | 1.34e-02 | 7.91e-03 | 24 |
| hsa040109 | Cervix | CC | MAPK signaling pathway | 62/1267 | 302/8465 | 4.89e-03 | 1.67e-02 | 9.86e-03 | 62 |
| hsa046254 | Cervix | CC | C-type lectin receptor signaling pathway | 25/1267 | 104/8465 | 9.52e-03 | 2.94e-02 | 1.74e-02 | 25 |
| hsa046604 | Cervix | CC | T cell receptor signaling pathway | 25/1267 | 104/8465 | 9.52e-03 | 2.94e-02 | 1.74e-02 | 25 |
| hsa049218 | Cervix | CC | Oxytocin signaling pathway | 34/1267 | 154/8465 | 1.12e-02 | 3.42e-02 | 2.02e-02 | 34 |
| hsa0502019 | Cervix | CC | Prion disease | 98/1267 | 273/8465 | 2.64e-18 | 1.42e-16 | 8.42e-17 | 98 |
| Hugo Symbol | Variant Class | Variant Classification | dbSNP RS | HGVSc | HGVSp | HGVSp Short | SWISSPROT | BIOTYPE | SIFT | PolyPhen | Tumor Sample Barcode | Tissue | Histology | Sex | Age | Stage | Therapy Types | Drugs | Outcome |
| PPP3CA | SNV | Missense_Mutation | | c.1087G>C | p.Glu363Gln | p.E363Q | Q08209 | protein_coding | deleterious(0.02) | benign(0.383) | TCGA-A2-A0EQ-01 | Breast | breast invasive carcinoma | Female | <65 | I/II | Chemotherapy | adriamycin | SD |
| PPP3CA | SNV | Missense_Mutation | rs745416220 | c.1265N>T | p.Thr422Met | p.T422M | Q08209 | protein_coding | tolerated(0.26) | benign(0.075) | TCGA-AO-A128-01 | Breast | breast invasive carcinoma | Female | <65 | I/II | Chemotherapy | doxorubicin | SD |
| PPP3CA | SNV | Missense_Mutation | | c.1349N>G | p.Glu450Gly | p.E450G | Q08209 | protein_coding | deleterious(0.02) | benign(0.284) | TCGA-BH-A0BO-01 | Breast | breast invasive carcinoma | Female | <65 | I/II | Unknown | Unknown | SD |
| PPP3CA | SNV | Missense_Mutation | rs755119794 | c.101N>C | p.Val34Ala | p.V34A | Q08209 | protein_coding | deleterious(0.03) | possibly_damaging(0.497) | TCGA-BH-A1EU-01 | Breast | breast invasive carcinoma | Female | >=65 | I/II | Unknown | Unknown | SD |
| PPP3CA | SNV | Missense_Mutation | | c.846N>C | p.Glu282Asp | p.E282D | Q08209 | protein_coding | deleterious(0.01) | probably_damaging(0.958) | TCGA-EW-A1IZ-01 | Breast | breast invasive carcinoma | Female | <65 | III/IV | Chemotherapy | taxotere | SD |
| PPP3CA | insertion | Nonsense_Mutation | novel | c.837_838insAAAAGAGAGGACTCACAGTGTTTTTAAAATTATAAAT | p.Ala280LysfsTer9 | p.A280Kfs*9 | Q08209 | protein_coding | | | TCGA-A8-A06X-01 | Breast | breast invasive carcinoma | Female | >=65 | I/II | Unknown | Unknown | SD |
| PPP3CA | SNV | Missense_Mutation | novel | c.273T>G | p.Ile91Met | p.I91M | Q08209 | protein_coding | deleterious(0) | probably_damaging(0.988) | TCGA-2W-A8YY-01 | Cervix | cervical & endocervical cancer | Female | <65 | I/II | Chemotherapy | cisplatin | CR |
| PPP3CA | SNV | Missense_Mutation | novel | c.176N>A | p.Ser59Asn | p.S59N | Q08209 | protein_coding | deleterious(0.04) | benign(0.003) | TCGA-4J-AA1J-01 | Cervix | cervical & endocervical cancer | Female | <65 | I/II | Unknown | Unknown | SD |
| PPP3CA | SNV | Missense_Mutation | | c.844N>A | p.Glu282Lys | p.E282K | Q08209 | protein_coding | deleterious(0.02) | probably_damaging(0.981) | TCGA-FU-A3HZ-01 | Cervix | cervical & endocervical cancer | Female | <65 | I/II | Chemotherapy | cisplatin | CR |
| PPP3CA | SNV | Missense_Mutation | novel | c.442C>T | p.Arg148Cys | p.R148C | Q08209 | protein_coding | deleterious(0) | probably_damaging(0.999) | TCGA-AA-3510-01 | Colorectum | colon adenocarcinoma | Male | >=65 | I/II | Unknown | Unknown | SD |
| Entrez ID | Symbol | Category | Interaction Types | Drug Claim Name | Drug Name | PMIDs |
| 5530 | PPP3CA | DRUGGABLE GENOME, TRANSCRIPTION FACTOR, ENZYME | | Cyclosporine | CYCLOSPORINE | |
| 5530 | PPP3CA | DRUGGABLE GENOME, TRANSCRIPTION FACTOR, ENZYME | | Voclosporin | VOCLOSPORIN | |
| 5530 | PPP3CA | DRUGGABLE GENOME, TRANSCRIPTION FACTOR, ENZYME | | Tacrolimus | TACROLIMUS | |
| 5530 | PPP3CA | DRUGGABLE GENOME, TRANSCRIPTION FACTOR, ENZYME | | VOCLOSPORIN | VOCLOSPORIN | |
| 5530 | PPP3CA | DRUGGABLE GENOME, TRANSCRIPTION FACTOR, ENZYME | | Pimecrolimus | PIMECROLIMUS | |


