
|
|||||
|
 | |
| |
| |
| |
| |
| |
|
Gene: GSTP1 |
Gene summary for GSTP1 |
| Gene information | Species | Human | Gene symbol | GSTP1 | Gene ID | 2950 |
| Gene name | glutathione S-transferase pi 1 | |
| Gene Alias | DFN7 | |
| Cytomap | 11q13.2 | |
| Gene Type | protein-coding | GO ID | GO:0000165 | UniProtAcc | P09211 |
Top |
Malignant transformation analysis |
| Identification of the aberrant gene expression in precancerous and cancerous lesions by comparing the gene expression of stem-like cells in diseased tissues with normal stem cells |
| Entrez ID | Symbol | Replicates | Species | Organ | Tissue | Adj P-value | Log2FC | Malignancy |
| 2950 | GSTP1 | GSM4909281 | Human | Breast | IDC | 1.62e-32 | 5.06e-01 | 0.21 |
| 2950 | GSTP1 | GSM4909282 | Human | Breast | IDC | 2.65e-55 | 6.42e-01 | -0.0288 |
| 2950 | GSTP1 | GSM4909285 | Human | Breast | IDC | 1.89e-53 | 5.83e-01 | 0.21 |
| 2950 | GSTP1 | GSM4909287 | Human | Breast | IDC | 6.52e-30 | 4.24e-01 | 0.2057 |
| 2950 | GSTP1 | GSM4909288 | Human | Breast | IDC | 1.41e-09 | 3.93e-01 | 0.0988 |
| 2950 | GSTP1 | GSM4909290 | Human | Breast | IDC | 3.42e-03 | 2.44e-01 | 0.2096 |
| 2950 | GSTP1 | GSM4909291 | Human | Breast | IDC | 3.51e-39 | -1.09e+00 | 0.1753 |
| 2950 | GSTP1 | GSM4909292 | Human | Breast | IDC | 1.60e-02 | -6.92e-01 | 0.1236 |
| 2950 | GSTP1 | GSM4909293 | Human | Breast | IDC | 2.36e-08 | -3.83e-01 | 0.1581 |
| 2950 | GSTP1 | GSM4909294 | Human | Breast | IDC | 1.08e-50 | 5.18e-01 | 0.2022 |
| 2950 | GSTP1 | GSM4909295 | Human | Breast | IDC | 1.04e-08 | 3.58e-01 | 0.0898 |
| 2950 | GSTP1 | GSM4909296 | Human | Breast | IDC | 8.27e-17 | -8.99e-02 | 0.1524 |
| 2950 | GSTP1 | GSM4909297 | Human | Breast | IDC | 3.13e-68 | -1.03e+00 | 0.1517 |
| 2950 | GSTP1 | GSM4909298 | Human | Breast | IDC | 4.24e-56 | -9.79e-01 | 0.1551 |
| 2950 | GSTP1 | GSM4909301 | Human | Breast | IDC | 4.62e-68 | -1.08e+00 | 0.1577 |
| 2950 | GSTP1 | GSM4909302 | Human | Breast | IDC | 9.55e-25 | -7.40e-01 | 0.1545 |
| 2950 | GSTP1 | GSM4909304 | Human | Breast | IDC | 1.83e-77 | -1.13e+00 | 0.1636 |
| 2950 | GSTP1 | GSM4909306 | Human | Breast | IDC | 9.75e-17 | -5.54e-01 | 0.1564 |
| 2950 | GSTP1 | GSM4909307 | Human | Breast | IDC | 3.44e-41 | -7.81e-01 | 0.1569 |
| 2950 | GSTP1 | GSM4909308 | Human | Breast | IDC | 1.29e-60 | -1.12e+00 | 0.158 |
| Page: 1 2 3 4 5 6 7 8 9 10 11 12 13 14 15 16 17 |
| Tissue | Expression Dynamics | Abbreviation |
| Breast | 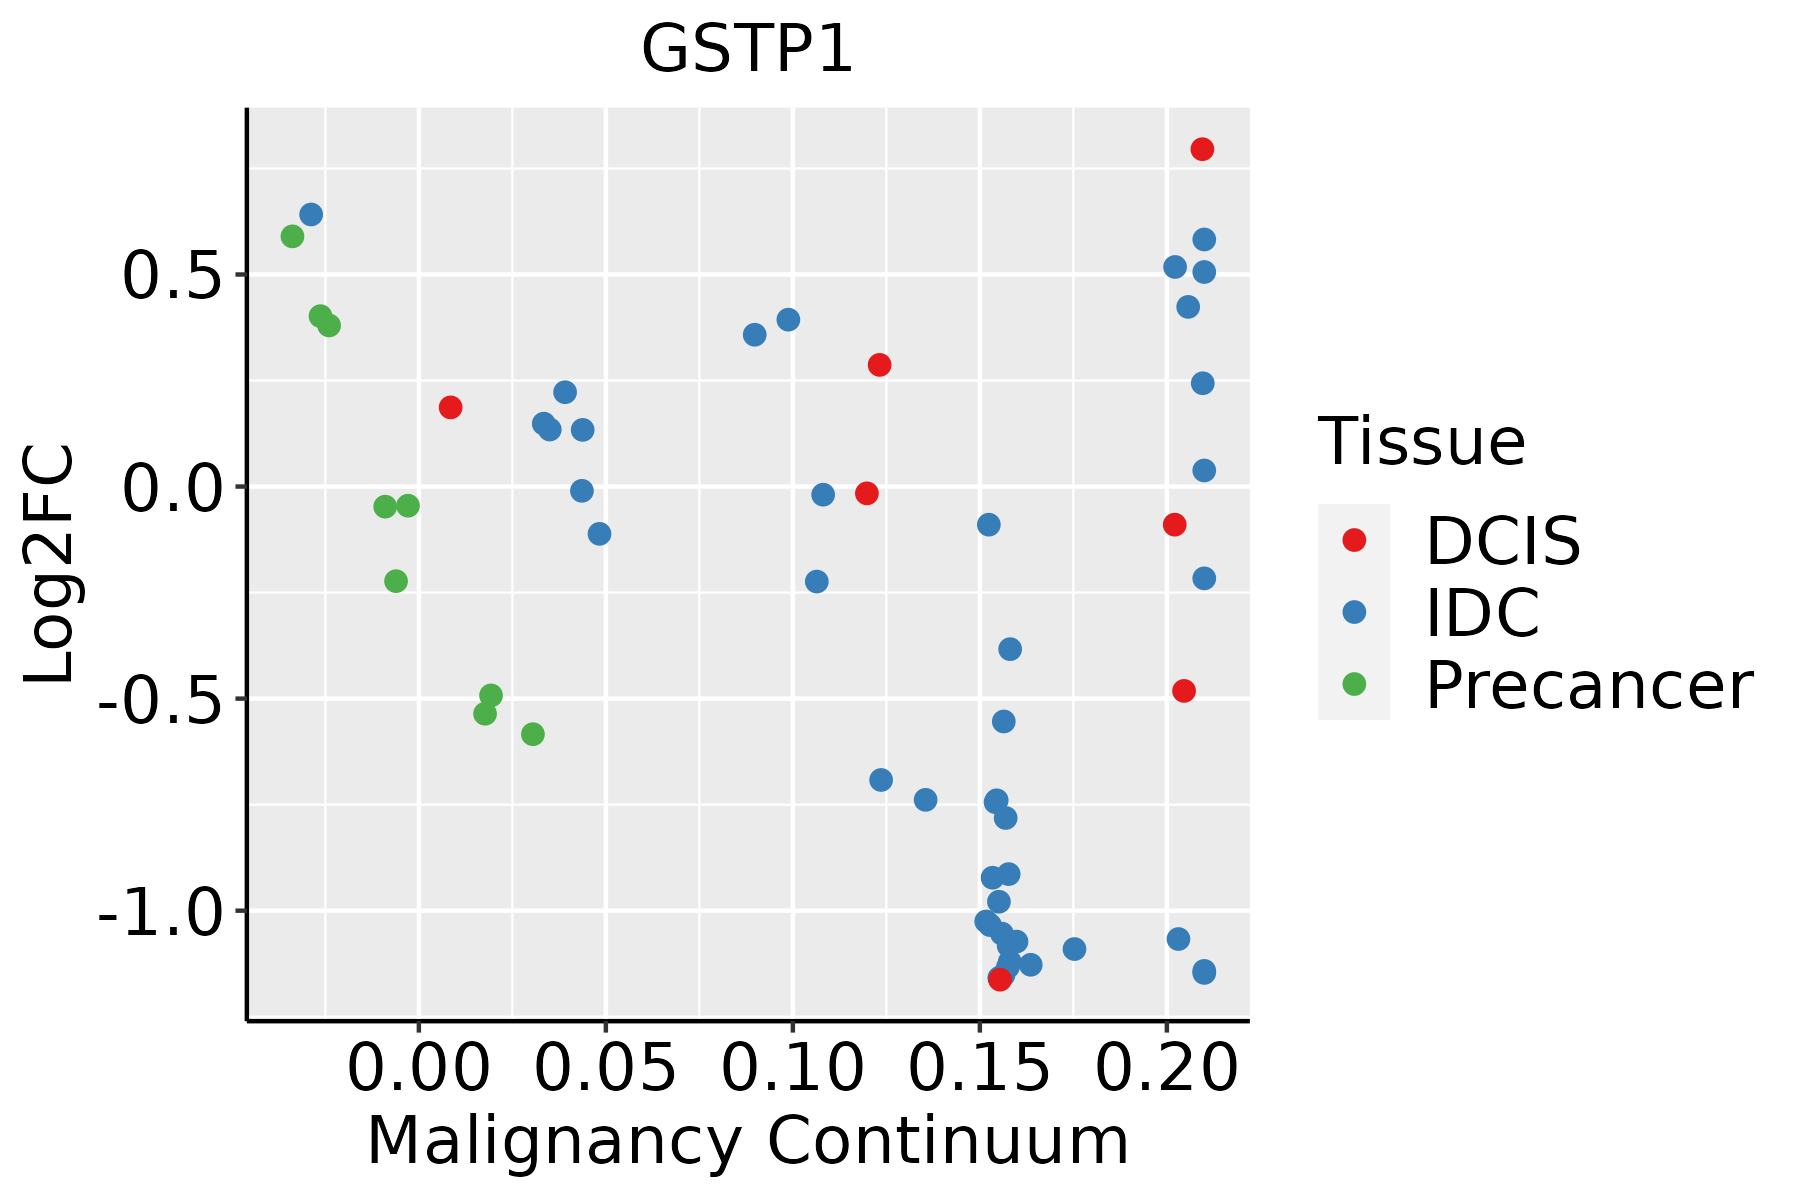 | IDC: Invasive ductal carcinoma |
| DCIS: Ductal carcinoma in situ | ||
| Precancer(BRCA1-mut): Precancerous lesion from BRCA1 mutation carriers | ||
| Cervix | 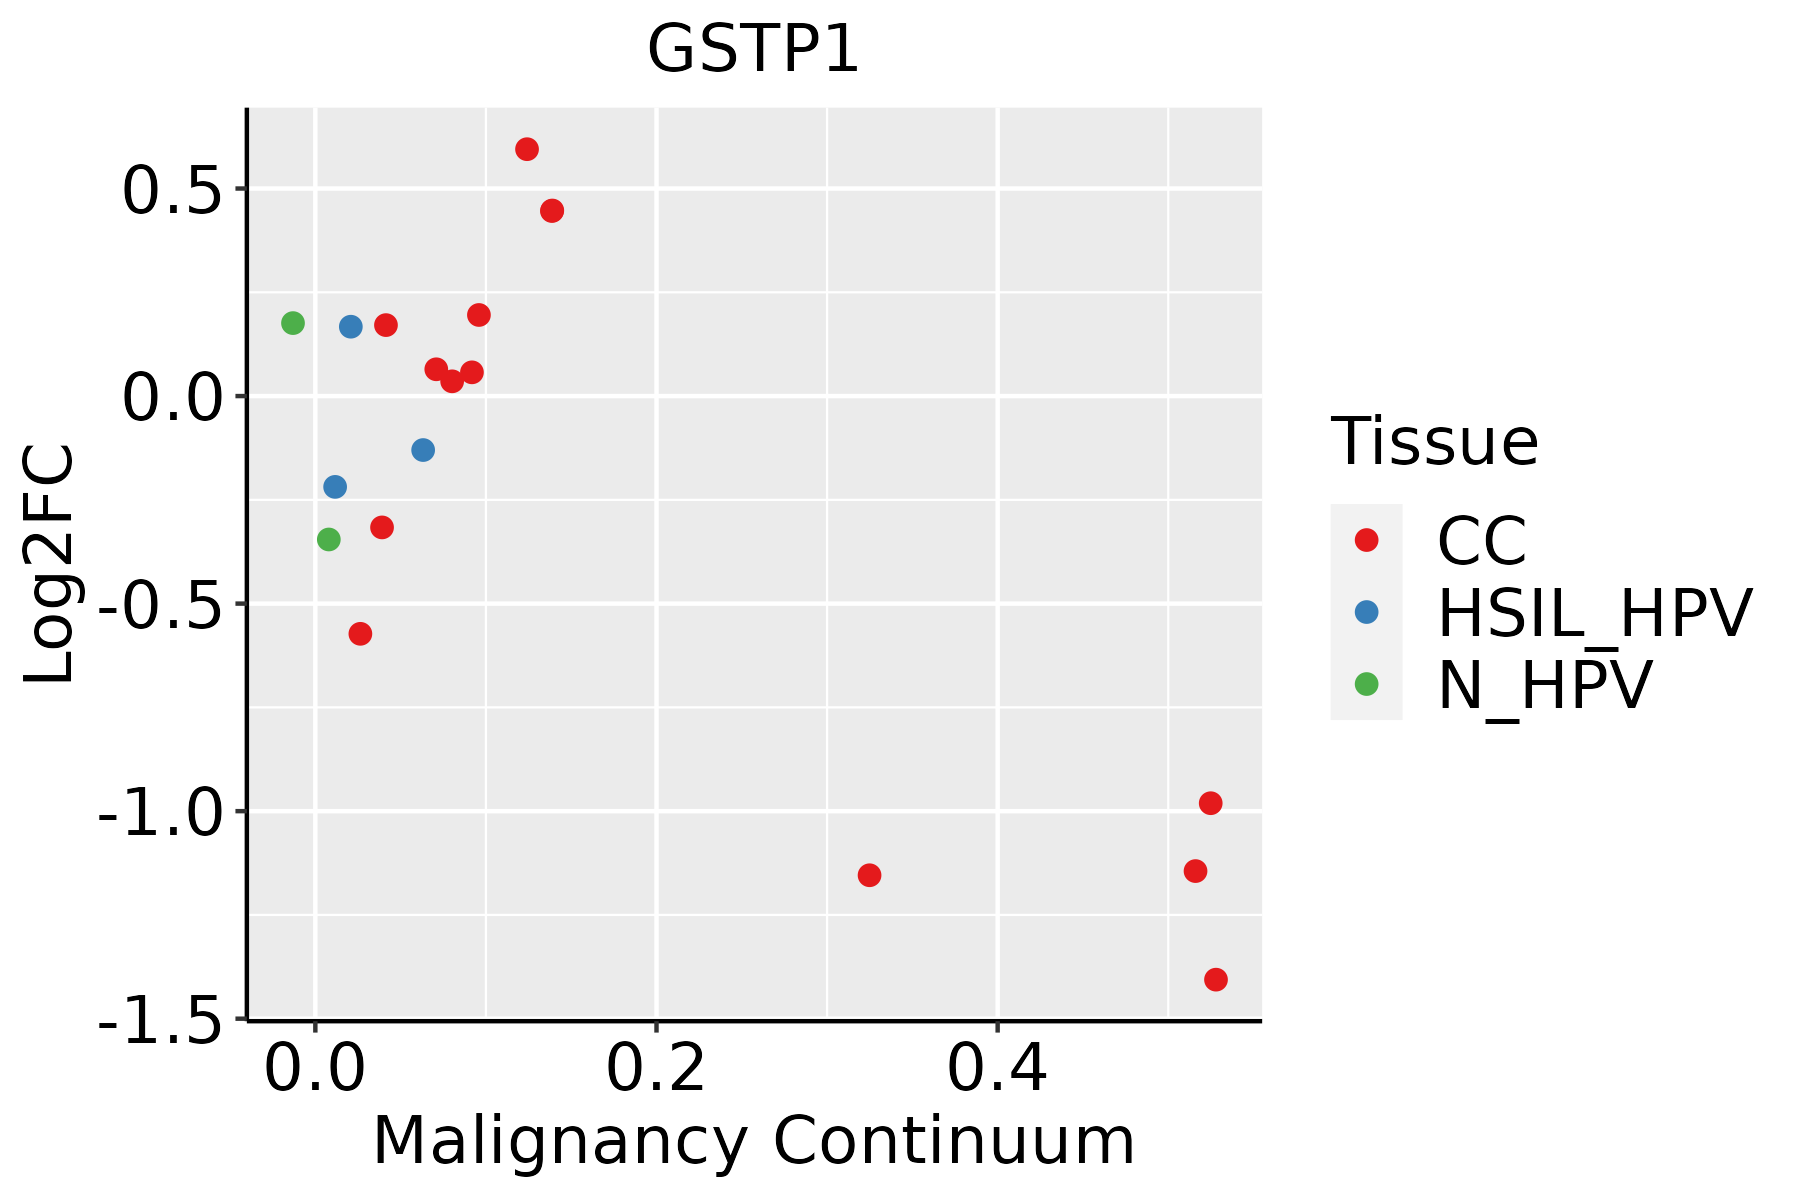 | CC: Cervix cancer |
| HSIL_HPV: HPV-infected high-grade squamous intraepithelial lesions | ||
| N_HPV: HPV-infected normal cervix | ||
| Colorectum (GSE201348) |  | FAP: Familial adenomatous polyposis |
| CRC: Colorectal cancer | ||
| Colorectum (HTA11) |  | AD: Adenomas |
| SER: Sessile serrated lesions | ||
| MSI-H: Microsatellite-high colorectal cancer | ||
| MSS: Microsatellite stable colorectal cancer | ||
| Endometrium | 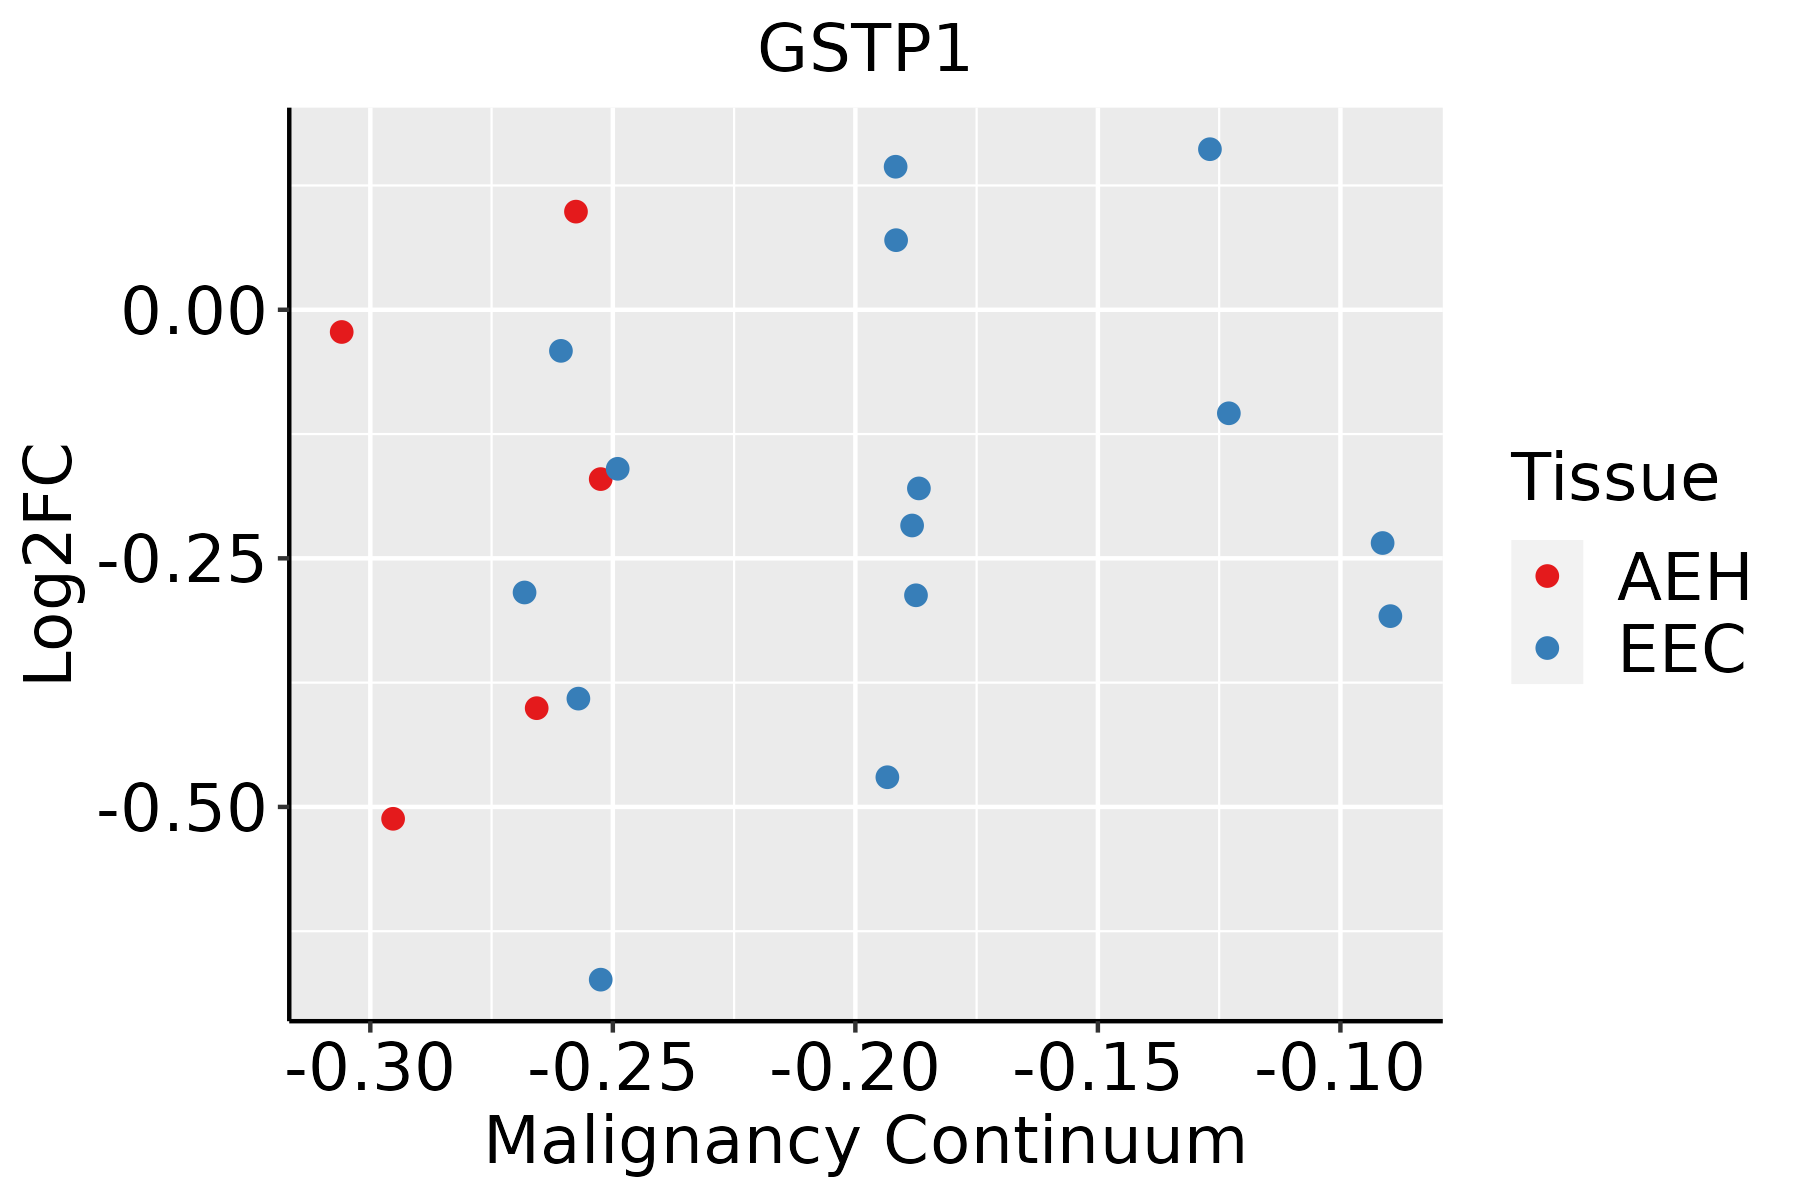 | AEH: Atypical endometrial hyperplasia |
| EEC: Endometrioid Cancer | ||
| Esophagus | 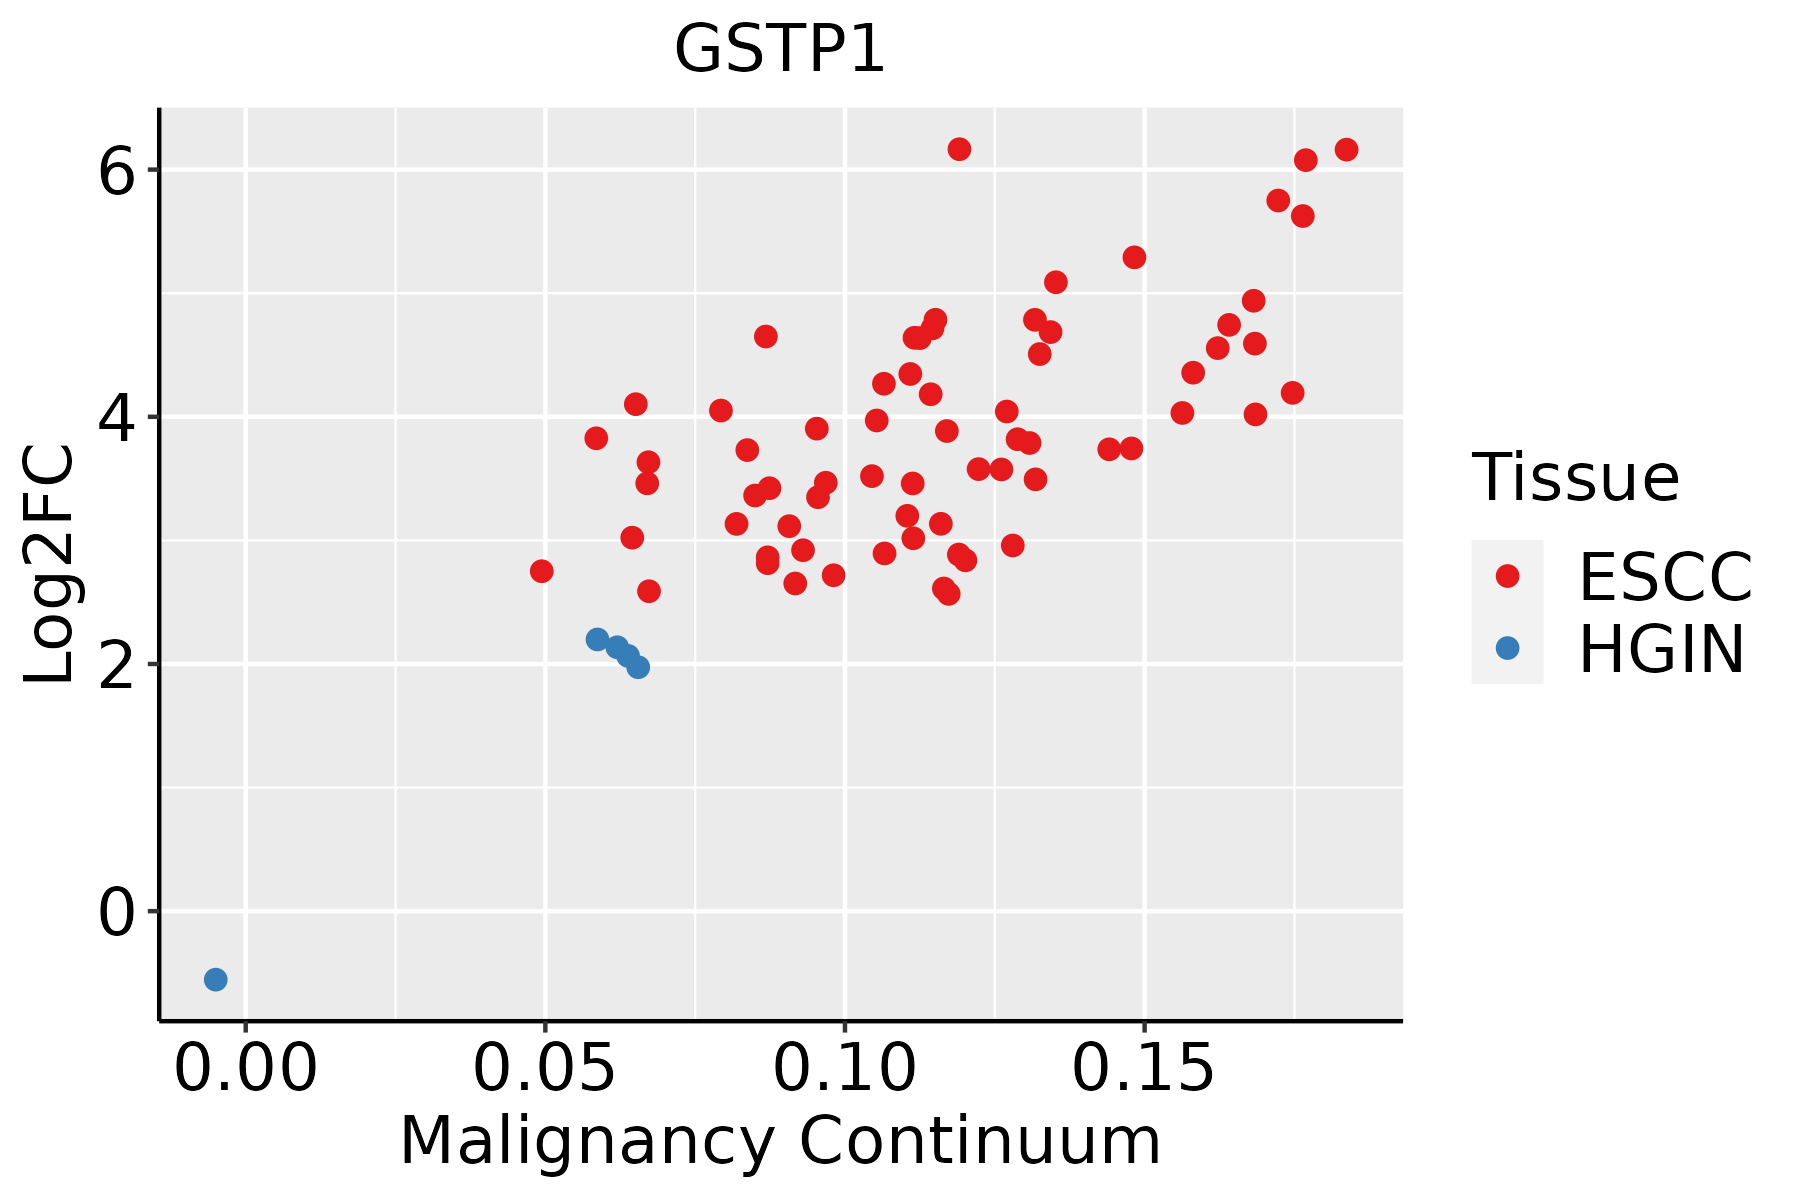 | ESCC: Esophageal squamous cell carcinoma |
| HGIN: High-grade intraepithelial neoplasias | ||
| LGIN: Low-grade intraepithelial neoplasias | ||
| Liver |  | HCC: Hepatocellular carcinoma |
| NAFLD: Non-alcoholic fatty liver disease | ||
| Lung | 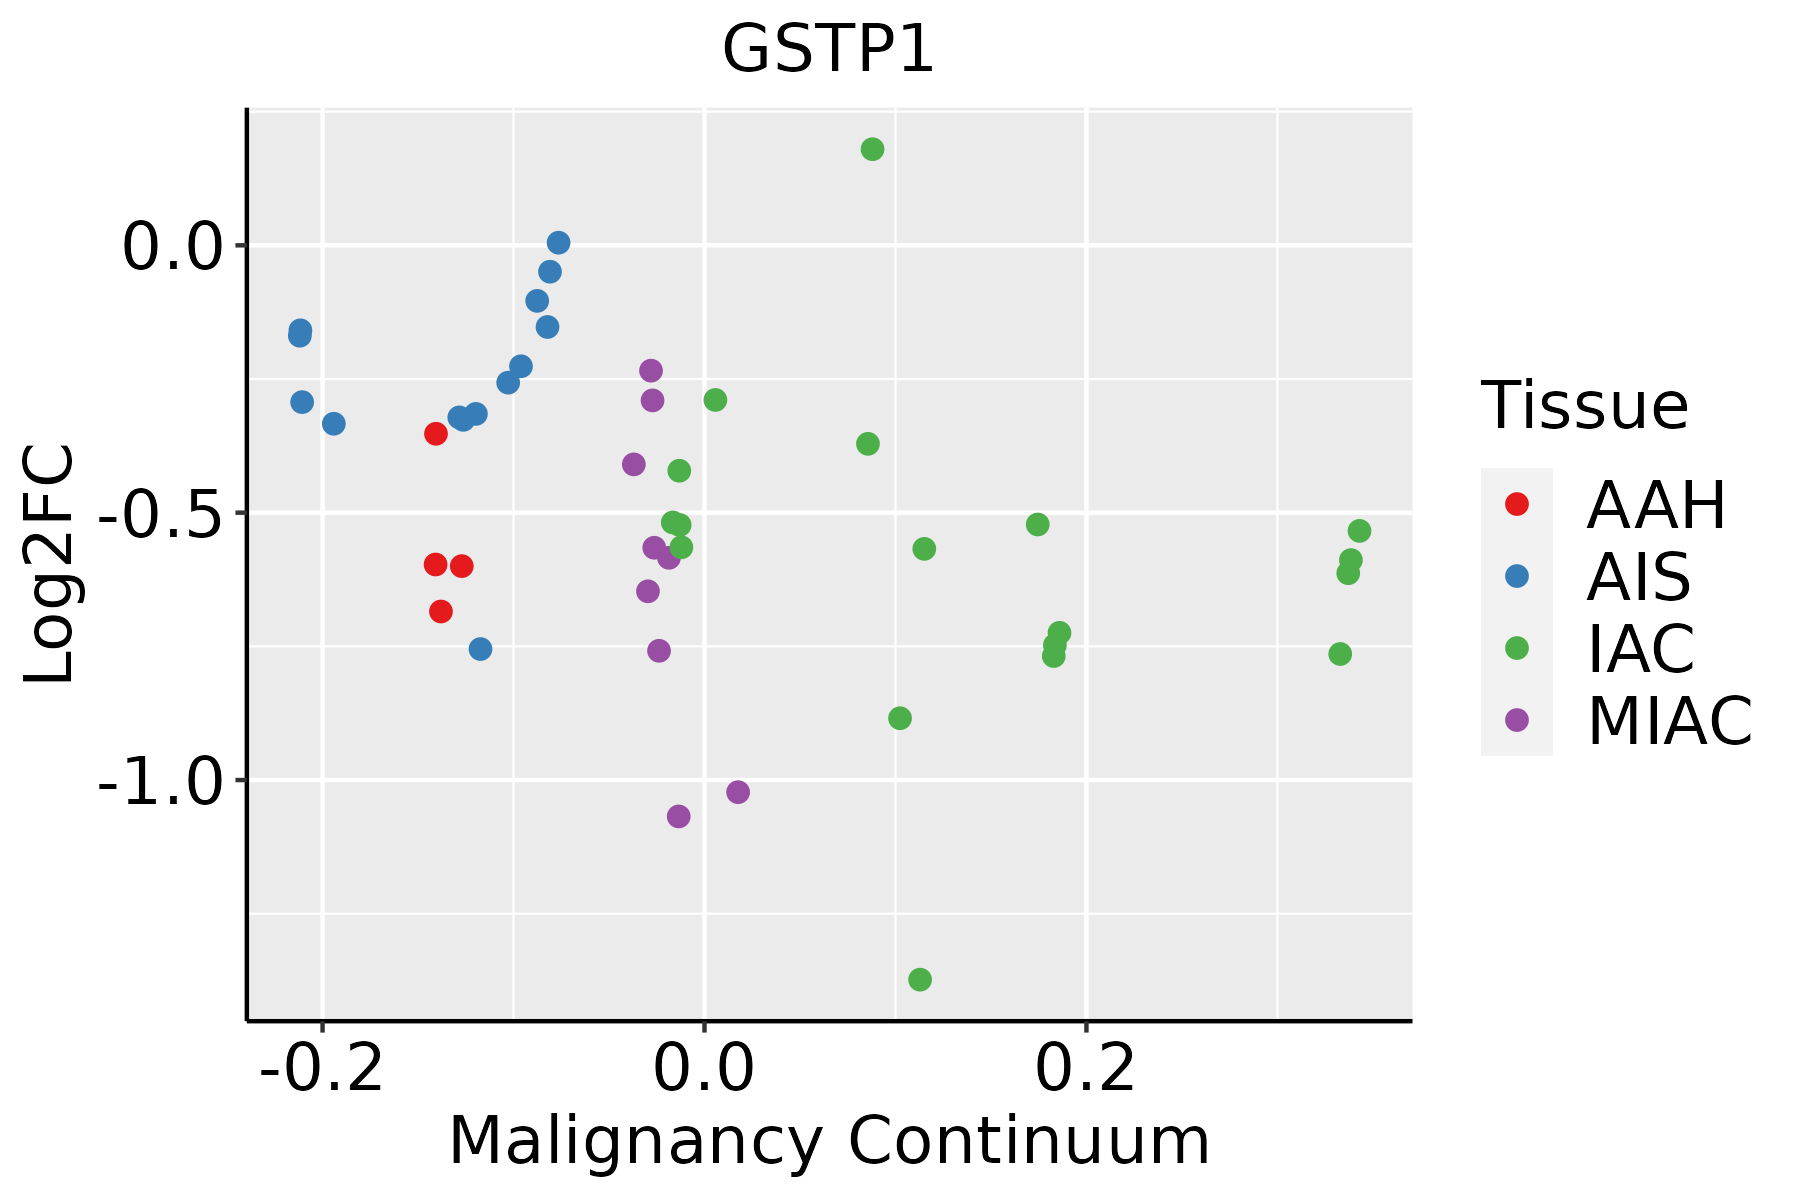 | AAH: Atypical adenomatous hyperplasia |
| AIS: Adenocarcinoma in situ | ||
| IAC: Invasive lung adenocarcinoma | ||
| MIA: Minimally invasive adenocarcinoma | ||
| Oral Cavity | 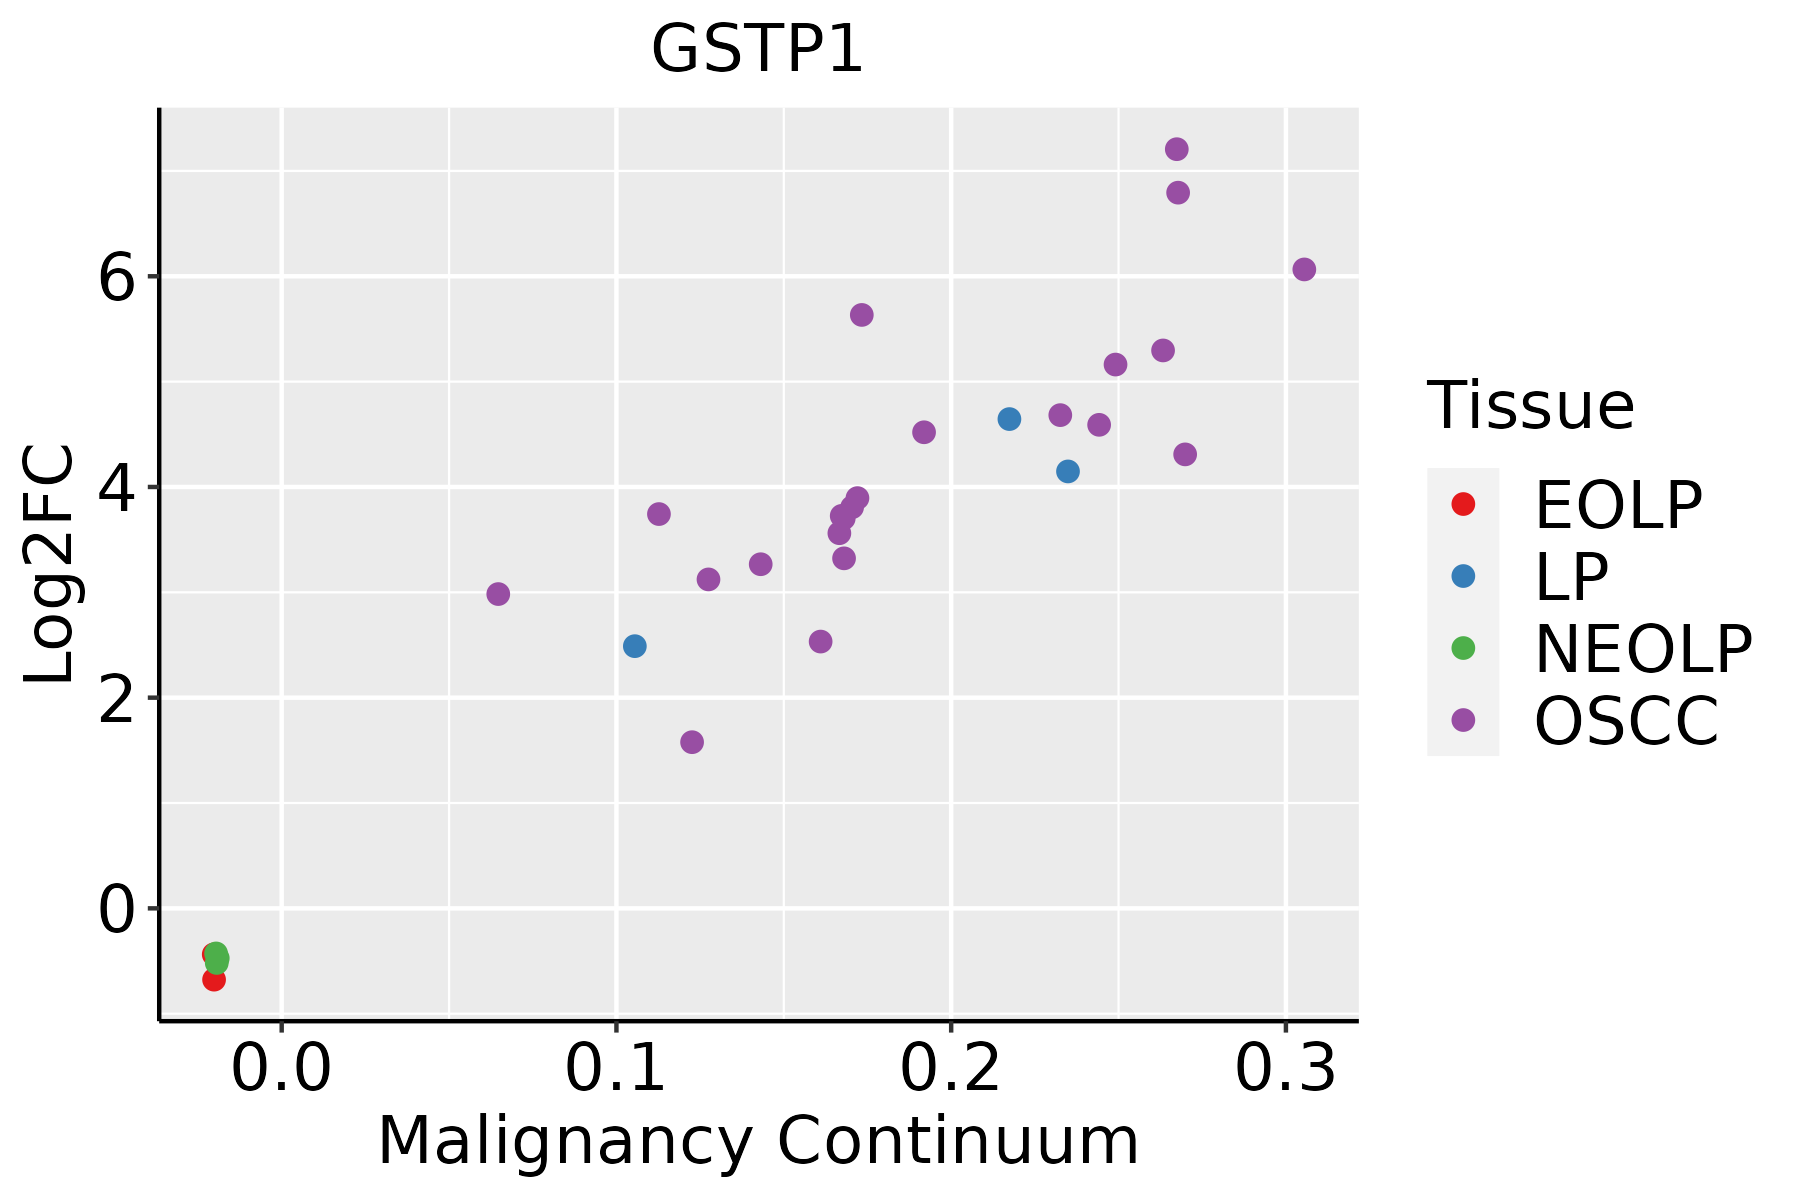 | EOLP: Erosive Oral lichen planus |
| LP: leukoplakia | ||
| NEOLP: Non-erosive oral lichen planus | ||
| OSCC: Oral squamous cell carcinoma | ||
| Prostate | 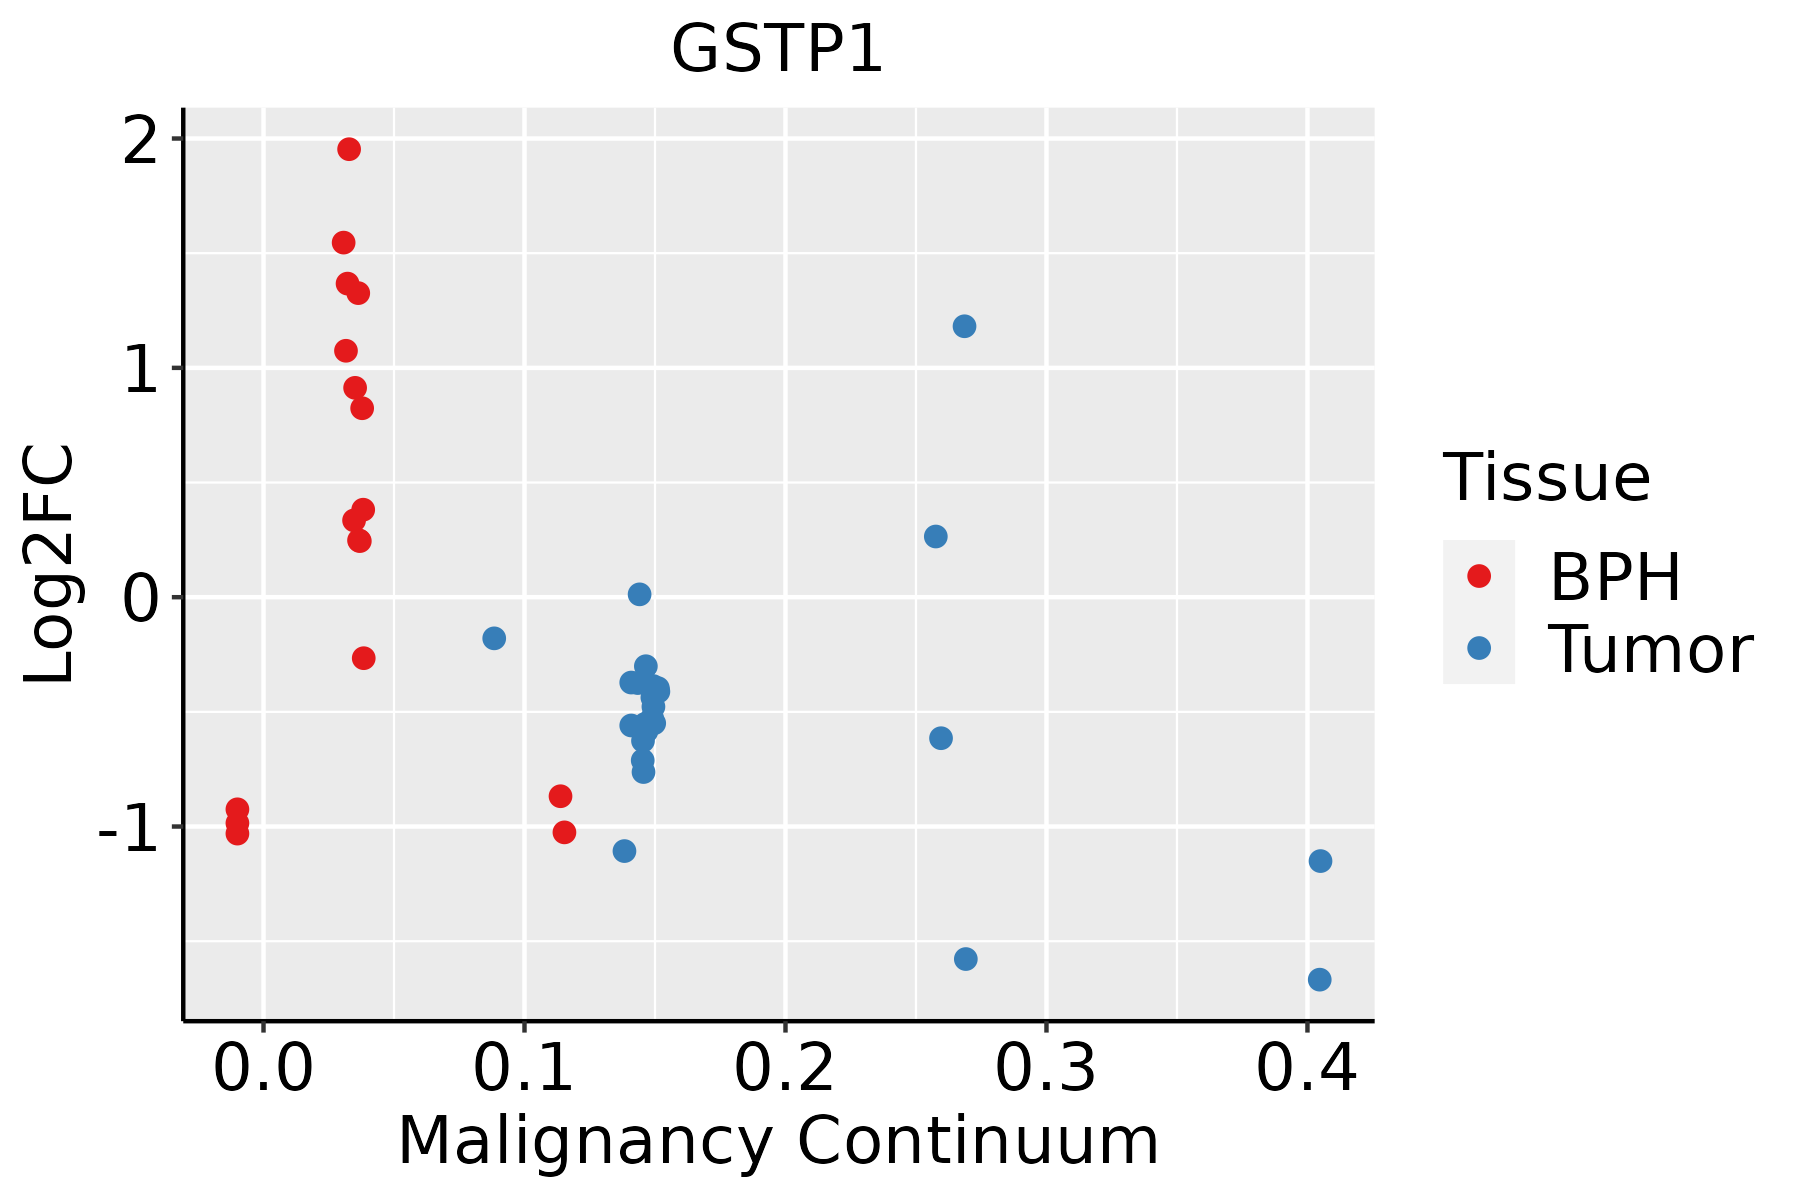 | BPH: Benign Prostatic Hyperplasia |
| Skin |  | AK: Actinic keratosis |
| cSCC: Cutaneous squamous cell carcinoma | ||
| SCCIS:squamous cell carcinoma in situ | ||
| Thyroid |  | ATC: Anaplastic thyroid cancer |
| HT: Hashimoto's thyroiditis | ||
| PTC: Papillary thyroid cancer |
| ∗log2FC in expression of this searched gene in stem-like cells from each diseased tissue sample relative to stem-like cells in normal samples in each tissue plotted against the malignancy continuum. Samples are colored based on if they are from different disease stage. |
Top |
Malignant transformation related pathway analysis |
| Find out the enriched GO biological processes and KEGG pathways involved in transition from healthy to precancer to cancer |
| Tissue | Disease Stage | Enriched GO biological Processes |
| Colorectum | AD |  |
| Colorectum | SER |  |
| Colorectum | MSS |  |
| Colorectum | MSI-H |  |
| Colorectum | FAP |  |
| ∗Top 15 enriched GO BP terms are showed in the bar plot of each disease state in each tissue. Each row represents a significant GO biological process which is colored according to the -log10(p.adjust). |
| Page: 1 2 3 4 5 6 7 8 9 |
| GO ID | Tissue | Disease Stage | Description | Gene Ratio | Bg Ratio | pvalue | p.adjust | Count |
| GO:001056323 | Lung | AAH | negative regulation of phosphorus metabolic process | 28/613 | 442/18723 | 7.12e-04 | 2.55e-02 | 28 |
| GO:190165322 | Lung | AAH | cellular response to peptide | 24/613 | 359/18723 | 8.02e-04 | 2.72e-02 | 24 |
| GO:004340922 | Lung | AAH | negative regulation of MAPK cascade | 15/613 | 180/18723 | 8.78e-04 | 2.88e-02 | 15 |
| GO:005140323 | Lung | AAH | stress-activated MAPK cascade | 18/613 | 239/18723 | 9.29e-04 | 2.92e-02 | 18 |
| GO:003286822 | Lung | AAH | response to insulin | 19/613 | 264/18723 | 1.17e-03 | 3.33e-02 | 19 |
| GO:200123423 | Lung | AAH | negative regulation of apoptotic signaling pathway | 17/613 | 224/18723 | 1.17e-03 | 3.33e-02 | 17 |
| GO:00706635 | Lung | AAH | regulation of leukocyte proliferation | 18/613 | 245/18723 | 1.23e-03 | 3.40e-02 | 18 |
| GO:007137522 | Lung | AAH | cellular response to peptide hormone stimulus | 20/613 | 290/18723 | 1.47e-03 | 3.76e-02 | 20 |
| GO:000974323 | Lung | AAH | response to carbohydrate | 18/613 | 253/18723 | 1.76e-03 | 4.22e-02 | 18 |
| GO:00706615 | Lung | AAH | leukocyte proliferation | 21/613 | 318/18723 | 1.93e-03 | 4.37e-02 | 21 |
| GO:007030223 | Lung | AAH | regulation of stress-activated protein kinase signaling cascade | 15/613 | 195/18723 | 1.96e-03 | 4.39e-02 | 15 |
| GO:004232623 | Lung | AAH | negative regulation of phosphorylation | 24/613 | 385/18723 | 2.06e-03 | 4.56e-02 | 24 |
| GO:000193323 | Lung | AAH | negative regulation of protein phosphorylation | 22/613 | 342/18723 | 2.11e-03 | 4.61e-02 | 22 |
| GO:007136421 | Lung | MIAC | cellular response to epidermal growth factor stimulus | 11/967 | 45/18723 | 1.32e-05 | 9.85e-04 | 11 |
| GO:200123333 | Lung | MIAC | regulation of apoptotic signaling pathway | 38/967 | 356/18723 | 1.88e-05 | 1.27e-03 | 38 |
| GO:007084921 | Lung | MIAC | response to epidermal growth factor | 11/967 | 49/18723 | 3.15e-05 | 1.86e-03 | 11 |
| GO:007138323 | Lung | MIAC | cellular response to steroid hormone stimulus | 25/967 | 204/18723 | 5.46e-05 | 2.75e-03 | 25 |
| GO:000697923 | Lung | MIAC | response to oxidative stress | 43/967 | 446/18723 | 6.39e-05 | 3.12e-03 | 43 |
| GO:000974332 | Lung | MIAC | response to carbohydrate | 28/967 | 253/18723 | 1.23e-04 | 5.10e-03 | 28 |
| GO:004854523 | Lung | MIAC | response to steroid hormone | 34/967 | 339/18723 | 1.73e-04 | 6.42e-03 | 34 |
| Page: 1 2 3 4 5 6 7 8 9 10 11 12 13 14 15 16 17 18 19 20 21 22 23 24 25 26 27 28 29 30 31 32 33 34 35 36 37 38 39 40 41 42 43 44 45 46 47 48 49 50 51 52 53 54 55 56 57 58 59 60 61 62 63 64 65 66 67 68 69 70 71 72 73 74 75 76 77 78 79 80 81 82 83 84 85 86 87 88 89 90 91 92 93 94 95 96 97 98 99 100 101 102 103 104 105 |
| Pathway ID | Tissue | Disease Stage | Description | Gene Ratio | Bg Ratio | pvalue | p.adjust | qvalue | Count |
| hsa0541818 | Breast | Precancer | Fluid shear stress and atherosclerosis | 28/684 | 139/8465 | 4.74e-06 | 6.00e-05 | 4.59e-05 | 28 |
| hsa0048010 | Breast | Precancer | Glutathione metabolism | 12/684 | 57/8465 | 1.68e-03 | 1.08e-02 | 8.30e-03 | 12 |
| hsa0541819 | Breast | Precancer | Fluid shear stress and atherosclerosis | 28/684 | 139/8465 | 4.74e-06 | 6.00e-05 | 4.59e-05 | 28 |
| hsa0048013 | Breast | Precancer | Glutathione metabolism | 12/684 | 57/8465 | 1.68e-03 | 1.08e-02 | 8.30e-03 | 12 |
| hsa0541824 | Breast | IDC | Fluid shear stress and atherosclerosis | 34/867 | 139/8465 | 9.41e-07 | 1.61e-05 | 1.20e-05 | 34 |
| hsa0048023 | Breast | IDC | Glutathione metabolism | 13/867 | 57/8465 | 4.25e-03 | 2.56e-02 | 1.91e-02 | 13 |
| hsa0541834 | Breast | IDC | Fluid shear stress and atherosclerosis | 34/867 | 139/8465 | 9.41e-07 | 1.61e-05 | 1.20e-05 | 34 |
| hsa0048033 | Breast | IDC | Glutathione metabolism | 13/867 | 57/8465 | 4.25e-03 | 2.56e-02 | 1.91e-02 | 13 |
| hsa0541844 | Breast | DCIS | Fluid shear stress and atherosclerosis | 34/846 | 139/8465 | 5.31e-07 | 9.03e-06 | 6.65e-06 | 34 |
| hsa0048041 | Breast | DCIS | Glutathione metabolism | 13/846 | 57/8465 | 3.44e-03 | 1.98e-02 | 1.46e-02 | 13 |
| hsa0541854 | Breast | DCIS | Fluid shear stress and atherosclerosis | 34/846 | 139/8465 | 5.31e-07 | 9.03e-06 | 6.65e-06 | 34 |
| hsa0048051 | Breast | DCIS | Glutathione metabolism | 13/846 | 57/8465 | 3.44e-03 | 1.98e-02 | 1.46e-02 | 13 |
| hsa0541820 | Cervix | CC | Fluid shear stress and atherosclerosis | 50/1267 | 139/8465 | 5.71e-10 | 1.32e-08 | 7.81e-09 | 50 |
| hsa052157 | Cervix | CC | Prostate cancer | 27/1267 | 97/8465 | 7.54e-04 | 3.39e-03 | 2.01e-03 | 27 |
| hsa0522510 | Cervix | CC | Hepatocellular carcinoma | 40/1267 | 168/8465 | 1.52e-03 | 6.39e-03 | 3.78e-03 | 40 |
| hsa05418110 | Cervix | CC | Fluid shear stress and atherosclerosis | 50/1267 | 139/8465 | 5.71e-10 | 1.32e-08 | 7.81e-09 | 50 |
| hsa0521512 | Cervix | CC | Prostate cancer | 27/1267 | 97/8465 | 7.54e-04 | 3.39e-03 | 2.01e-03 | 27 |
| hsa0522513 | Cervix | CC | Hepatocellular carcinoma | 40/1267 | 168/8465 | 1.52e-03 | 6.39e-03 | 3.78e-03 | 40 |
| hsa05418 | Colorectum | AD | Fluid shear stress and atherosclerosis | 54/2092 | 139/8465 | 1.41e-04 | 1.16e-03 | 7.37e-04 | 54 |
| hsa05225 | Colorectum | AD | Hepatocellular carcinoma | 59/2092 | 168/8465 | 1.50e-03 | 8.69e-03 | 5.54e-03 | 59 |
| Page: 1 2 3 4 5 6 7 |
Top |
Cell-cell communication analysis |
| Identification of potential cell-cell interactions between two cell types and their ligand-receptor pairs for different disease states |
| Ligand | Receptor | LRpair | Pathway | Tissue | Disease Stage |
| Page: 1 |
Top |
Single-cell gene regulatory network inference analysis |
| Find out the significant the regulons (TFs) and the target genes of each regulon across cell types for different disease states |
| TF | Cell Type | Tissue | Disease Stage | Target Gene | RSS | Regulon Activity |
| ∗The dot plots of a searched regulon are shown for all cell subpopulations in each disease state of each tissue based on the regulon specific score inferred using pySCENIC and by calculating the average expression. |
| Page: 1 |
Top |
Somatic mutation of malignant transformation related genes |
| Annotation of somatic variants for genes involved in malignant transformation |
| Hugo Symbol | Variant Class | Variant Classification | dbSNP RS | HGVSc | HGVSp | HGVSp Short | SWISSPROT | BIOTYPE | SIFT | PolyPhen | Tumor Sample Barcode | Tissue | Histology | Sex | Age | Stage | Therapy Types | Drugs | Outcome |
| GSTP1 | SNV | Missense_Mutation | c.203N>G | p.Thr68Ser | p.T68S | P09211 | protein_coding | tolerated(0.13) | benign(0.007) | TCGA-D8-A27M-01 | Breast | breast invasive carcinoma | Female | <65 | I/II | Chemotherapy | methotrexate+5 | SD | |
| GSTP1 | SNV | Missense_Mutation | novel | c.414G>C | p.Gln138His | p.Q138H | P09211 | protein_coding | tolerated(0.28) | benign(0.003) | TCGA-Q1-A73Q-01 | Cervix | cervical & endocervical cancer | Female | <65 | I/II | Chemotherapy | cisplatin | SD |
| GSTP1 | SNV | Missense_Mutation | c.500C>A | p.Ala167Asp | p.A167D | P09211 | protein_coding | tolerated(0.07) | possibly_damaging(0.793) | TCGA-AA-3697-01 | Colorectum | colon adenocarcinoma | Male | >=65 | I/II | Unknown | Unknown | SD | |
| GSTP1 | SNV | Missense_Mutation | rs188653023 | c.548G>A | p.Arg183His | p.R183H | P09211 | protein_coding | deleterious(0.04) | benign(0.087) | TCGA-CK-4951-01 | Colorectum | colon adenocarcinoma | Female | >=65 | I/II | Unknown | Unknown | PD |
| GSTP1 | SNV | Missense_Mutation | c.601N>G | p.Asn201Asp | p.N201D | P09211 | protein_coding | tolerated(0.2) | benign(0.007) | TCGA-AP-A056-01 | Endometrium | uterine corpus endometrioid carcinoma | Female | <65 | I/II | Unknown | Unknown | SD | |
| GSTP1 | SNV | Missense_Mutation | c.533C>T | p.Ser178Leu | p.S178L | P09211 | protein_coding | tolerated(0.11) | benign(0.049) | TCGA-AP-A0LF-01 | Endometrium | uterine corpus endometrioid carcinoma | Female | >=65 | III/IV | Unknown | Unknown | SD | |
| GSTP1 | SNV | Missense_Mutation | rs752233998 | c.547N>T | p.Arg183Cys | p.R183C | P09211 | protein_coding | tolerated(0.05) | benign(0.177) | TCGA-AX-A1CE-01 | Endometrium | uterine corpus endometrioid carcinoma | Female | <65 | I/II | Unspecific | Paclitaxel | SD |
| GSTP1 | SNV | Missense_Mutation | novel | c.91N>A | p.Glu31Lys | p.E31K | P09211 | protein_coding | deleterious(0.02) | probably_damaging(0.964) | TCGA-DF-A2KN-01 | Endometrium | uterine corpus endometrioid carcinoma | Female | Unknown | I/II | Unknown | Unknown | SD |
| GSTP1 | SNV | Missense_Mutation | c.148N>C | p.Tyr50His | p.Y50H | P09211 | protein_coding | deleterious(0) | possibly_damaging(0.903) | TCGA-BC-A3KF-01 | Liver | liver hepatocellular carcinoma | Female | >=65 | I/II | Unknown | Unknown | SD | |
| GSTP1 | SNV | Missense_Mutation | rs752731774 | c.212N>A | p.Arg71His | p.R71H | P09211 | protein_coding | deleterious(0) | probably_damaging(0.992) | TCGA-DD-A4ND-01 | Liver | liver hepatocellular carcinoma | Female | <65 | I/II | Chemotherapy | adriamycin | CR |
| Page: 1 2 |
Top |
Related drugs of malignant transformation related genes |
| Identification of chemicals and drugs interact with genes involved in malignant transfromation |
| (DGIdb 4.0) |
| Entrez ID | Symbol | Category | Interaction Types | Drug Claim Name | Drug Name | PMIDs |
| 2950 | GSTP1 | ENZYME, CLINICALLY ACTIONABLE, DRUGGABLE GENOME | DNR | 10050715 | ||
| 2950 | GSTP1 | ENZYME, CLINICALLY ACTIONABLE, DRUGGABLE GENOME | FOLFOX REGIMEN | 19922504 | ||
| 2950 | GSTP1 | ENZYME, CLINICALLY ACTIONABLE, DRUGGABLE GENOME | NITROGEN MUSTARD | 2882834 | ||
| 2950 | GSTP1 | ENZYME, CLINICALLY ACTIONABLE, DRUGGABLE GENOME | ADM | 9382956 | ||
| 2950 | GSTP1 | ENZYME, CLINICALLY ACTIONABLE, DRUGGABLE GENOME | thiotepa | THIOTEPA | ||
| 2950 | GSTP1 | ENZYME, CLINICALLY ACTIONABLE, DRUGGABLE GENOME | PREDNISONE | PREDNISONE | 11186134 | |
| 2950 | GSTP1 | ENZYME, CLINICALLY ACTIONABLE, DRUGGABLE GENOME | CARBOPLATIN | CARBOPLATIN | 12360105 | |
| 2950 | GSTP1 | ENZYME, CLINICALLY ACTIONABLE, DRUGGABLE GENOME | epirubicin | EPIRUBICIN | 25008867,21362365,20568049 | |
| 2950 | GSTP1 | ENZYME, CLINICALLY ACTIONABLE, DRUGGABLE GENOME | 5-AZACYTIDINE | AZACITIDINE | 11696442 | |
| 2950 | GSTP1 | ENZYME, CLINICALLY ACTIONABLE, DRUGGABLE GENOME | fluorouracil | FLUOROURACIL | 27995989,21449681,18540691 |
| Page: 1 2 3 4 5 6 7 8 |

Copyright 2023-Present -The University of Texas Health Science Center at Houston |