
|
|||||
|
 | |
| |
| |
| |
| |
| |
|
Gene: MET |
Gene summary for MET |
| Gene information | Species | Human | Gene symbol | MET | Gene ID | 4233 |
| Gene name | MET proto-oncogene, receptor tyrosine kinase | |
| Gene Alias | AUTS9 | |
| Cytomap | 7q31.2 | |
| Gene Type | protein-coding | GO ID | GO:0000226 | UniProtAcc | A0A024R759 |
Top |
Malignant transformation analysis |
| Identification of the aberrant gene expression in precancerous and cancerous lesions by comparing the gene expression of stem-like cells in diseased tissues with normal stem cells |
| Entrez ID | Symbol | Replicates | Species | Organ | Tissue | Adj P-value | Log2FC | Malignancy |
| 4233 | MET | HTA11_3410_2000001011 | Human | Colorectum | AD | 1.41e-02 | -2.78e-01 | 0.0155 |
| 4233 | MET | F007 | Human | Colorectum | FAP | 8.47e-05 | 5.43e-01 | 0.1176 |
| 4233 | MET | A002-C-010 | Human | Colorectum | FAP | 1.34e-04 | 4.61e-01 | 0.242 |
| 4233 | MET | A001-C-207 | Human | Colorectum | FAP | 3.24e-04 | 4.62e-01 | 0.1278 |
| 4233 | MET | A015-C-203 | Human | Colorectum | FAP | 5.92e-23 | 4.59e-01 | -0.1294 |
| 4233 | MET | A015-C-204 | Human | Colorectum | FAP | 2.96e-03 | 2.99e-01 | -0.0228 |
| 4233 | MET | A014-C-040 | Human | Colorectum | FAP | 3.30e-05 | 5.26e-01 | -0.1184 |
| 4233 | MET | A002-C-201 | Human | Colorectum | FAP | 2.05e-08 | 3.46e-01 | 0.0324 |
| 4233 | MET | A002-C-203 | Human | Colorectum | FAP | 2.41e-08 | 4.88e-01 | 0.2786 |
| 4233 | MET | A001-C-119 | Human | Colorectum | FAP | 1.30e-23 | 8.80e-01 | -0.1557 |
| 4233 | MET | A001-C-108 | Human | Colorectum | FAP | 3.44e-21 | 5.89e-01 | -0.0272 |
| 4233 | MET | A002-C-021 | Human | Colorectum | FAP | 7.30e-13 | 5.71e-01 | 0.1171 |
| 4233 | MET | A002-C-205 | Human | Colorectum | FAP | 5.87e-20 | 4.79e-01 | -0.1236 |
| 4233 | MET | A001-C-104 | Human | Colorectum | FAP | 8.55e-21 | 7.18e-01 | 0.0184 |
| 4233 | MET | A015-C-006 | Human | Colorectum | FAP | 2.46e-05 | 3.55e-02 | -0.0994 |
| 4233 | MET | A015-C-106 | Human | Colorectum | FAP | 5.28e-17 | 5.71e-01 | -0.0511 |
| 4233 | MET | A002-C-114 | Human | Colorectum | FAP | 2.99e-08 | 1.91e-01 | -0.1561 |
| 4233 | MET | A015-C-104 | Human | Colorectum | FAP | 3.47e-25 | 4.74e-01 | -0.1899 |
| 4233 | MET | A001-C-014 | Human | Colorectum | FAP | 5.03e-19 | 6.24e-01 | 0.0135 |
| 4233 | MET | A002-C-016 | Human | Colorectum | FAP | 4.95e-12 | 4.23e-01 | 0.0521 |
| Page: 1 2 3 4 5 6 7 8 9 |
| Tissue | Expression Dynamics | Abbreviation |
| Colorectum (GSE201348) | 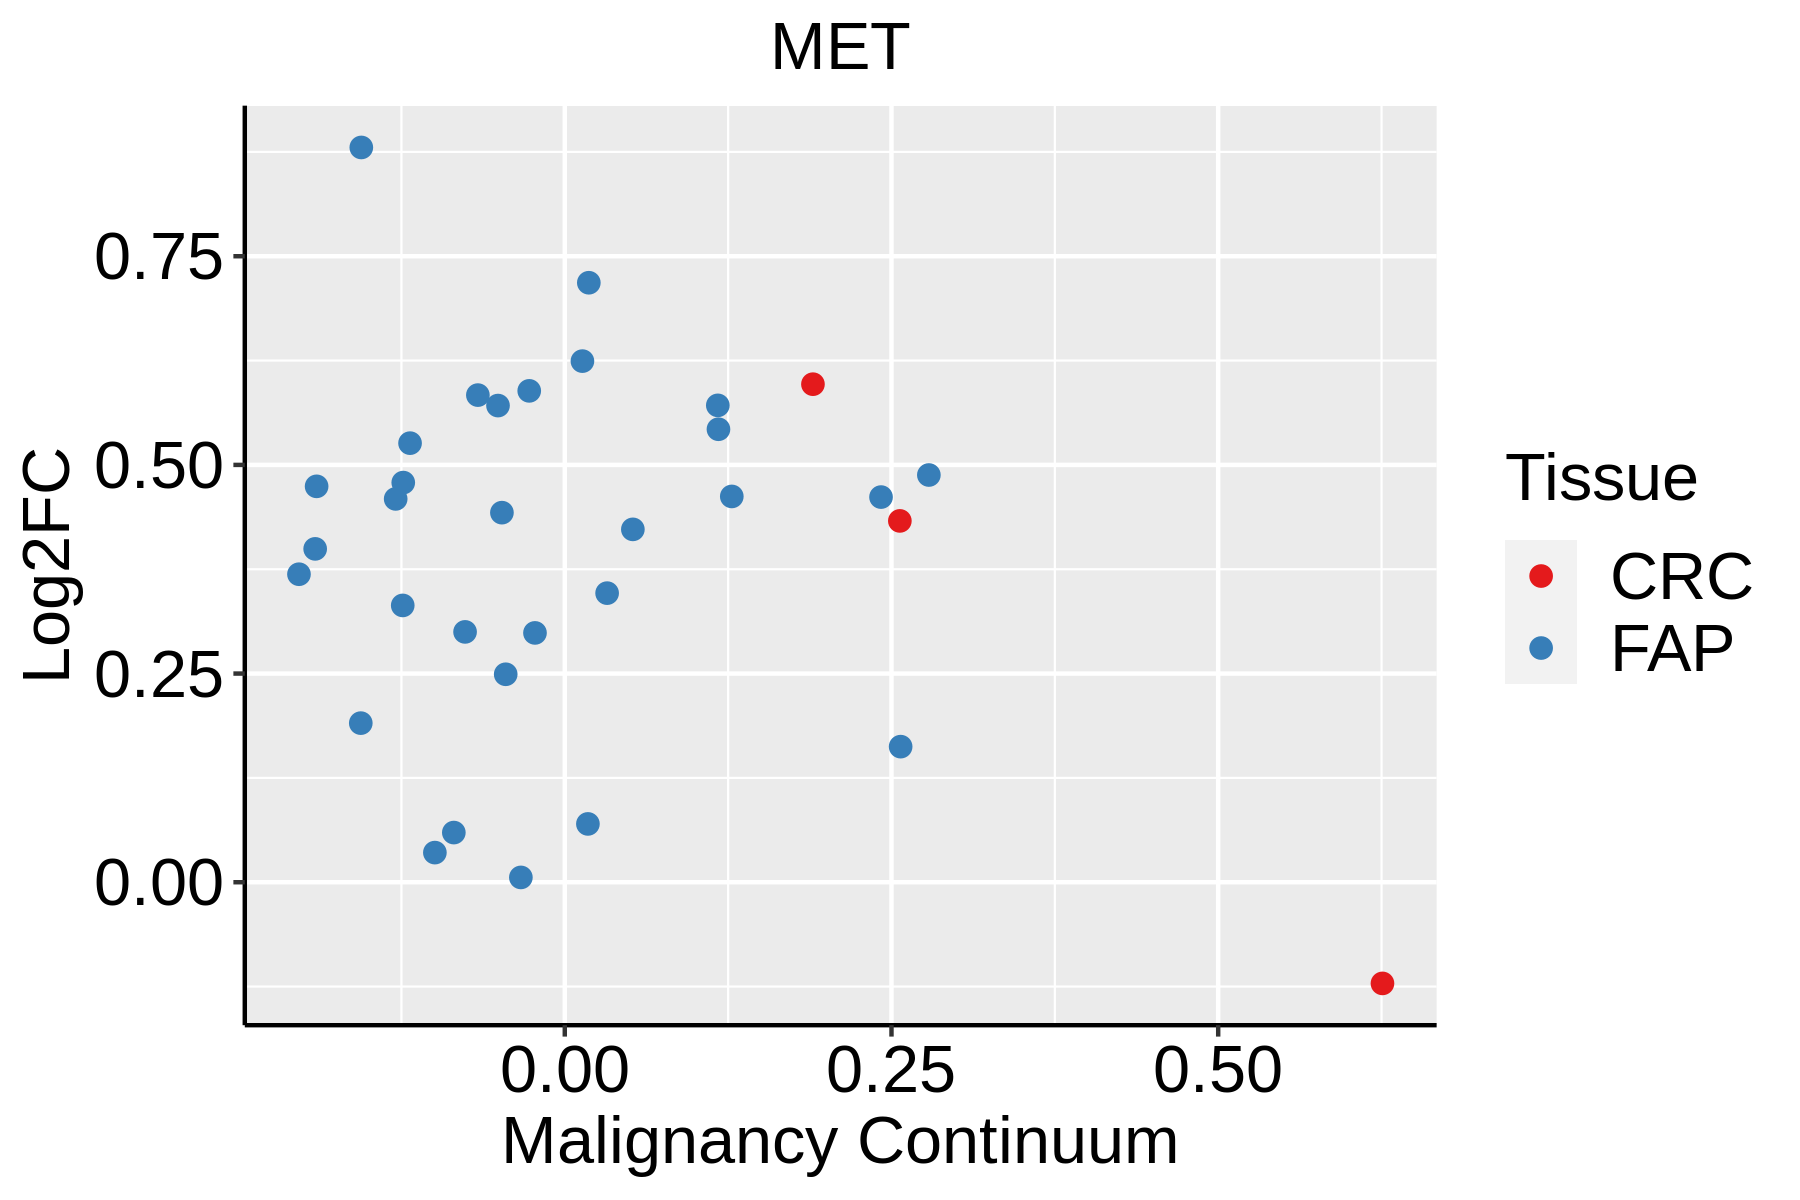 | FAP: Familial adenomatous polyposis |
| CRC: Colorectal cancer | ||
| Colorectum (HTA11) |  | AD: Adenomas |
| SER: Sessile serrated lesions | ||
| MSI-H: Microsatellite-high colorectal cancer | ||
| MSS: Microsatellite stable colorectal cancer | ||
| Esophagus | 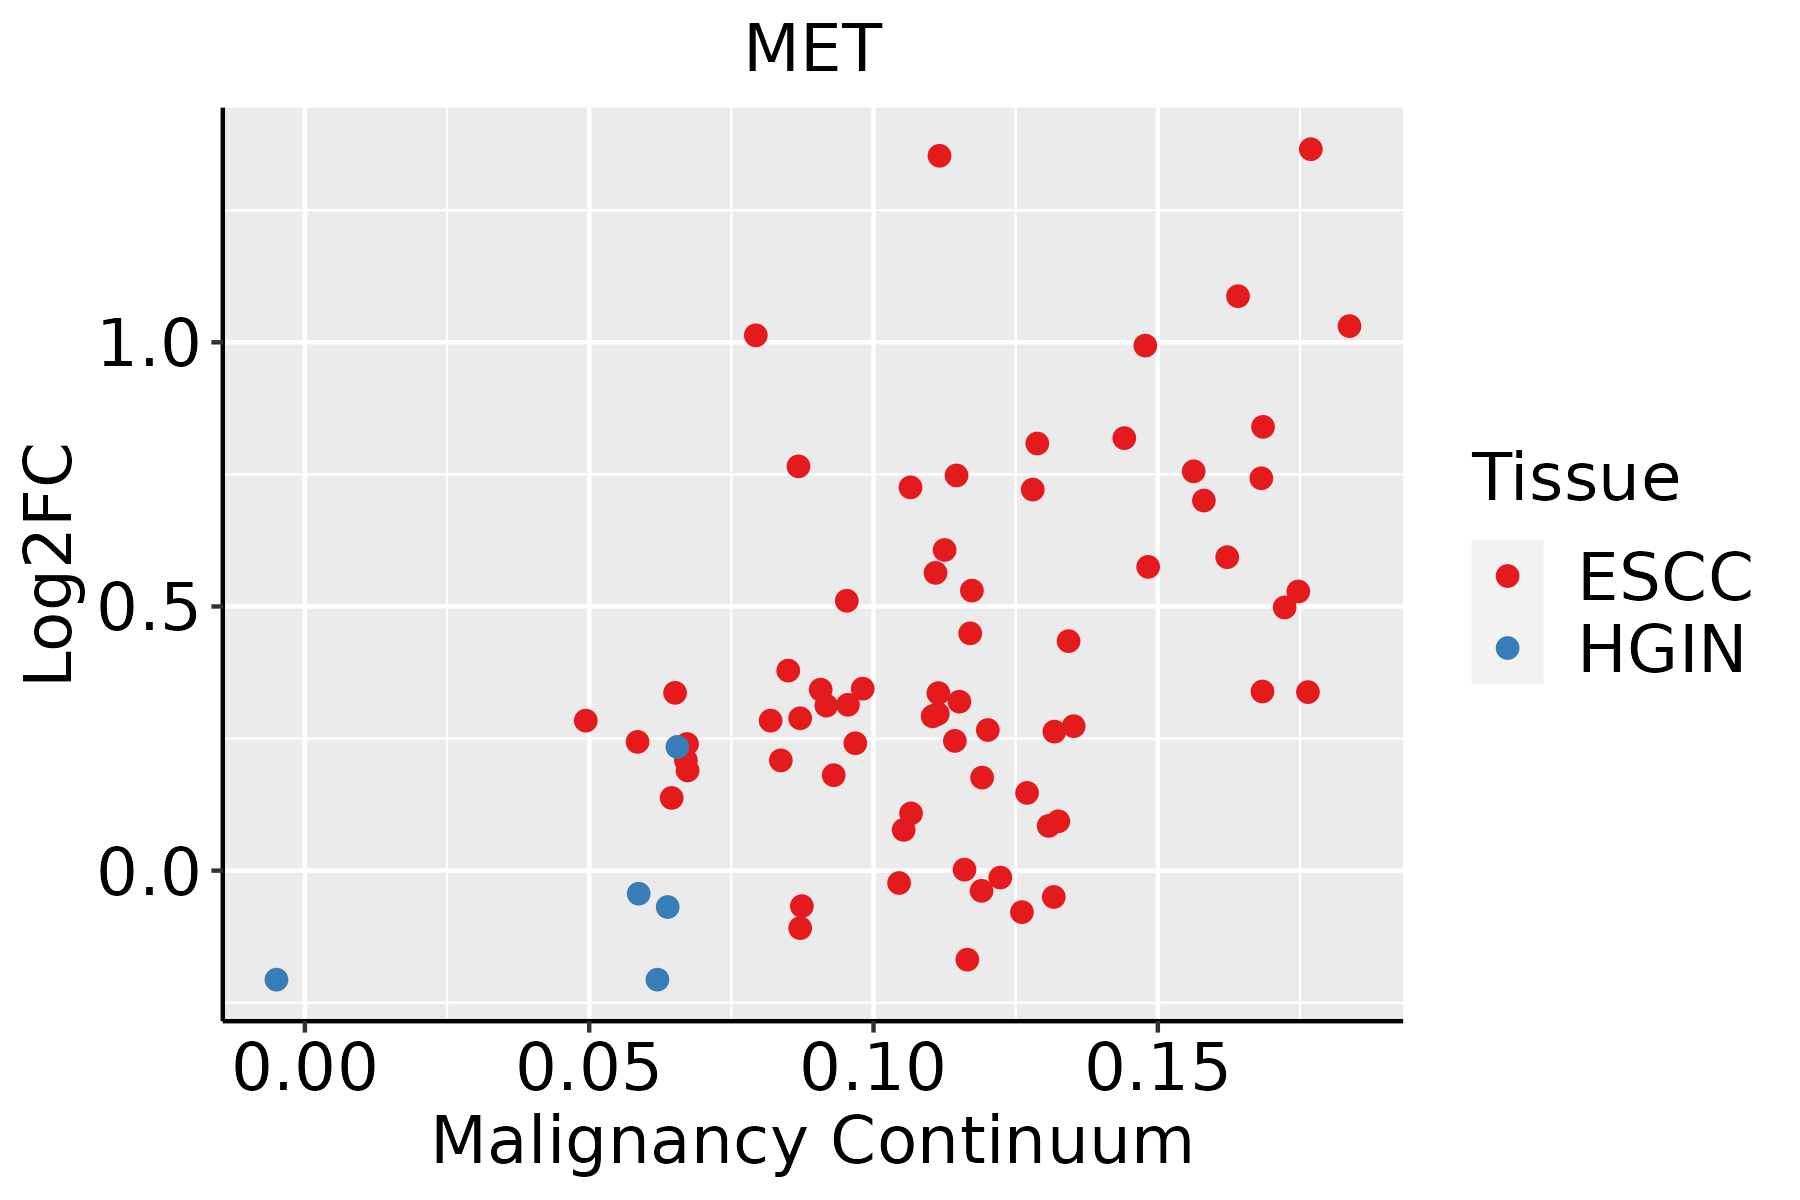 | ESCC: Esophageal squamous cell carcinoma |
| HGIN: High-grade intraepithelial neoplasias | ||
| LGIN: Low-grade intraepithelial neoplasias | ||
| Liver | 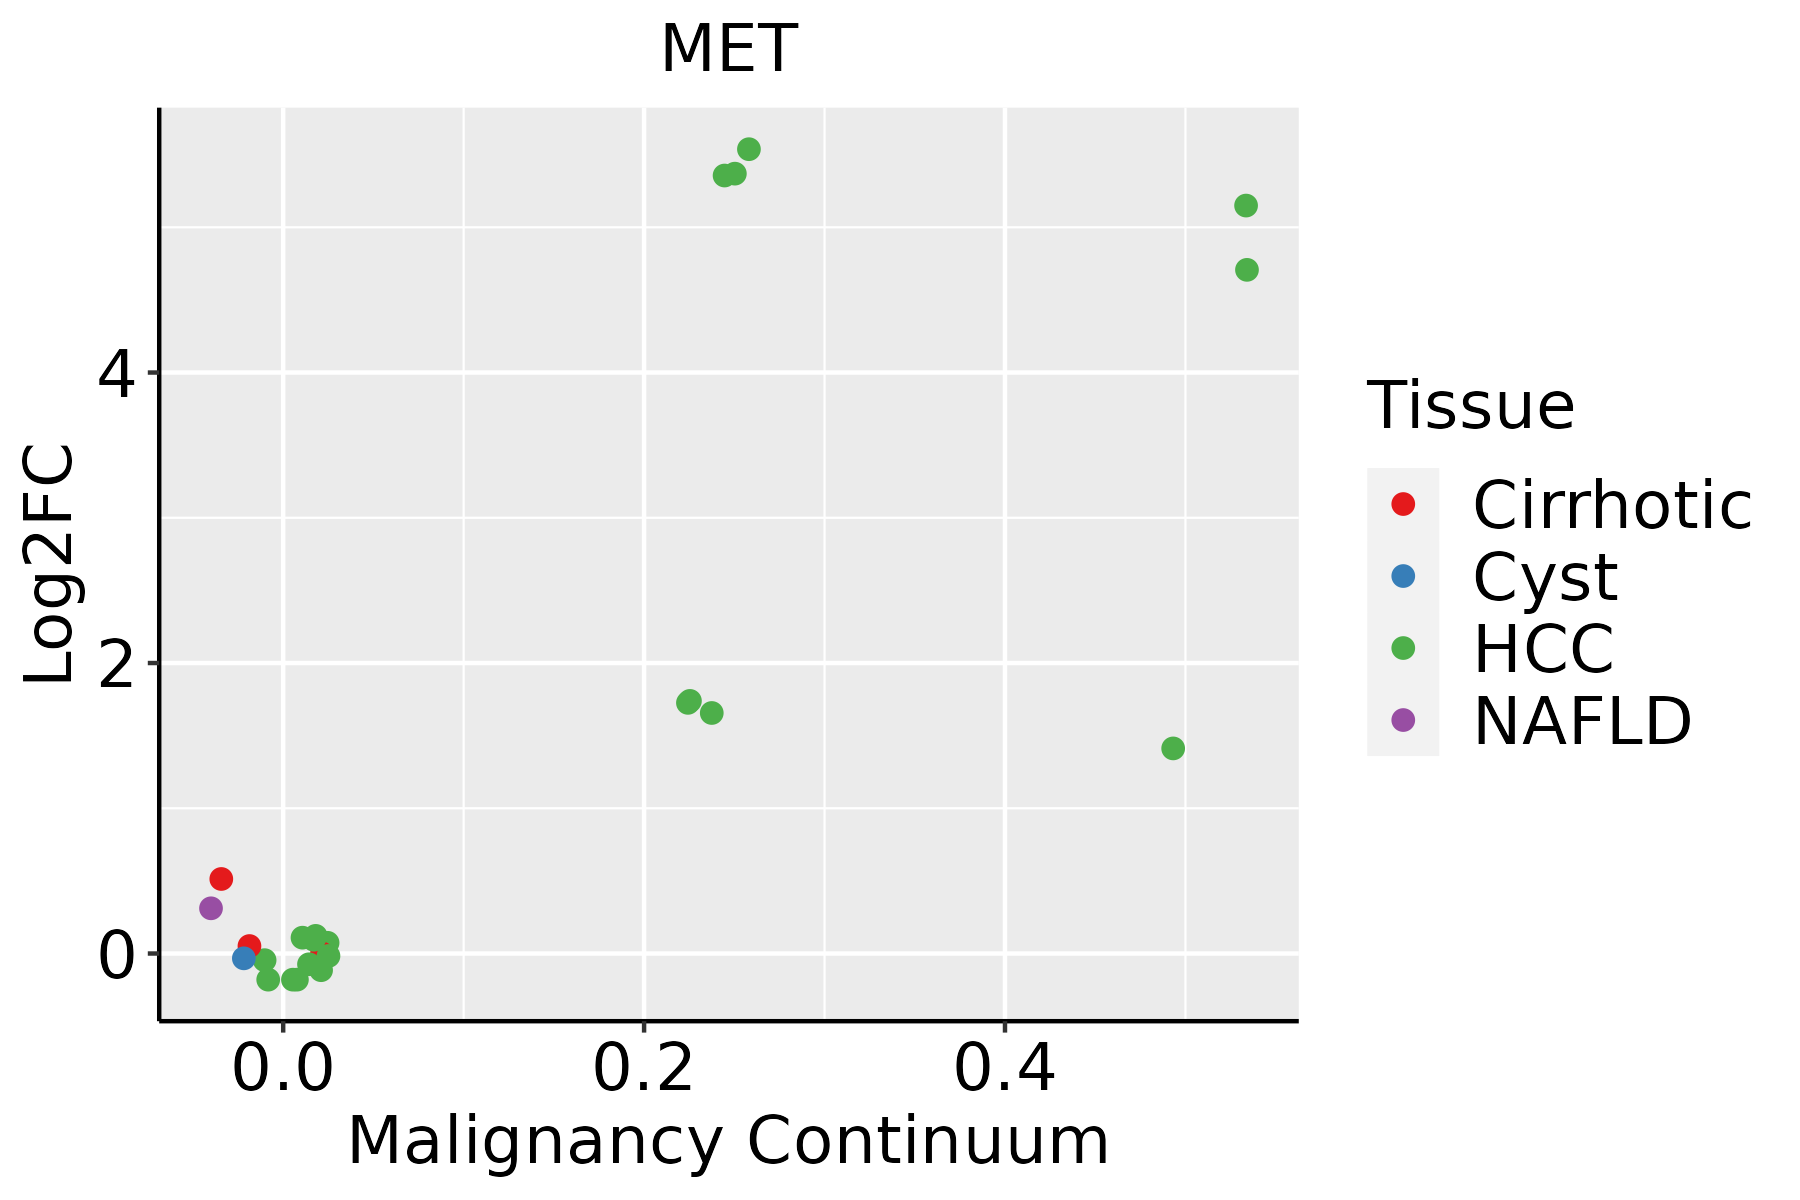 | HCC: Hepatocellular carcinoma |
| NAFLD: Non-alcoholic fatty liver disease | ||
| Lung | 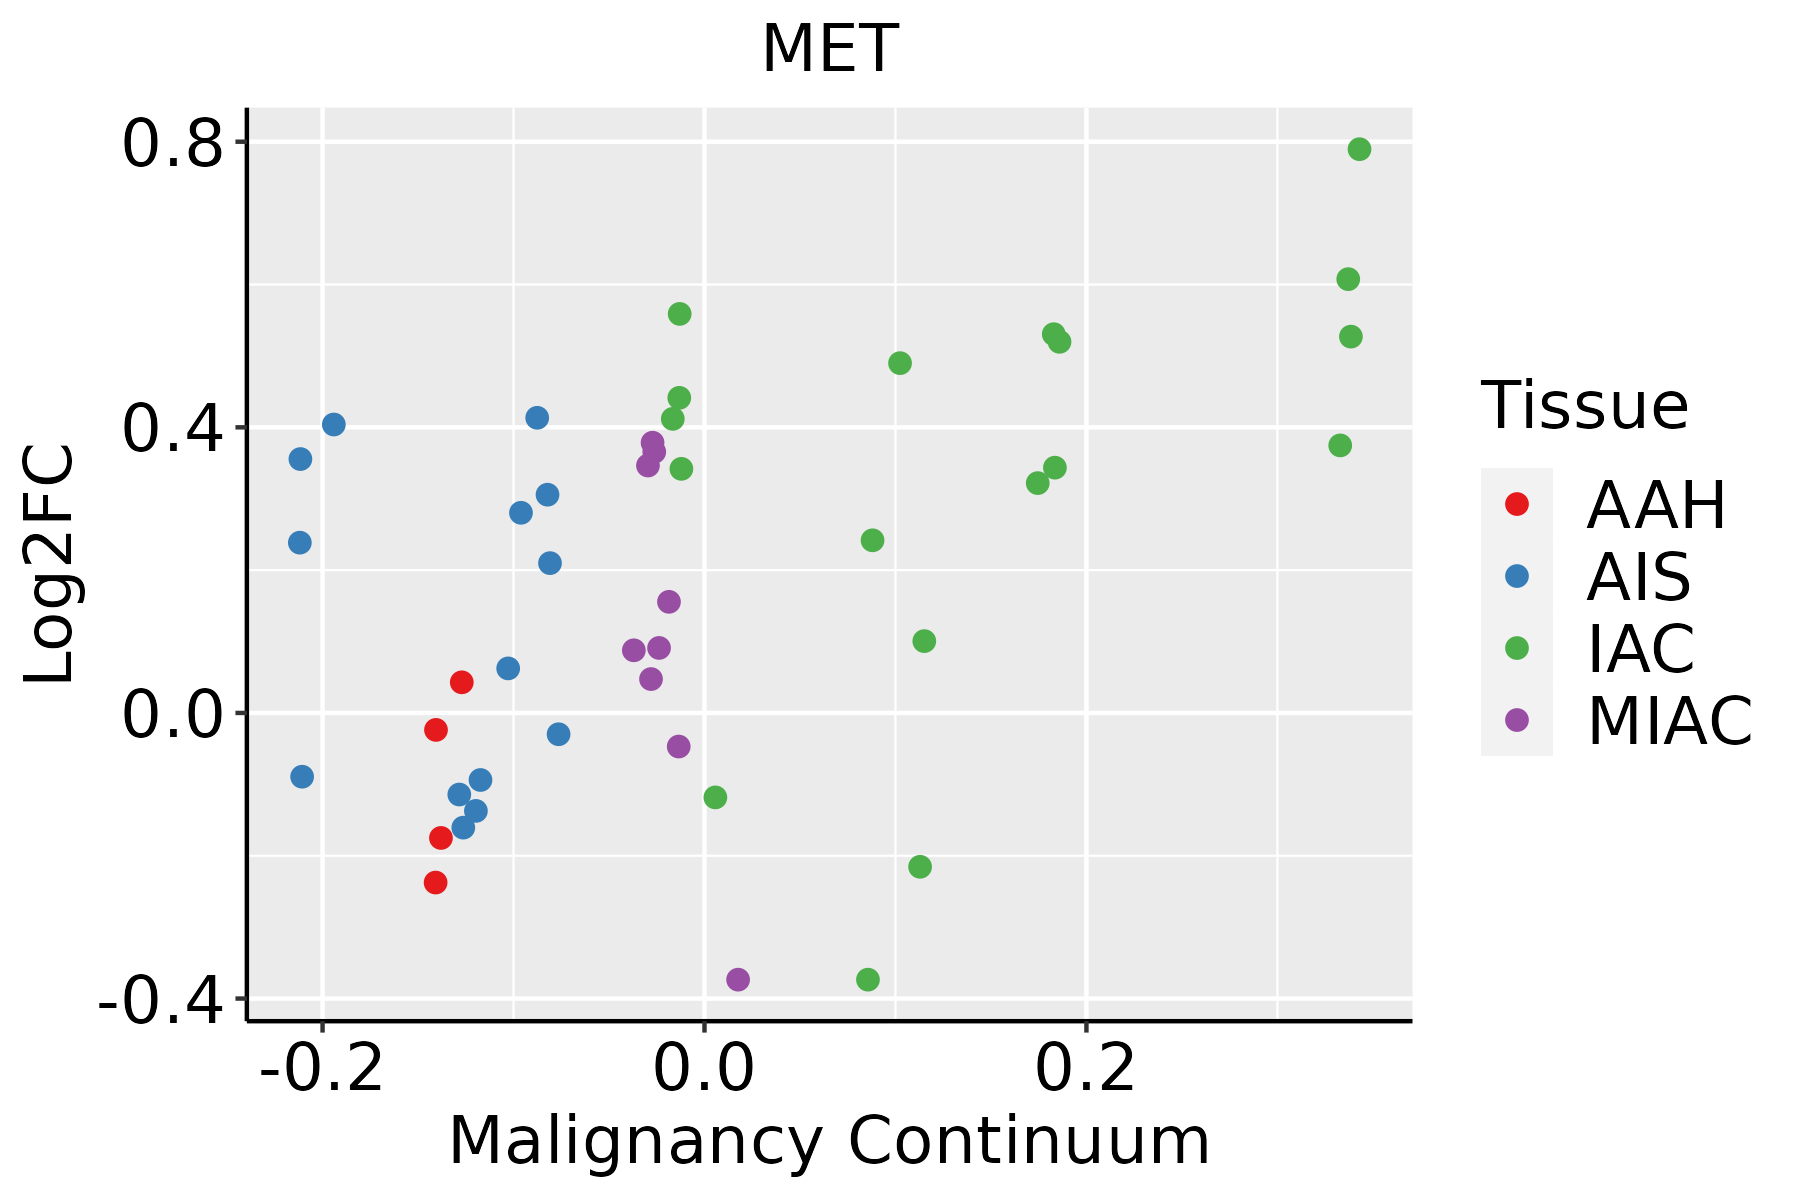 | AAH: Atypical adenomatous hyperplasia |
| AIS: Adenocarcinoma in situ | ||
| IAC: Invasive lung adenocarcinoma | ||
| MIA: Minimally invasive adenocarcinoma | ||
| Oral Cavity |  | EOLP: Erosive Oral lichen planus |
| LP: leukoplakia | ||
| NEOLP: Non-erosive oral lichen planus | ||
| OSCC: Oral squamous cell carcinoma | ||
| Prostate | 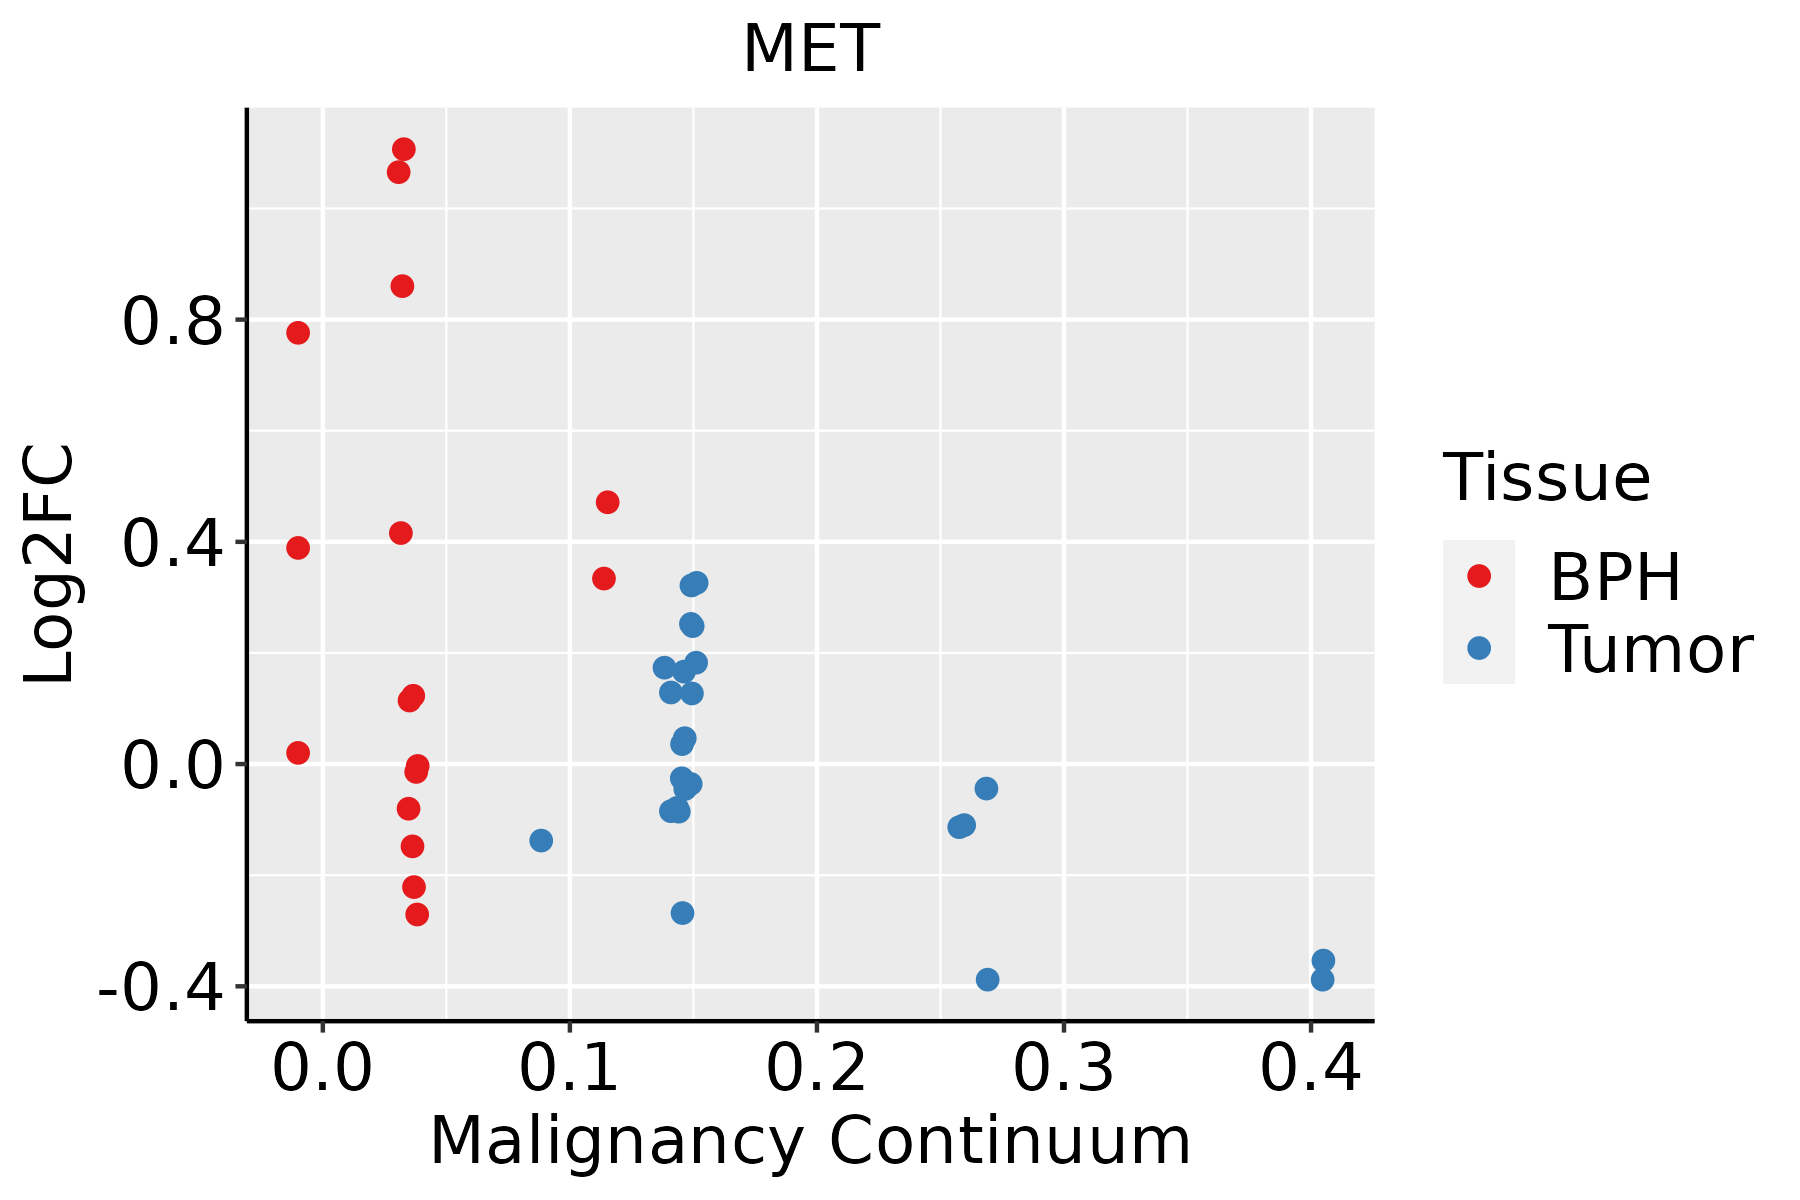 | BPH: Benign Prostatic Hyperplasia |
| Skin | 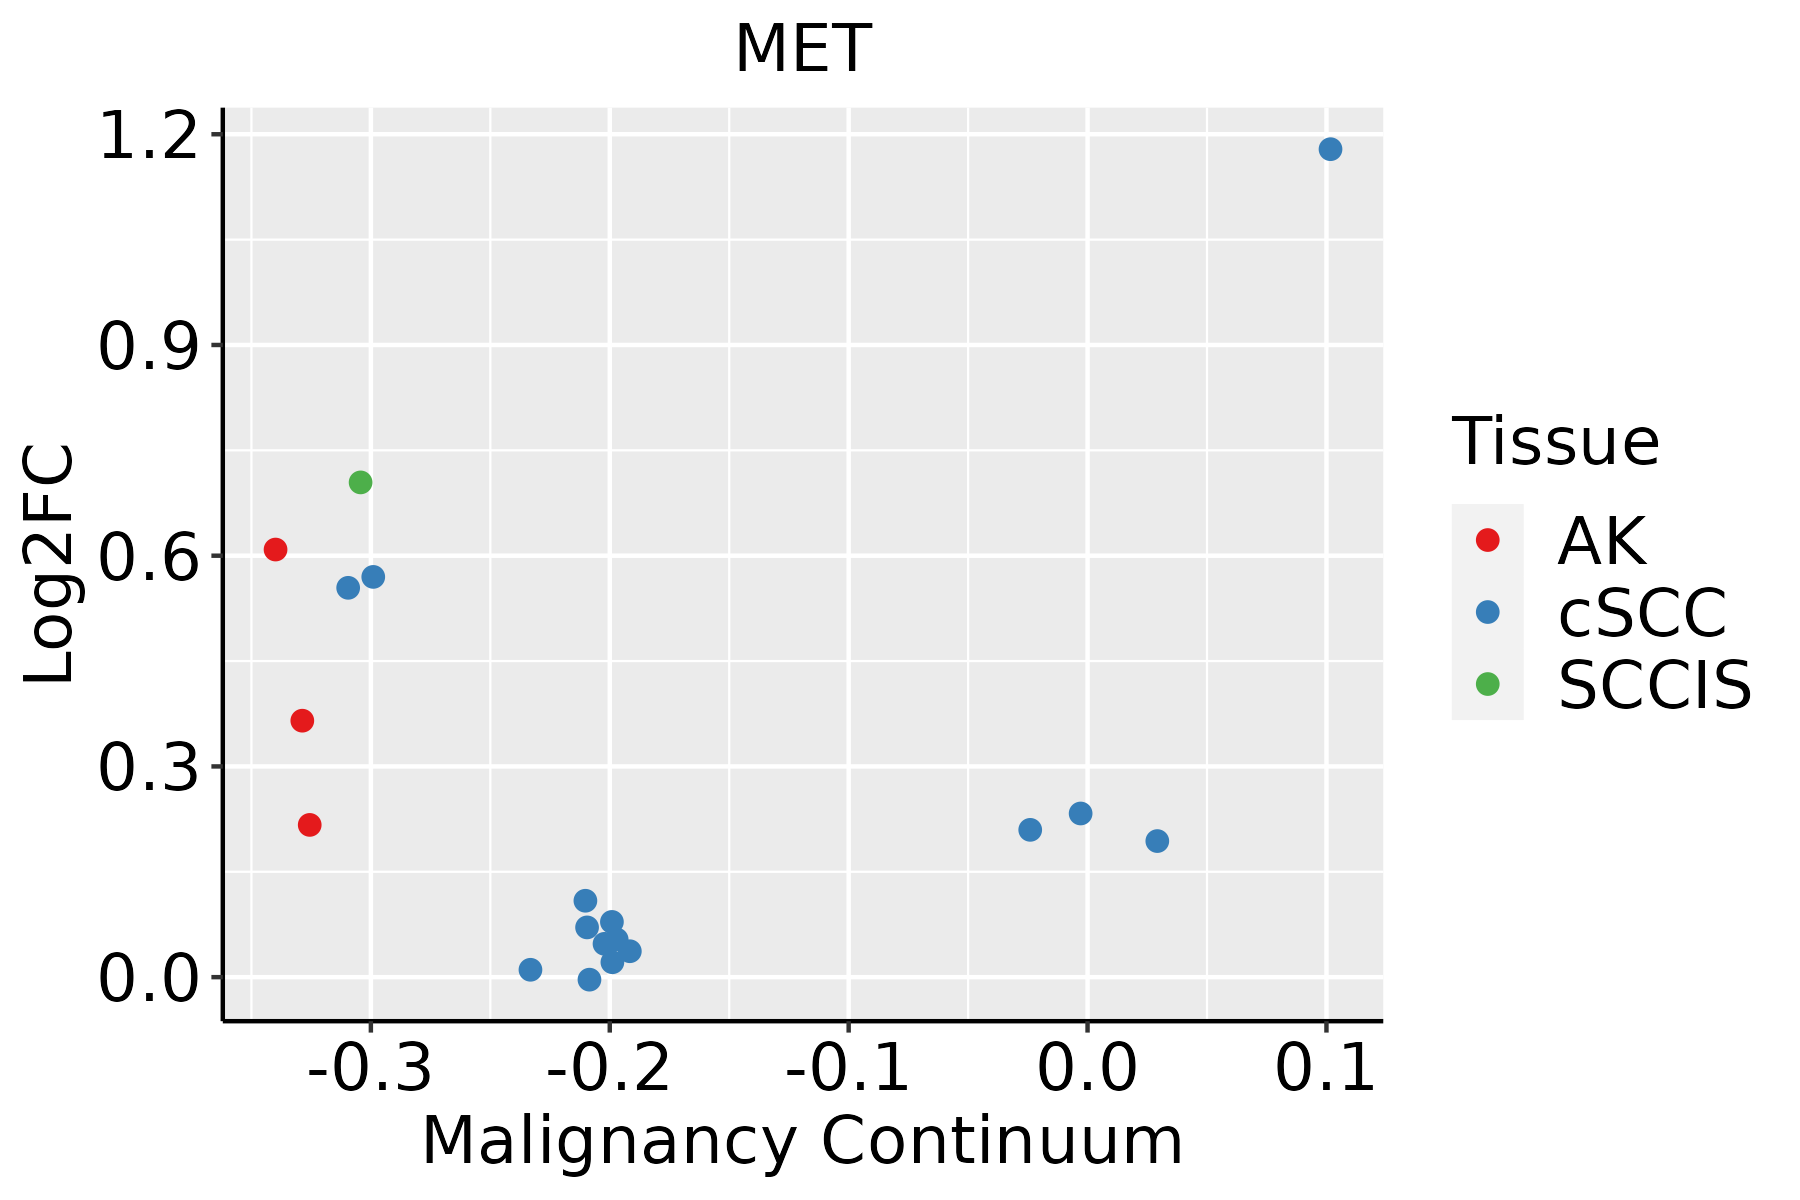 | AK: Actinic keratosis |
| cSCC: Cutaneous squamous cell carcinoma | ||
| SCCIS:squamous cell carcinoma in situ | ||
| Thyroid | 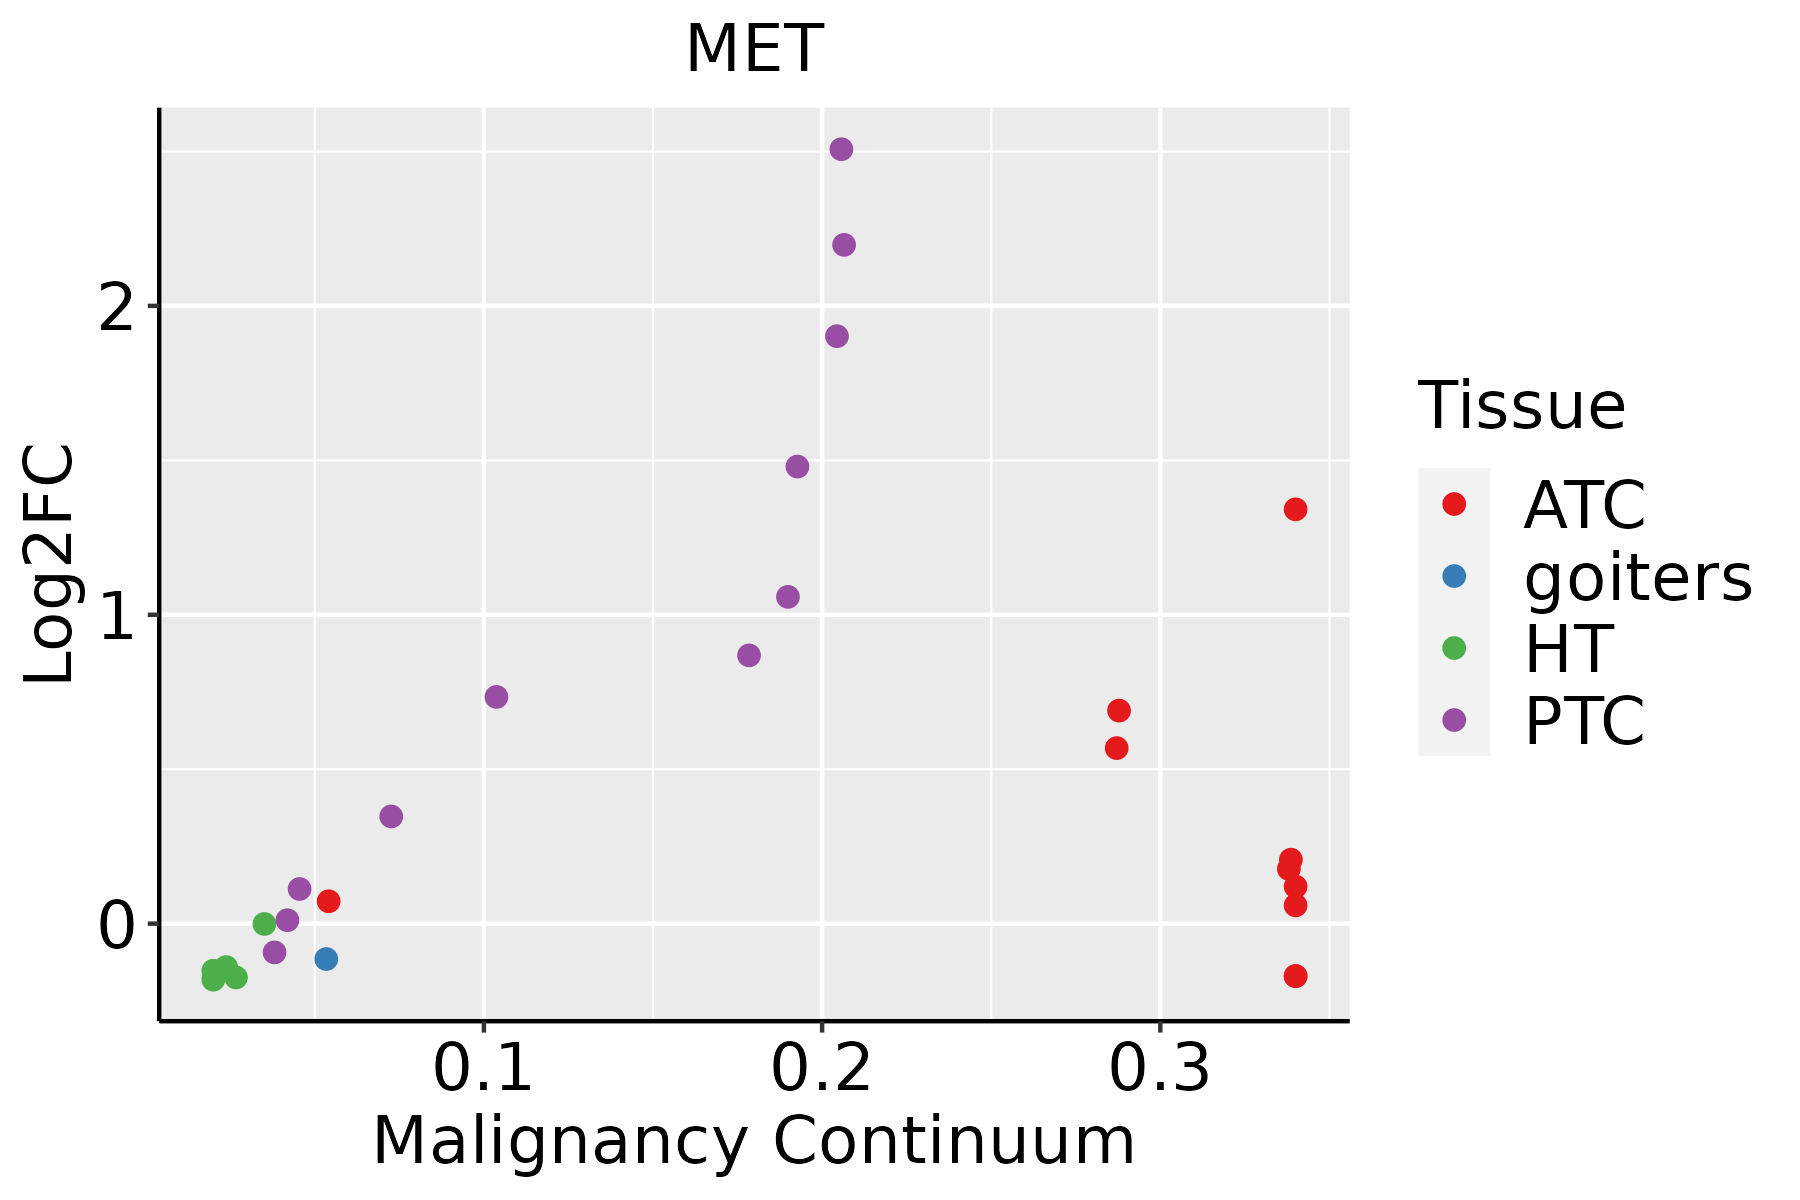 | ATC: Anaplastic thyroid cancer |
| HT: Hashimoto's thyroiditis | ||
| PTC: Papillary thyroid cancer |
| ∗log2FC in expression of this searched gene in stem-like cells from each diseased tissue sample relative to stem-like cells in normal samples in each tissue plotted against the malignancy continuum. Samples are colored based on if they are from different disease stage. |
Top |
Malignant transformation related pathway analysis |
| Find out the enriched GO biological processes and KEGG pathways involved in transition from healthy to precancer to cancer |
| Tissue | Disease Stage | Enriched GO biological Processes |
| Colorectum | AD |  |
| Colorectum | SER |  |
| Colorectum | MSS |  |
| Colorectum | MSI-H |  |
| Colorectum | FAP |  |
| ∗Top 15 enriched GO BP terms are showed in the bar plot of each disease state in each tissue. Each row represents a significant GO biological process which is colored according to the -log10(p.adjust). |
| Page: 1 2 3 4 5 6 7 8 9 |
| GO ID | Tissue | Disease Stage | Description | Gene Ratio | Bg Ratio | pvalue | p.adjust | Count |
| GO:00182123 | Oral cavity | OSCC | peptidyl-tyrosine modification | 180/7305 | 378/18723 | 3.63e-04 | 2.22e-03 | 180 |
| GO:000268310 | Oral cavity | OSCC | negative regulation of immune system process | 204/7305 | 434/18723 | 3.72e-04 | 2.27e-03 | 204 |
| GO:19021059 | Oral cavity | OSCC | regulation of leukocyte differentiation | 136/7305 | 279/18723 | 5.53e-04 | 3.21e-03 | 136 |
| GO:005087819 | Oral cavity | OSCC | regulation of body fluid levels | 179/7305 | 379/18723 | 6.19e-04 | 3.50e-03 | 179 |
| GO:00302175 | Oral cavity | OSCC | T cell differentiation | 126/7305 | 257/18723 | 6.51e-04 | 3.66e-03 | 126 |
| GO:00085934 | Oral cavity | OSCC | regulation of Notch signaling pathway | 53/7305 | 95/18723 | 6.64e-04 | 3.72e-03 | 53 |
| GO:0071482 | Oral cavity | OSCC | cellular response to light stimulus | 66/7305 | 123/18723 | 6.74e-04 | 3.77e-03 | 66 |
| GO:00181083 | Oral cavity | OSCC | peptidyl-tyrosine phosphorylation | 177/7305 | 375/18723 | 6.86e-04 | 3.83e-03 | 177 |
| GO:00090483 | Oral cavity | OSCC | dosage compensation by inactivation of X chromosome | 13/7305 | 16/18723 | 7.05e-04 | 3.89e-03 | 13 |
| GO:00064797 | Oral cavity | OSCC | protein methylation | 92/7305 | 181/18723 | 7.86e-04 | 4.26e-03 | 92 |
| GO:00082137 | Oral cavity | OSCC | protein alkylation | 92/7305 | 181/18723 | 7.86e-04 | 4.26e-03 | 92 |
| GO:004308710 | Oral cavity | OSCC | regulation of GTPase activity | 165/7305 | 348/18723 | 7.94e-04 | 4.27e-03 | 165 |
| GO:00519605 | Oral cavity | OSCC | regulation of nervous system development | 205/7305 | 443/18723 | 9.80e-04 | 5.11e-03 | 205 |
| GO:00071629 | Oral cavity | OSCC | negative regulation of cell adhesion | 145/7305 | 303/18723 | 9.95e-04 | 5.18e-03 | 145 |
| GO:00458244 | Oral cavity | OSCC | negative regulation of innate immune response | 41/7305 | 71/18723 | 1.05e-03 | 5.40e-03 | 41 |
| GO:00507774 | Oral cavity | OSCC | negative regulation of immune response | 97/7305 | 194/18723 | 1.16e-03 | 5.91e-03 | 97 |
| GO:000315816 | Oral cavity | OSCC | endothelium development | 71/7305 | 136/18723 | 1.18e-03 | 5.99e-03 | 71 |
| GO:0060339 | Oral cavity | OSCC | negative regulation of type I interferon-mediated signaling pathway | 15/7305 | 20/18723 | 1.19e-03 | 5.99e-03 | 15 |
| GO:003647319 | Oral cavity | OSCC | cell death in response to oxidative stress | 52/7305 | 95/18723 | 1.33e-03 | 6.62e-03 | 52 |
| GO:00350245 | Oral cavity | OSCC | negative regulation of Rho protein signal transduction | 16/7305 | 22/18723 | 1.40e-03 | 6.79e-03 | 16 |
| Page: 1 2 3 4 5 6 7 8 9 10 11 12 13 14 15 16 17 18 19 20 21 22 23 24 25 26 27 28 29 30 31 32 33 34 35 36 37 38 39 40 41 42 43 44 45 46 47 48 49 50 51 52 53 54 55 56 57 58 59 60 61 62 63 64 65 66 67 68 69 70 71 72 73 74 75 76 77 78 79 80 81 82 83 84 85 86 87 88 89 90 91 92 93 94 95 96 97 98 99 100 101 |
| Pathway ID | Tissue | Disease Stage | Description | Gene Ratio | Bg Ratio | pvalue | p.adjust | qvalue | Count |
| hsa05208 | Colorectum | AD | Chemical carcinogenesis - reactive oxygen species | 126/2092 | 223/8465 | 1.01e-24 | 1.68e-22 | 1.07e-22 | 126 |
| hsa05100 | Colorectum | AD | Bacterial invasion of epithelial cells | 44/2092 | 77/8465 | 1.13e-09 | 2.22e-08 | 1.42e-08 | 44 |
| hsa04520 | Colorectum | AD | Adherens junction | 50/2092 | 93/8465 | 1.52e-09 | 2.83e-08 | 1.81e-08 | 50 |
| hsa05230 | Colorectum | AD | Central carbon metabolism in cancer | 33/2092 | 70/8465 | 3.61e-05 | 3.19e-04 | 2.03e-04 | 33 |
| hsa05205 | Colorectum | AD | Proteoglycans in cancer | 70/2092 | 205/8465 | 1.37e-03 | 8.46e-03 | 5.39e-03 | 70 |
| hsa05225 | Colorectum | AD | Hepatocellular carcinoma | 59/2092 | 168/8465 | 1.50e-03 | 8.69e-03 | 5.54e-03 | 59 |
| hsa04015 | Colorectum | AD | Rap1 signaling pathway | 71/2092 | 210/8465 | 1.72e-03 | 9.68e-03 | 6.18e-03 | 71 |
| hsa05211 | Colorectum | AD | Renal cell carcinoma | 28/2092 | 69/8465 | 2.58e-03 | 1.37e-02 | 8.75e-03 | 28 |
| hsa04360 | Colorectum | AD | Axon guidance | 61/2092 | 182/8465 | 4.36e-03 | 2.17e-02 | 1.38e-02 | 61 |
| hsa04510 | Colorectum | AD | Focal adhesion | 67/2092 | 203/8465 | 4.40e-03 | 2.17e-02 | 1.38e-02 | 67 |
| hsa01521 | Colorectum | AD | EGFR tyrosine kinase inhibitor resistance | 29/2092 | 79/8465 | 1.15e-02 | 4.24e-02 | 2.71e-02 | 29 |
| hsa052081 | Colorectum | AD | Chemical carcinogenesis - reactive oxygen species | 126/2092 | 223/8465 | 1.01e-24 | 1.68e-22 | 1.07e-22 | 126 |
| hsa051001 | Colorectum | AD | Bacterial invasion of epithelial cells | 44/2092 | 77/8465 | 1.13e-09 | 2.22e-08 | 1.42e-08 | 44 |
| hsa045201 | Colorectum | AD | Adherens junction | 50/2092 | 93/8465 | 1.52e-09 | 2.83e-08 | 1.81e-08 | 50 |
| hsa052301 | Colorectum | AD | Central carbon metabolism in cancer | 33/2092 | 70/8465 | 3.61e-05 | 3.19e-04 | 2.03e-04 | 33 |
| hsa052051 | Colorectum | AD | Proteoglycans in cancer | 70/2092 | 205/8465 | 1.37e-03 | 8.46e-03 | 5.39e-03 | 70 |
| hsa052251 | Colorectum | AD | Hepatocellular carcinoma | 59/2092 | 168/8465 | 1.50e-03 | 8.69e-03 | 5.54e-03 | 59 |
| hsa040151 | Colorectum | AD | Rap1 signaling pathway | 71/2092 | 210/8465 | 1.72e-03 | 9.68e-03 | 6.18e-03 | 71 |
| hsa052111 | Colorectum | AD | Renal cell carcinoma | 28/2092 | 69/8465 | 2.58e-03 | 1.37e-02 | 8.75e-03 | 28 |
| hsa043601 | Colorectum | AD | Axon guidance | 61/2092 | 182/8465 | 4.36e-03 | 2.17e-02 | 1.38e-02 | 61 |
| Page: 1 2 3 4 5 6 7 8 9 10 11 12 13 14 15 16 17 |
Top |
Cell-cell communication analysis |
| Identification of potential cell-cell interactions between two cell types and their ligand-receptor pairs for different disease states |
| Ligand | Receptor | LRpair | Pathway | Tissue | Disease Stage |
| HGF | MET | HGF_MET | HGF | Breast | Healthy |
| HGF | MET | HGF_MET | HGF | Cervix | Precancer |
| HGF | MET | HGF_MET | HGF | Endometrium | EEC |
| HGF | MET | HGF_MET | HGF | Liver | HCC |
| HGF | MET | HGF_MET | HGF | Liver | Healthy |
| HGF | MET | HGF_MET | HGF | Liver | Precancer |
| HGF | MET | HGF_MET | HGF | Lung | IAC |
| HGF | MET | HGF_MET | HGF | Prostate | BPH |
| HGF | MET | HGF_MET | HGF | Prostate | Healthy |
| HGF | MET | HGF_MET | HGF | THCA | Cancer |
| Page: 1 |
Top |
Single-cell gene regulatory network inference analysis |
| Find out the significant the regulons (TFs) and the target genes of each regulon across cell types for different disease states |
| TF | Cell Type | Tissue | Disease Stage | Target Gene | RSS | Regulon Activity |
| ∗The dot plots of a searched regulon are shown for all cell subpopulations in each disease state of each tissue based on the regulon specific score inferred using pySCENIC and by calculating the average expression. |
| Page: 1 |
Top |
Somatic mutation of malignant transformation related genes |
| Annotation of somatic variants for genes involved in malignant transformation |
| Hugo Symbol | Variant Class | Variant Classification | dbSNP RS | HGVSc | HGVSp | HGVSp Short | SWISSPROT | BIOTYPE | SIFT | PolyPhen | Tumor Sample Barcode | Tissue | Histology | Sex | Age | Stage | Therapy Types | Drugs | Outcome |
| MET | SNV | Missense_Mutation | c.1695N>G | p.Ile565Met | p.I565M | P08581 | protein_coding | deleterious(0) | possibly_damaging(0.831) | TCGA-A2-A0YH-01 | Breast | breast invasive carcinoma | Female | <65 | III/IV | Chemotherapy | adriamycin | SD | |
| MET | SNV | Missense_Mutation | c.674G>A | p.Gly225Asp | p.G225D | P08581 | protein_coding | deleterious(0) | probably_damaging(1) | TCGA-A8-A06X-01 | Breast | breast invasive carcinoma | Female | >=65 | I/II | Unknown | Unknown | SD | |
| MET | SNV | Missense_Mutation | c.2975N>C | p.Arg992Thr | p.R992T | P08581 | protein_coding | deleterious(0.01) | probably_damaging(0.999) | TCGA-AC-A23H-01 | Breast | breast invasive carcinoma | Female | >=65 | I/II | Unknown | Unknown | PD | |
| MET | SNV | Missense_Mutation | c.1454N>T | p.Pro485Leu | p.P485L | P08581 | protein_coding | tolerated(0.07) | benign(0.059) | TCGA-AN-A0AK-01 | Breast | breast invasive carcinoma | Female | >=65 | I/II | Unknown | Unknown | SD | |
| MET | SNV | Missense_Mutation | c.2389G>A | p.Val797Met | p.V797M | P08581 | protein_coding | tolerated(0.06) | possibly_damaging(0.751) | TCGA-AR-A24K-01 | Breast | breast invasive carcinoma | Female | <65 | I/II | Unspecific | Paclitaxel | SD | |
| MET | SNV | Missense_Mutation | c.2489N>T | p.Gln830Leu | p.Q830L | P08581 | protein_coding | tolerated(0.17) | benign(0.1) | TCGA-B6-A0RS-01 | Breast | breast invasive carcinoma | Female | <65 | I/II | Unknown | Unknown | PD | |
| MET | SNV | Missense_Mutation | novel | c.1121N>A | p.Phe374Tyr | p.F374Y | P08581 | protein_coding | tolerated(0.09) | probably_damaging(0.941) | TCGA-BH-A0HX-01 | Breast | breast invasive carcinoma | Female | <65 | I/II | Chemotherapy | adrimycin | SD |
| MET | SNV | Missense_Mutation | c.1234C>G | p.Arg412Gly | p.R412G | P08581 | protein_coding | tolerated(0.15) | benign(0.007) | TCGA-BH-A0W4-01 | Breast | breast invasive carcinoma | Female | <65 | I/II | Unknown | Unknown | SD | |
| MET | SNV | Missense_Mutation | rs540540827 | c.1240G>A | p.Asp414Asn | p.D414N | P08581 | protein_coding | tolerated(0.21) | possibly_damaging(0.466) | TCGA-EW-A1J5-01 | Breast | breast invasive carcinoma | Female | <65 | I/II | Chemotherapy | adriamycin | SD |
| MET | insertion | Frame_Shift_Ins | novel | c.3287_3288insTT | p.His1097CysfsTer7 | p.H1097Cfs*7 | P08581 | protein_coding | TCGA-A8-A0A1-01 | Breast | breast invasive carcinoma | Female | >=65 | I/II | Hormone Therapy | tamoxiphen | SD |
| Page: 1 2 3 4 5 6 7 8 9 10 11 12 13 |
Top |
Related drugs of malignant transformation related genes |
| Identification of chemicals and drugs interact with genes involved in malignant transfromation |
| (DGIdb 4.0) |
| Entrez ID | Symbol | Category | Interaction Types | Drug Claim Name | Drug Name | PMIDs |
| 4233 | MET | KINASE, TYROSINE KINASE, DRUGGABLE GENOME, CLINICALLY ACTIONABLE, CELL SURFACE, DRUG RESISTANCE | CBT-101 | |||
| 4233 | MET | KINASE, TYROSINE KINASE, DRUGGABLE GENOME, CLINICALLY ACTIONABLE, CELL SURFACE, DRUG RESISTANCE | inhibitor | 252166505 | TEPOTINIB | |
| 4233 | MET | KINASE, TYROSINE KINASE, DRUGGABLE GENOME, CLINICALLY ACTIONABLE, CELL SURFACE, DRUG RESISTANCE | inhibitor | 384403668 | ||
| 4233 | MET | KINASE, TYROSINE KINASE, DRUGGABLE GENOME, CLINICALLY ACTIONABLE, CELL SURFACE, DRUG RESISTANCE | Ficlatuzumab | FICLATUZUMAB | 24901237 | |
| 4233 | MET | KINASE, TYROSINE KINASE, DRUGGABLE GENOME, CLINICALLY ACTIONABLE, CELL SURFACE, DRUG RESISTANCE | inhibitor | CHEMBL2103851 | AMUVATINIB | |
| 4233 | MET | KINASE, TYROSINE KINASE, DRUGGABLE GENOME, CLINICALLY ACTIONABLE, CELL SURFACE, DRUG RESISTANCE | inhibitor | ARQ 197 | ||
| 4233 | MET | KINASE, TYROSINE KINASE, DRUGGABLE GENOME, CLINICALLY ACTIONABLE, CELL SURFACE, DRUG RESISTANCE | ENTRECTINIB | ENTRECTINIB | ||
| 4233 | MET | KINASE, TYROSINE KINASE, DRUGGABLE GENOME, CLINICALLY ACTIONABLE, CELL SURFACE, DRUG RESISTANCE | Imatinib | IMATINIB | 28514312 | |
| 4233 | MET | KINASE, TYROSINE KINASE, DRUGGABLE GENOME, CLINICALLY ACTIONABLE, CELL SURFACE, DRUG RESISTANCE | TEPOTINIB | TEPOTINIB | 32469185,24061647 | |
| 4233 | MET | KINASE, TYROSINE KINASE, DRUGGABLE GENOME, CLINICALLY ACTIONABLE, CELL SURFACE, DRUG RESISTANCE | PALBOCICLIB | PALBOCICLIB |
| Page: 1 2 3 4 5 6 7 8 9 10 11 12 13 14 15 16 17 18 19 20 21 22 23 24 25 26 27 28 29 30 31 |

Copyright 2023-Present -The University of Texas Health Science Center at Houston |