| Tissue | Expression Dynamics | Abbreviation |
| Colorectum (GSE201348) |  | FAP: Familial adenomatous polyposis |
| CRC: Colorectal cancer |
| Colorectum (HTA11) |  | AD: Adenomas |
| SER: Sessile serrated lesions |
| MSI-H: Microsatellite-high colorectal cancer |
| MSS: Microsatellite stable colorectal cancer |
| Esophagus | 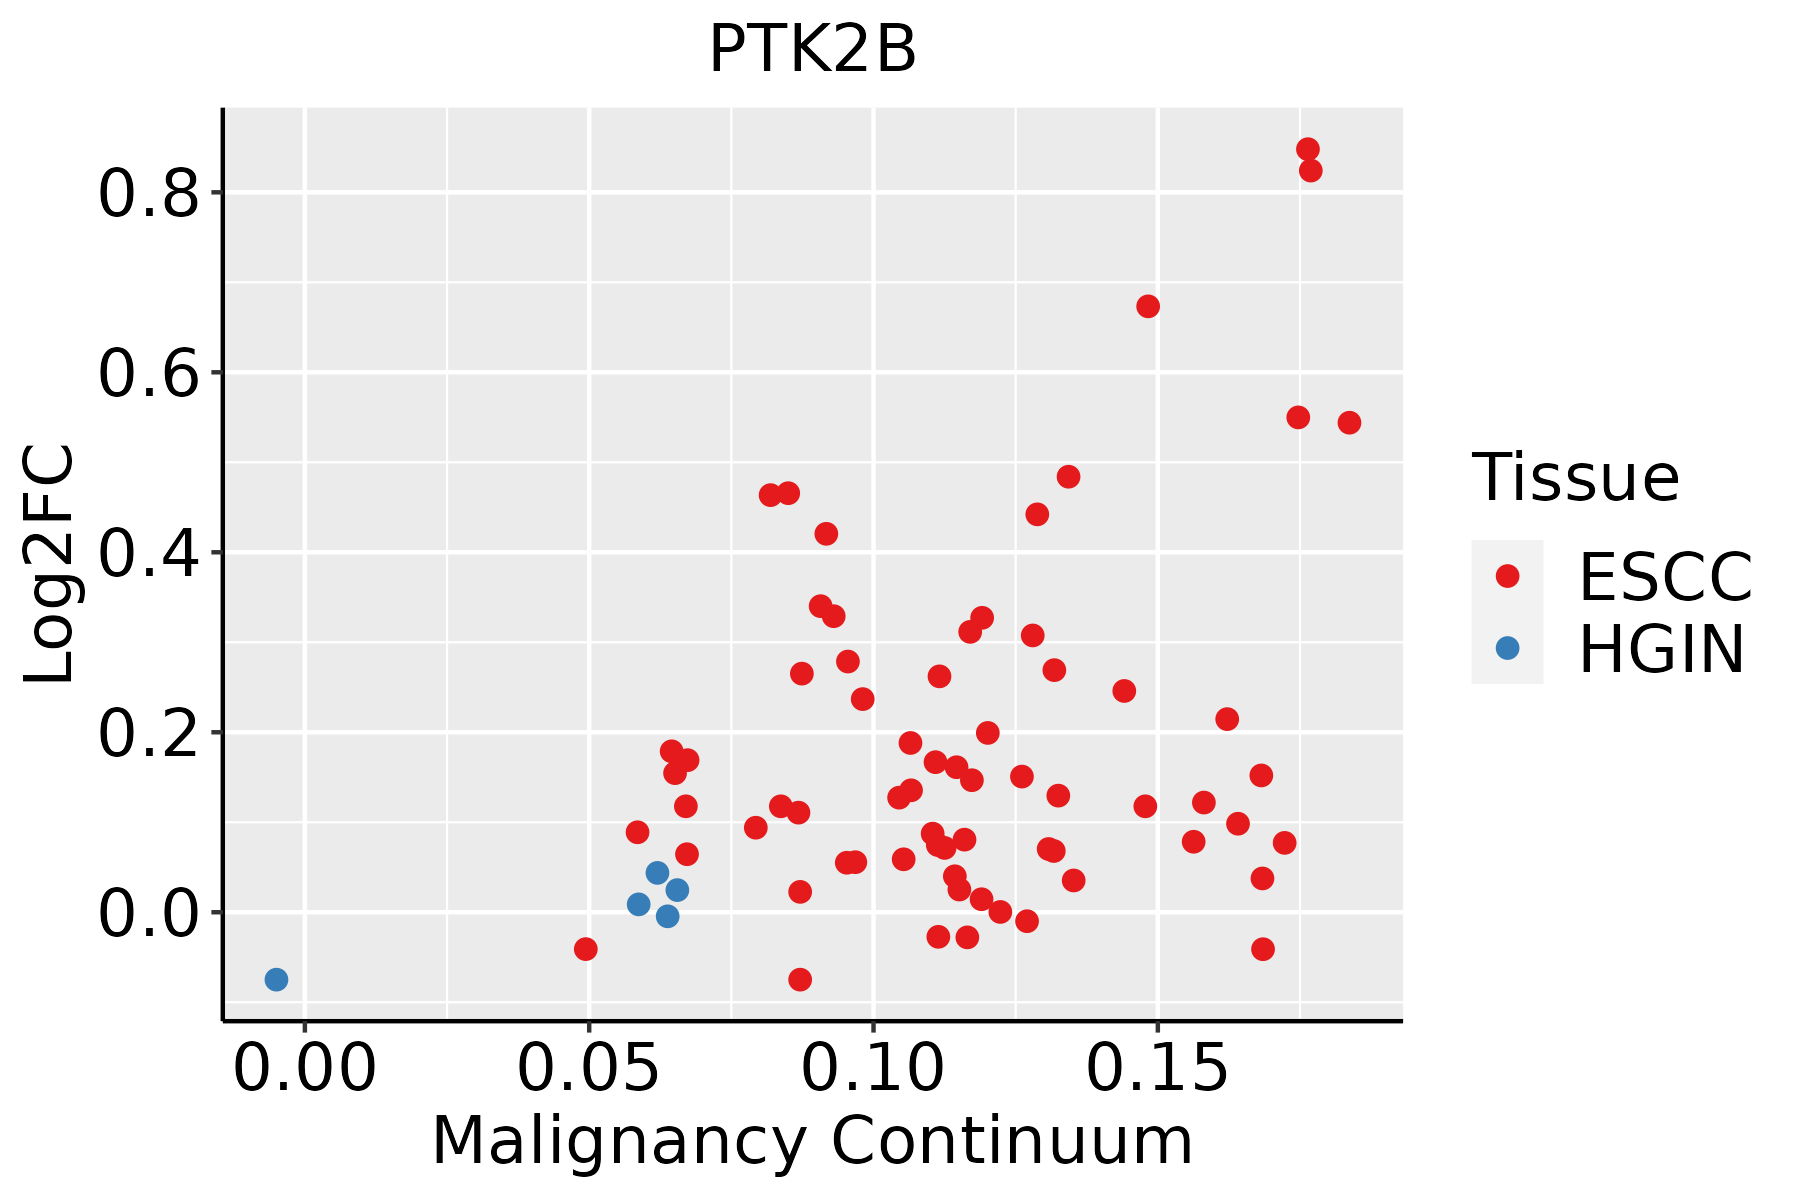 | ESCC: Esophageal squamous cell carcinoma |
| HGIN: High-grade intraepithelial neoplasias |
| LGIN: Low-grade intraepithelial neoplasias |
| Liver | 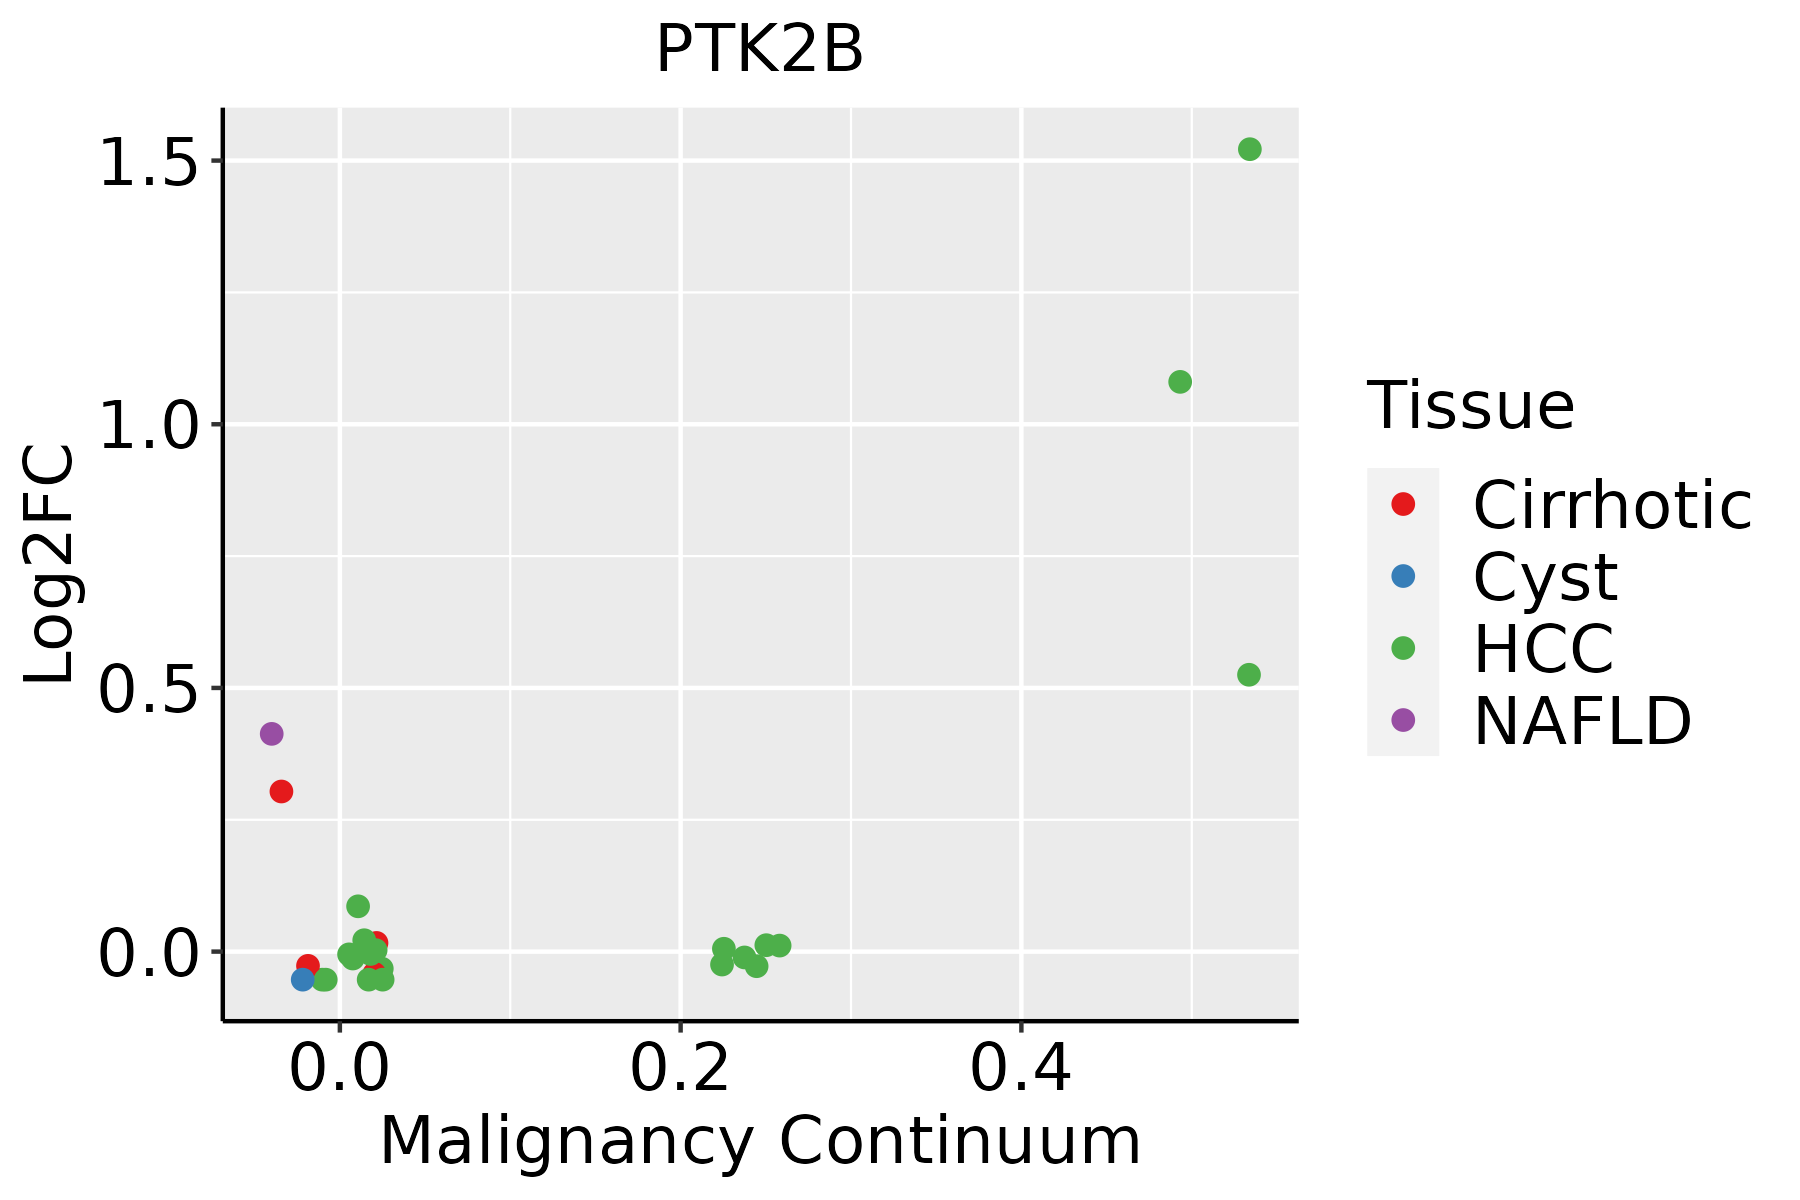 | HCC: Hepatocellular carcinoma |
| NAFLD: Non-alcoholic fatty liver disease |
| Oral Cavity | 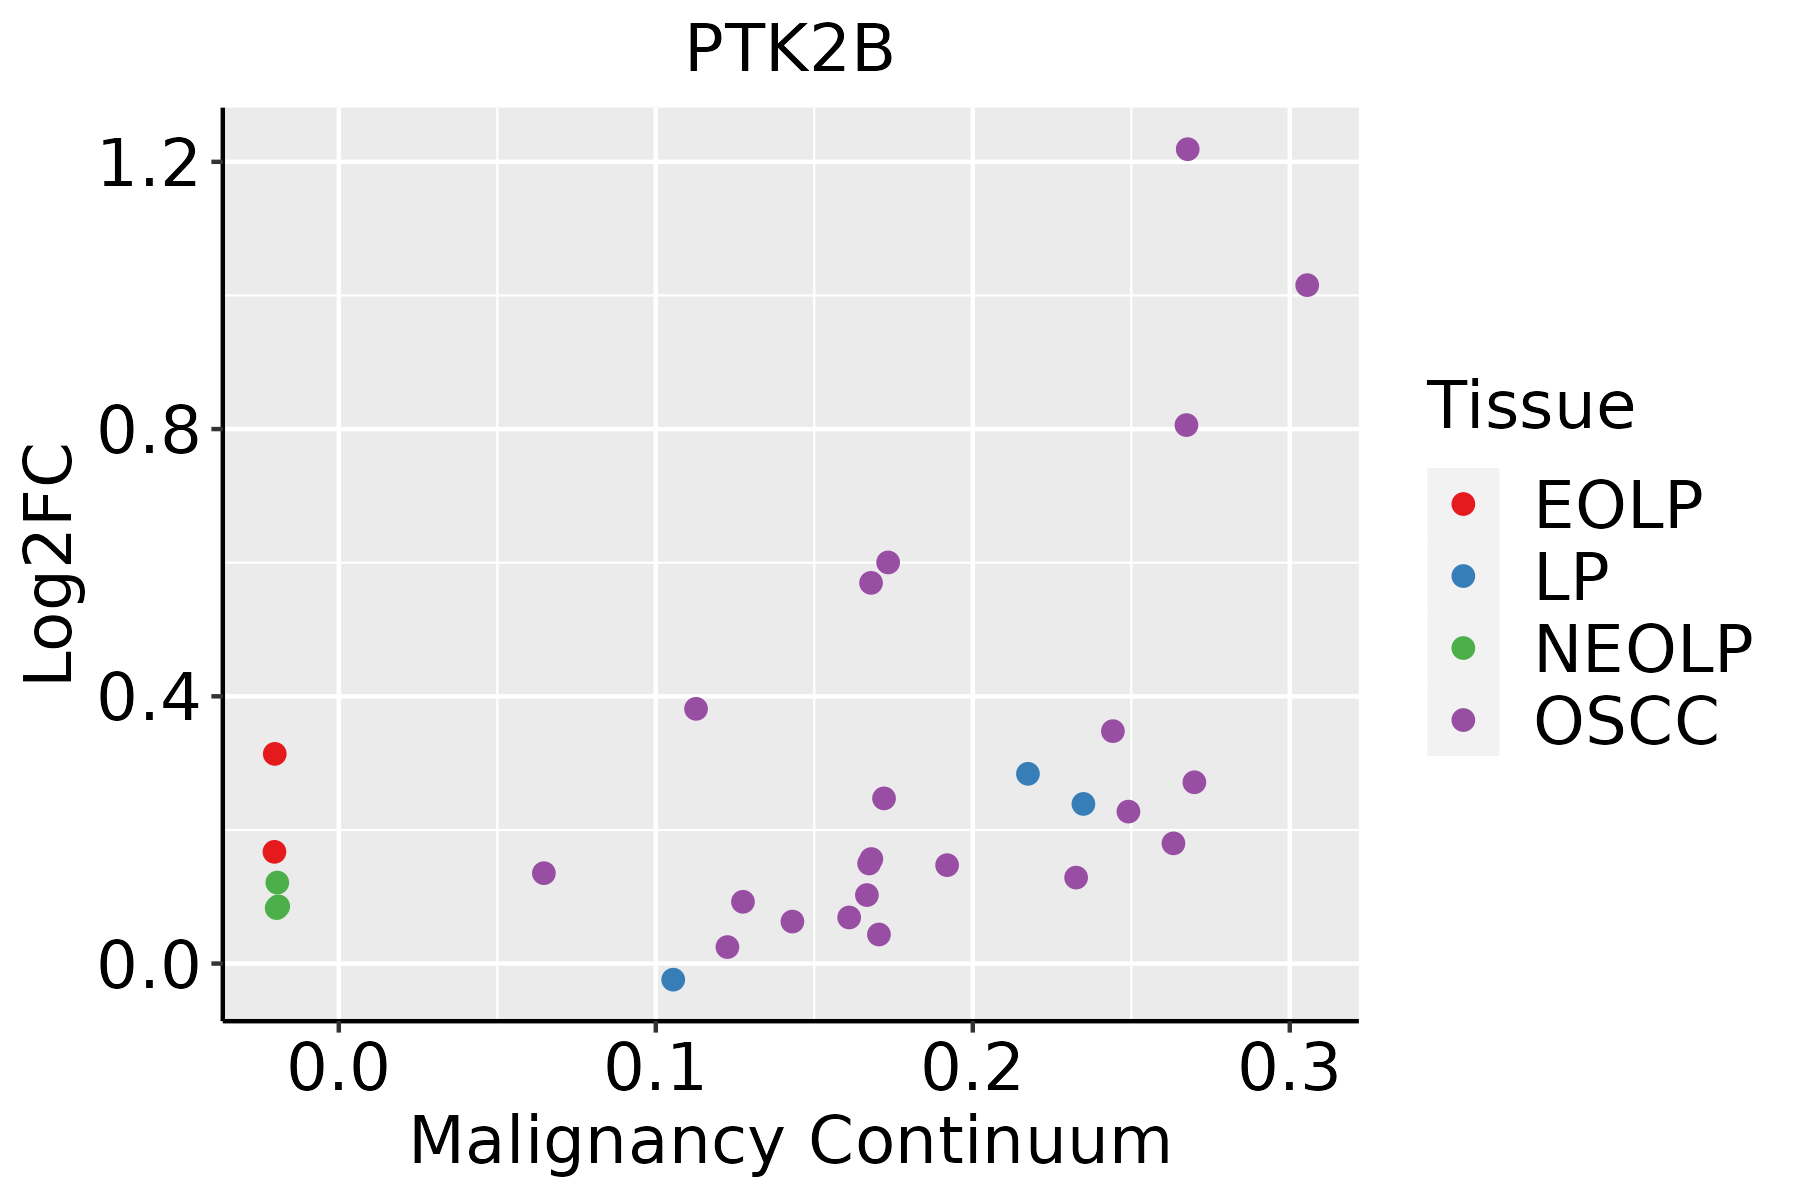 | EOLP: Erosive Oral lichen planus |
| LP: leukoplakia |
| NEOLP: Non-erosive oral lichen planus |
| OSCC: Oral squamous cell carcinoma |
| Prostate | 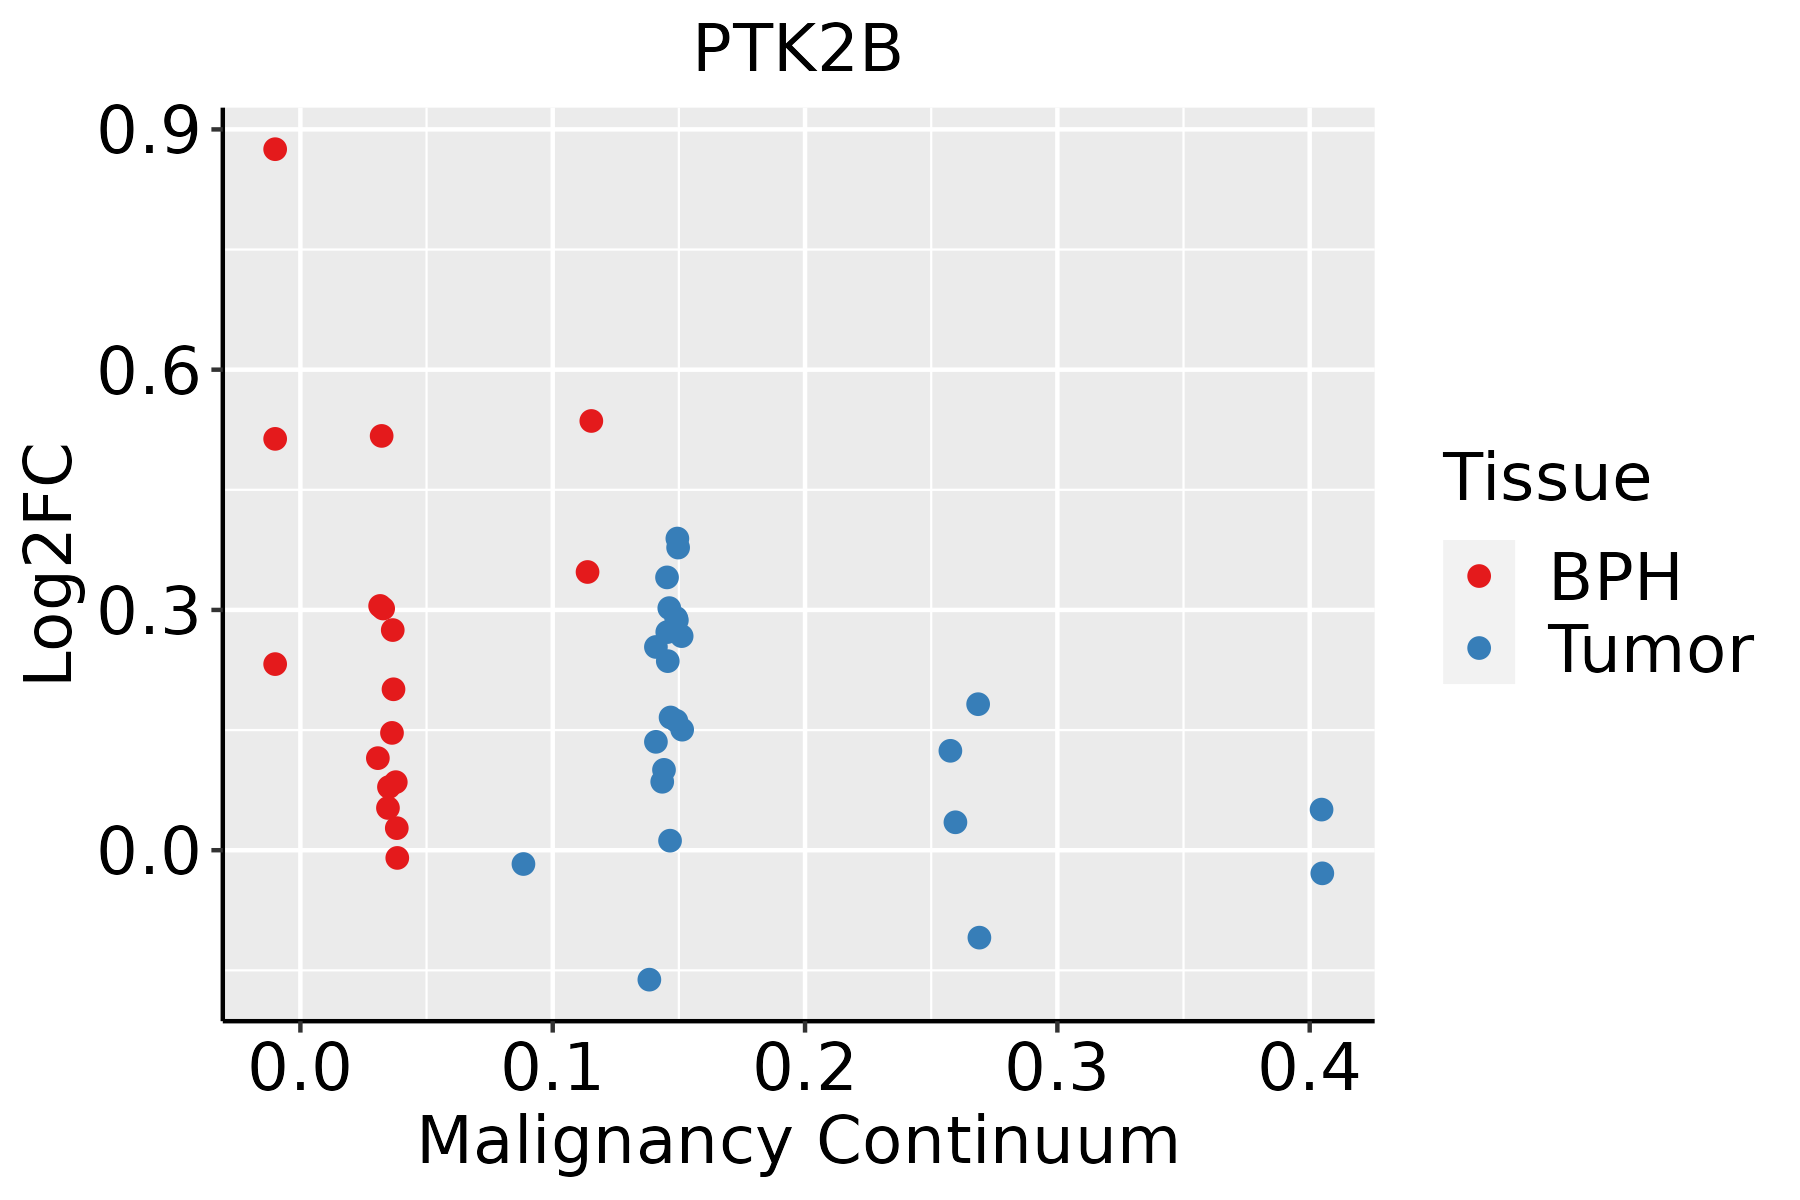 | BPH: Benign Prostatic Hyperplasia |
| Thyroid | 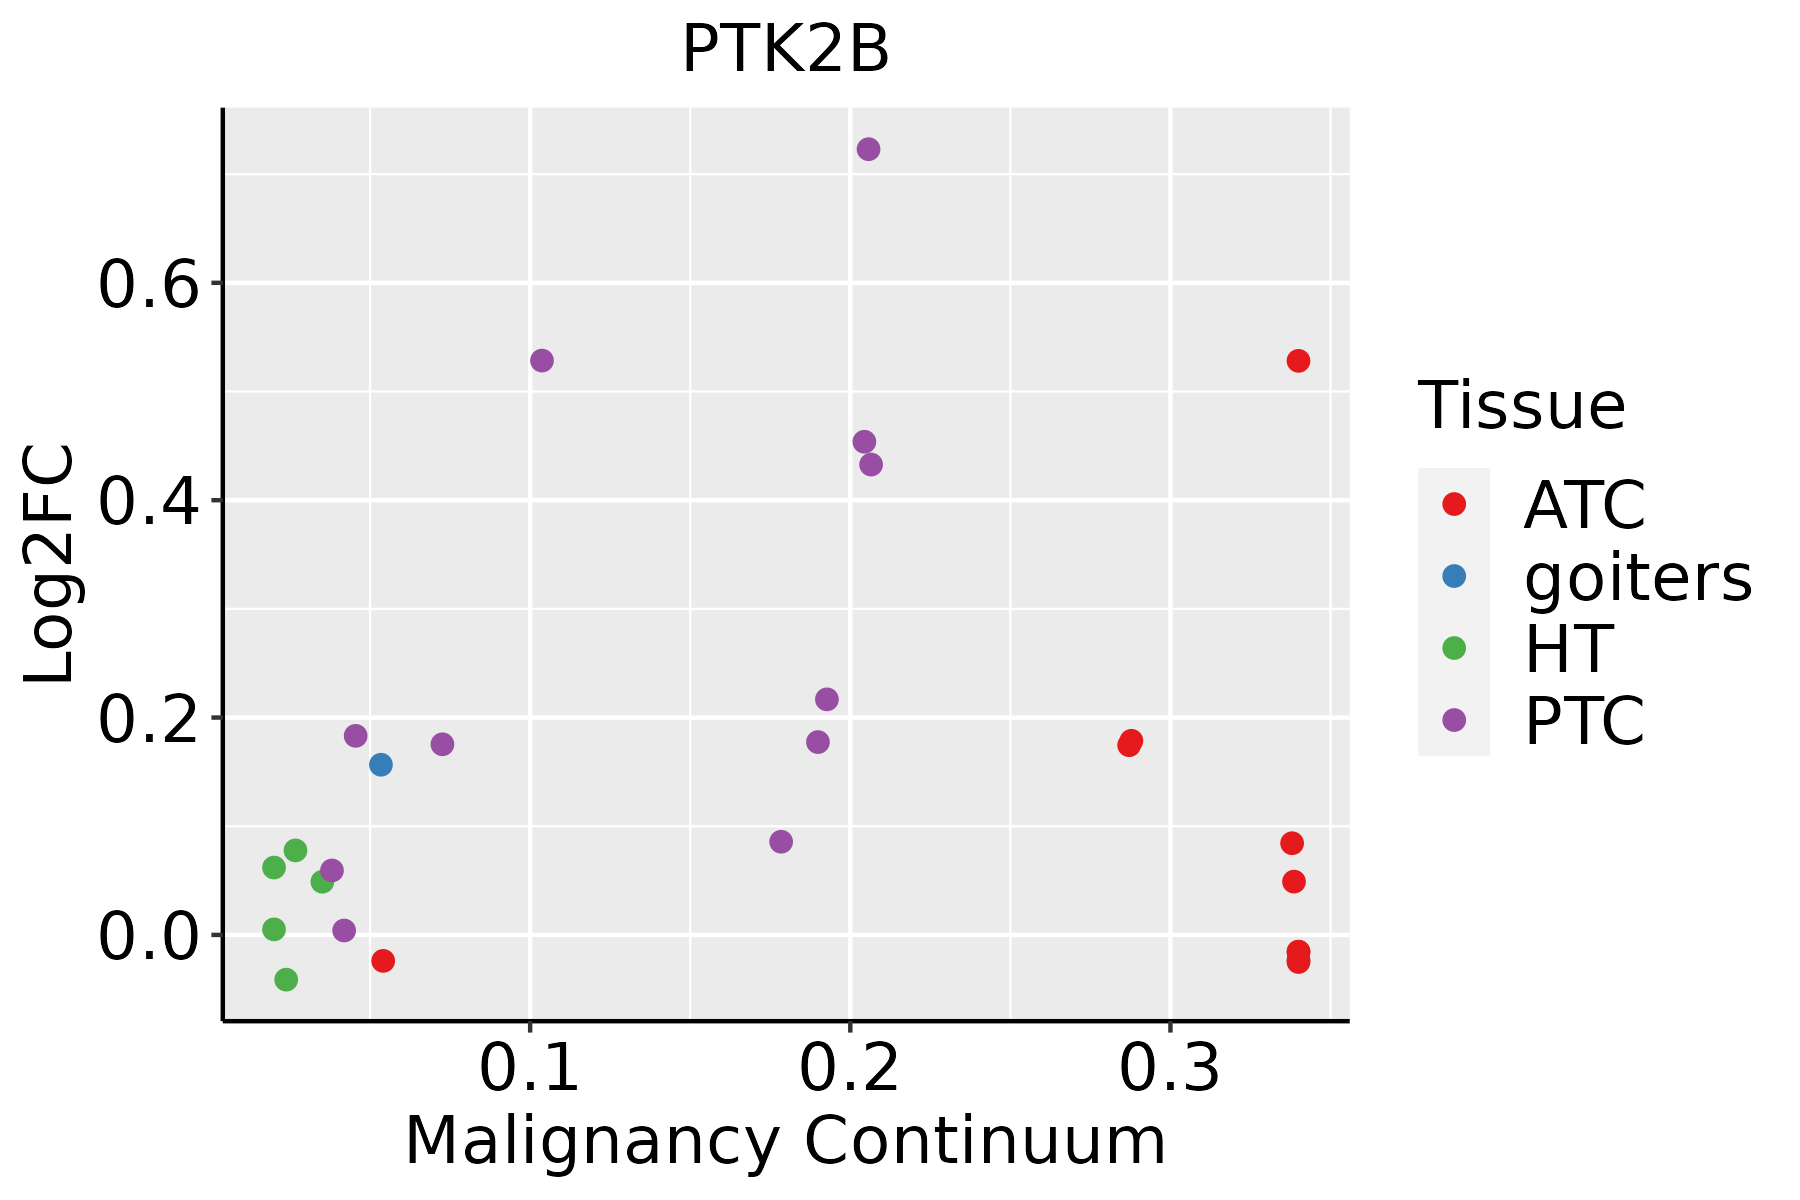 | ATC: Anaplastic thyroid cancer |
| HT: Hashimoto's thyroiditis |
| PTC: Papillary thyroid cancer |
| GO ID | Tissue | Disease Stage | Description | Gene Ratio | Bg Ratio | pvalue | p.adjust | Count |
| GO:003030711 | Liver | HCC | positive regulation of cell growth | 88/7958 | 166/18723 | 3.95e-03 | 1.74e-02 | 88 |
| GO:003153212 | Liver | HCC | actin cytoskeleton reorganization | 59/7958 | 107/18723 | 5.57e-03 | 2.32e-02 | 59 |
| GO:00321471 | Liver | HCC | activation of protein kinase activity | 72/7958 | 134/18723 | 5.61e-03 | 2.33e-02 | 72 |
| GO:00432791 | Liver | HCC | response to alkaloid | 62/7958 | 115/18723 | 8.79e-03 | 3.42e-02 | 62 |
| GO:007135611 | Liver | HCC | cellular response to tumor necrosis factor | 115/7958 | 229/18723 | 1.08e-02 | 3.99e-02 | 115 |
| GO:00420631 | Liver | HCC | gliogenesis | 148/7958 | 301/18723 | 1.10e-02 | 4.07e-02 | 148 |
| GO:00454712 | Liver | HCC | response to ethanol | 72/7958 | 137/18723 | 1.10e-02 | 4.07e-02 | 72 |
| GO:190440712 | Liver | HCC | positive regulation of nitric oxide metabolic process | 25/7958 | 41/18723 | 1.31e-02 | 4.69e-02 | 25 |
| GO:000166721 | Liver | HCC | ameboidal-type cell migration | 226/7958 | 475/18723 | 1.35e-02 | 4.81e-02 | 226 |
| GO:004592711 | Liver | HCC | positive regulation of growth | 128/7958 | 259/18723 | 1.41e-02 | 4.99e-02 | 128 |
| GO:000989620 | Oral cavity | OSCC | positive regulation of catabolic process | 307/7305 | 492/18723 | 2.29e-26 | 7.64e-24 | 307 |
| GO:003133120 | Oral cavity | OSCC | positive regulation of cellular catabolic process | 273/7305 | 427/18723 | 6.39e-26 | 2.02e-23 | 273 |
| GO:004217620 | Oral cavity | OSCC | regulation of protein catabolic process | 254/7305 | 391/18723 | 1.07e-25 | 3.22e-23 | 254 |
| GO:004586220 | Oral cavity | OSCC | positive regulation of proteolysis | 236/7305 | 372/18723 | 6.53e-22 | 1.38e-19 | 236 |
| GO:000697920 | Oral cavity | OSCC | response to oxidative stress | 273/7305 | 446/18723 | 8.35e-22 | 1.65e-19 | 273 |
| GO:190336220 | Oral cavity | OSCC | regulation of cellular protein catabolic process | 174/7305 | 255/18723 | 2.04e-21 | 3.70e-19 | 174 |
| GO:190305020 | Oral cavity | OSCC | regulation of proteolysis involved in cellular protein catabolic process | 152/7305 | 221/18723 | 2.16e-19 | 3.15e-17 | 152 |
| GO:004325420 | Oral cavity | OSCC | regulation of protein-containing complex assembly | 255/7305 | 428/18723 | 2.94e-18 | 3.15e-16 | 255 |
| GO:000641720 | Oral cavity | OSCC | regulation of translation | 274/7305 | 468/18723 | 4.39e-18 | 4.63e-16 | 274 |
| GO:200005820 | Oral cavity | OSCC | regulation of ubiquitin-dependent protein catabolic process | 118/7305 | 164/18723 | 9.37e-18 | 9.27e-16 | 118 |
| Pathway ID | Tissue | Disease Stage | Description | Gene Ratio | Bg Ratio | pvalue | p.adjust | qvalue | Count |
| hsa05135 | Colorectum | AD | Yersinia infection | 58/2092 | 137/8465 | 3.90e-06 | 4.35e-05 | 2.78e-05 | 58 |
| hsa05170 | Colorectum | AD | Human immunodeficiency virus 1 infection | 72/2092 | 212/8465 | 1.40e-03 | 8.46e-03 | 5.39e-03 | 72 |
| hsa05163 | Colorectum | AD | Human cytomegalovirus infection | 75/2092 | 225/8465 | 2.00e-03 | 1.10e-02 | 7.01e-03 | 75 |
| hsa051351 | Colorectum | AD | Yersinia infection | 58/2092 | 137/8465 | 3.90e-06 | 4.35e-05 | 2.78e-05 | 58 |
| hsa051701 | Colorectum | AD | Human immunodeficiency virus 1 infection | 72/2092 | 212/8465 | 1.40e-03 | 8.46e-03 | 5.39e-03 | 72 |
| hsa051631 | Colorectum | AD | Human cytomegalovirus infection | 75/2092 | 225/8465 | 2.00e-03 | 1.10e-02 | 7.01e-03 | 75 |
| hsa051352 | Colorectum | SER | Yersinia infection | 43/1580 | 137/8465 | 2.15e-04 | 2.10e-03 | 1.52e-03 | 43 |
| hsa046702 | Colorectum | SER | Leukocyte transendothelial migration | 37/1580 | 114/8465 | 2.77e-04 | 2.56e-03 | 1.86e-03 | 37 |
| hsa051702 | Colorectum | SER | Human immunodeficiency virus 1 infection | 58/1580 | 212/8465 | 1.08e-03 | 8.56e-03 | 6.21e-03 | 58 |
| hsa051632 | Colorectum | SER | Human cytomegalovirus infection | 57/1580 | 225/8465 | 7.40e-03 | 3.84e-02 | 2.79e-02 | 57 |
| hsa049122 | Colorectum | SER | GnRH signaling pathway | 27/1580 | 93/8465 | 9.68e-03 | 4.72e-02 | 3.43e-02 | 27 |
| hsa051353 | Colorectum | SER | Yersinia infection | 43/1580 | 137/8465 | 2.15e-04 | 2.10e-03 | 1.52e-03 | 43 |
| hsa046703 | Colorectum | SER | Leukocyte transendothelial migration | 37/1580 | 114/8465 | 2.77e-04 | 2.56e-03 | 1.86e-03 | 37 |
| hsa051703 | Colorectum | SER | Human immunodeficiency virus 1 infection | 58/1580 | 212/8465 | 1.08e-03 | 8.56e-03 | 6.21e-03 | 58 |
| hsa051633 | Colorectum | SER | Human cytomegalovirus infection | 57/1580 | 225/8465 | 7.40e-03 | 3.84e-02 | 2.79e-02 | 57 |
| hsa049123 | Colorectum | SER | GnRH signaling pathway | 27/1580 | 93/8465 | 9.68e-03 | 4.72e-02 | 3.43e-02 | 27 |
| hsa051356 | Colorectum | FAP | Yersinia infection | 43/1404 | 137/8465 | 1.21e-05 | 1.62e-04 | 9.86e-05 | 43 |
| hsa046706 | Colorectum | FAP | Leukocyte transendothelial migration | 37/1404 | 114/8465 | 2.12e-05 | 2.53e-04 | 1.54e-04 | 37 |
| hsa049126 | Colorectum | FAP | GnRH signaling pathway | 28/1404 | 93/8465 | 8.16e-04 | 5.14e-03 | 3.13e-03 | 28 |
| hsa051636 | Colorectum | FAP | Human cytomegalovirus infection | 55/1404 | 225/8465 | 1.42e-03 | 7.67e-03 | 4.67e-03 | 55 |
| Hugo Symbol | Variant Class | Variant Classification | dbSNP RS | HGVSc | HGVSp | HGVSp Short | SWISSPROT | BIOTYPE | SIFT | PolyPhen | Tumor Sample Barcode | Tissue | Histology | Sex | Age | Stage | Therapy Types | Drugs | Outcome |
| PTK2B | SNV | Missense_Mutation | | c.2871N>A | p.Met957Ile | p.M957I | Q14289 | protein_coding | deleterious(0) | probably_damaging(0.999) | TCGA-A2-A0T2-01 | Breast | breast invasive carcinoma | Female | >=65 | III/IV | Chemotherapy | xeloda | PD |
| PTK2B | SNV | Missense_Mutation | rs750561555 | c.553N>T | p.Arg185Trp | p.R185W | Q14289 | protein_coding | deleterious(0) | probably_damaging(0.999) | TCGA-A2-A3XS-01 | Breast | breast invasive carcinoma | Female | <65 | III/IV | Chemotherapy | cytoxan | PD |
| PTK2B | SNV | Missense_Mutation | | c.973N>C | p.Glu325Gln | p.E325Q | Q14289 | protein_coding | tolerated(0.24) | benign(0.044) | TCGA-AC-A23H-01 | Breast | breast invasive carcinoma | Female | >=65 | I/II | Unknown | Unknown | PD |
| PTK2B | SNV | Missense_Mutation | | c.1817G>T | p.Ser606Ile | p.S606I | Q14289 | protein_coding | deleterious(0) | probably_damaging(1) | TCGA-BH-A18G-01 | Breast | breast invasive carcinoma | Female | >=65 | I/II | Unknown | Unknown | SD |
| PTK2B | SNV | Missense_Mutation | | c.1681N>C | p.Glu561Gln | p.E561Q | Q14289 | protein_coding | tolerated(0.06) | benign(0.006) | TCGA-C8-A12T-01 | Breast | breast invasive carcinoma | Female | <65 | I/II | Unknown | Unknown | SD |
| PTK2B | insertion | In_Frame_Ins | novel | c.2331_2332insCGGTGTCCCATGGTCCTATATTTGTTCTCAAGGAAATGCCTG | p.His777_Ser778insArgCysProMetValLeuTyrLeuPheSerArgLysCysLeu | p.H777_S778insRCPMVLYLFSRKCL | Q14289 | protein_coding | | | TCGA-B6-A0RG-01 | Breast | breast invasive carcinoma | Female | <65 | I/II | Unknown | Unknown | SD |
| PTK2B | insertion | Frame_Shift_Ins | novel | c.789_790insGTCATAGATC | p.Thr264ValfsTer8 | p.T264Vfs*8 | Q14289 | protein_coding | | | TCGA-BH-A0H7-01 | Breast | breast invasive carcinoma | Female | >=65 | III/IV | Chemotherapy | doxorubicin | SD |
| PTK2B | insertion | Frame_Shift_Ins | novel | c.2148_2148+1insGTAAGCCAAGCCATGT | p.Pro717ValfsTer10 | p.P717Vfs*10 | Q14289 | protein_coding | | | TCGA-GM-A2D9-01 | Breast | breast invasive carcinoma | Female | >=65 | I/II | Hormone Therapy | arimidex | SD |
| PTK2B | SNV | Missense_Mutation | novel | c.1757G>A | p.Arg586His | p.R586H | Q14289 | protein_coding | deleterious(0) | possibly_damaging(0.854) | TCGA-EA-A410-01 | Cervix | cervical & endocervical cancer | Female | <65 | I/II | Unknown | Unknown | SD |
| PTK2B | SNV | Missense_Mutation | rs773709584 | c.2779N>A | p.Leu927Ile | p.L927I | Q14289 | protein_coding | tolerated(1) | benign(0) | TCGA-FU-A3HZ-01 | Cervix | cervical & endocervical cancer | Female | <65 | I/II | Chemotherapy | cisplatin | CR |
| Entrez ID | Symbol | Category | Interaction Types | Drug Claim Name | Drug Name | PMIDs |
| 2185 | PTK2B | DRUGGABLE GENOME, KINASE, ION CHANNEL, G PROTEIN COUPLED RECEPTOR, TYROSINE KINASE, ENZYME | | PMID27774822-Compound-Figure10Example1 | | |
| 2185 | PTK2B | DRUGGABLE GENOME, KINASE, ION CHANNEL, G PROTEIN COUPLED RECEPTOR, TYROSINE KINASE, ENZYME | | Imidazo[4,5-c]pyridine derivative 1 | | |
| 2185 | PTK2B | DRUGGABLE GENOME, KINASE, ION CHANNEL, G PROTEIN COUPLED RECEPTOR, TYROSINE KINASE, ENZYME | | Aminotriazolopyridine derivative 1 | | |
| 2185 | PTK2B | DRUGGABLE GENOME, KINASE, ION CHANNEL, G PROTEIN COUPLED RECEPTOR, TYROSINE KINASE, ENZYME | | CID 94381 | CHEMBL374632 | |
| 2185 | PTK2B | DRUGGABLE GENOME, KINASE, ION CHANNEL, G PROTEIN COUPLED RECEPTOR, TYROSINE KINASE, ENZYME | | HTS-05058 | CHEMBL261692 | |
| 2185 | PTK2B | DRUGGABLE GENOME, KINASE, ION CHANNEL, G PROTEIN COUPLED RECEPTOR, TYROSINE KINASE, ENZYME | | PMID27774824-Compound-Figure11Example1up | | |
| 2185 | PTK2B | DRUGGABLE GENOME, KINASE, ION CHANNEL, G PROTEIN COUPLED RECEPTOR, TYROSINE KINASE, ENZYME | | TCMDC-125185 | CHEMBL580819 | |
| 2185 | PTK2B | DRUGGABLE GENOME, KINASE, ION CHANNEL, G PROTEIN COUPLED RECEPTOR, TYROSINE KINASE, ENZYME | inhibitor | CHEMBL3137331 | DEFACTINIB | |
| 2185 | PTK2B | DRUGGABLE GENOME, KINASE, ION CHANNEL, G PROTEIN COUPLED RECEPTOR, TYROSINE KINASE, ENZYME | | PF-04965842 | ABROCITINIB | |
| 2185 | PTK2B | DRUGGABLE GENOME, KINASE, ION CHANNEL, G PROTEIN COUPLED RECEPTOR, TYROSINE KINASE, ENZYME | | ASP-015K | PEFICITINIB | |


