| Tissue | Expression Dynamics | Abbreviation |
| Breast | 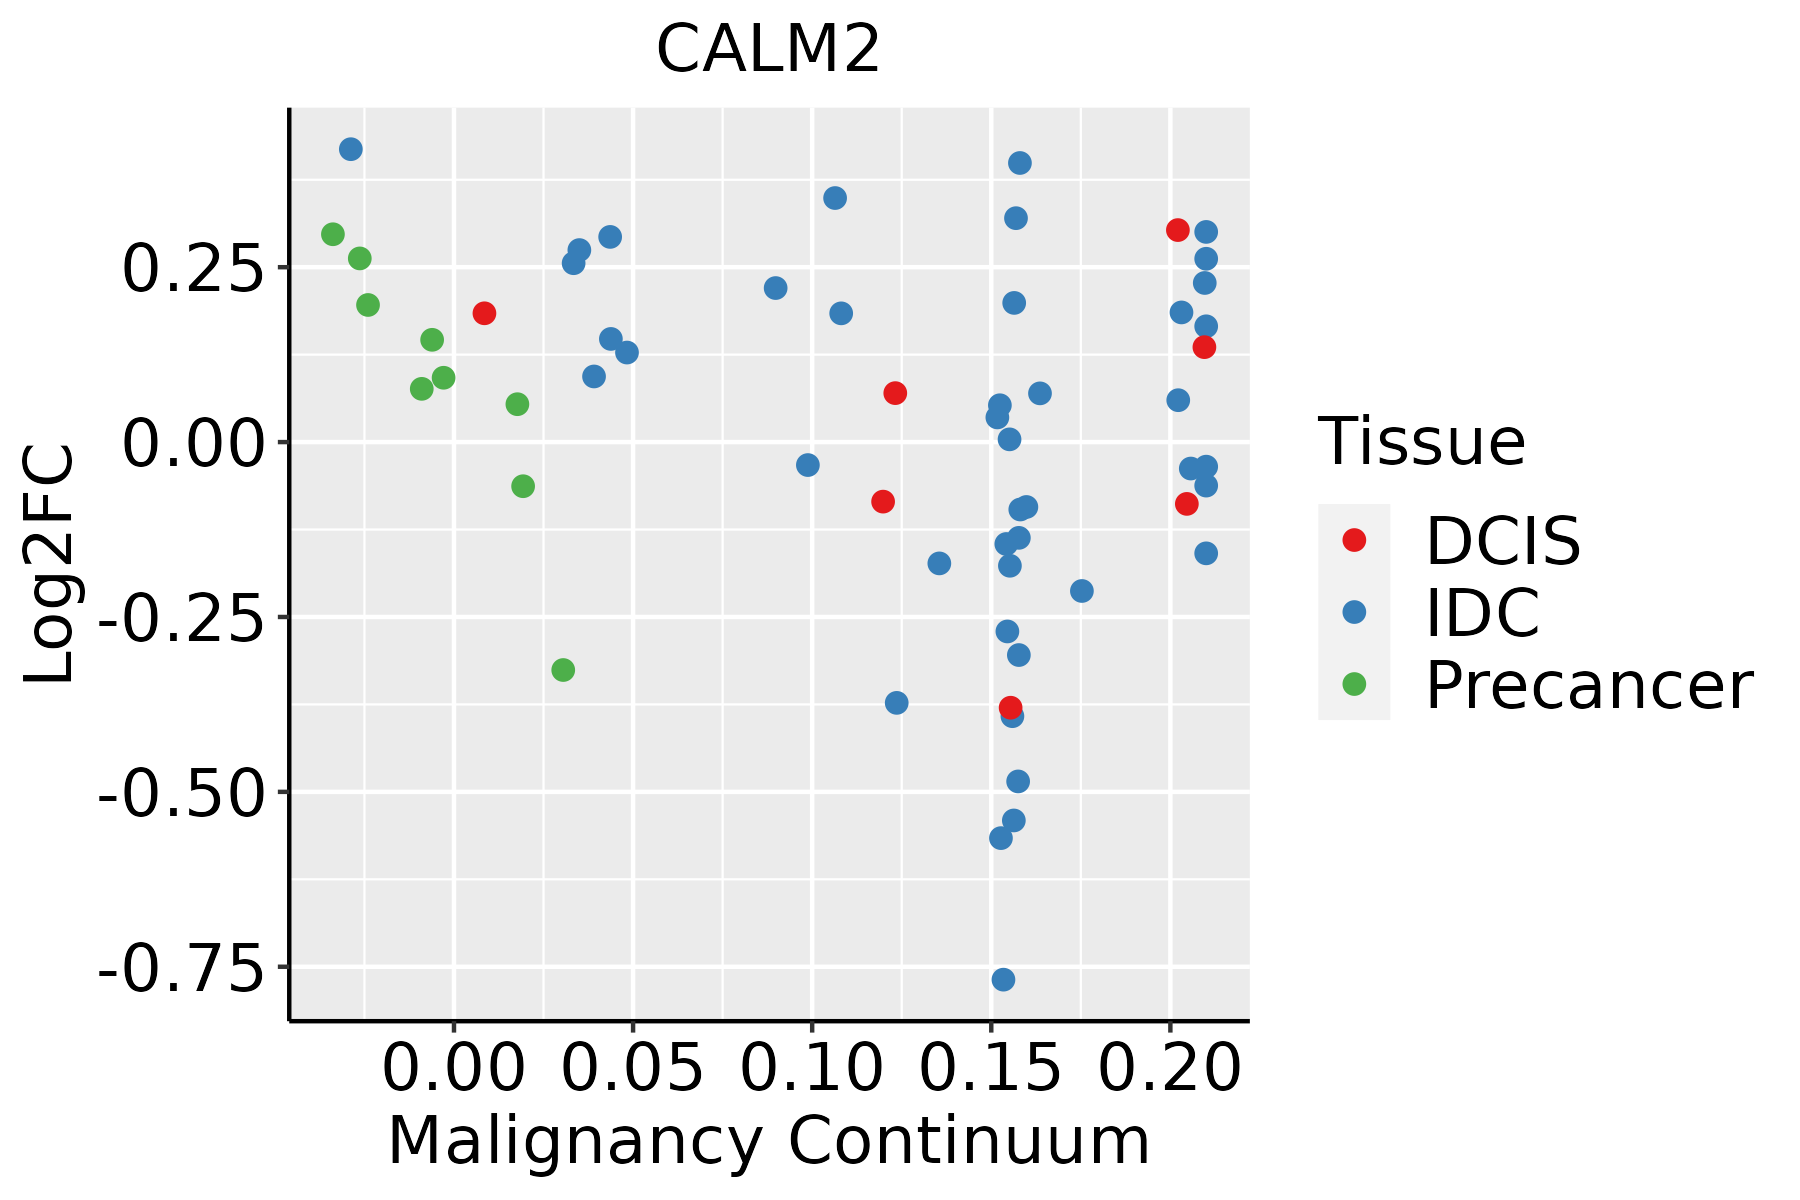 | IDC: Invasive ductal carcinoma |
| DCIS: Ductal carcinoma in situ |
| Precancer(BRCA1-mut): Precancerous lesion from BRCA1 mutation carriers |
| Cervix | 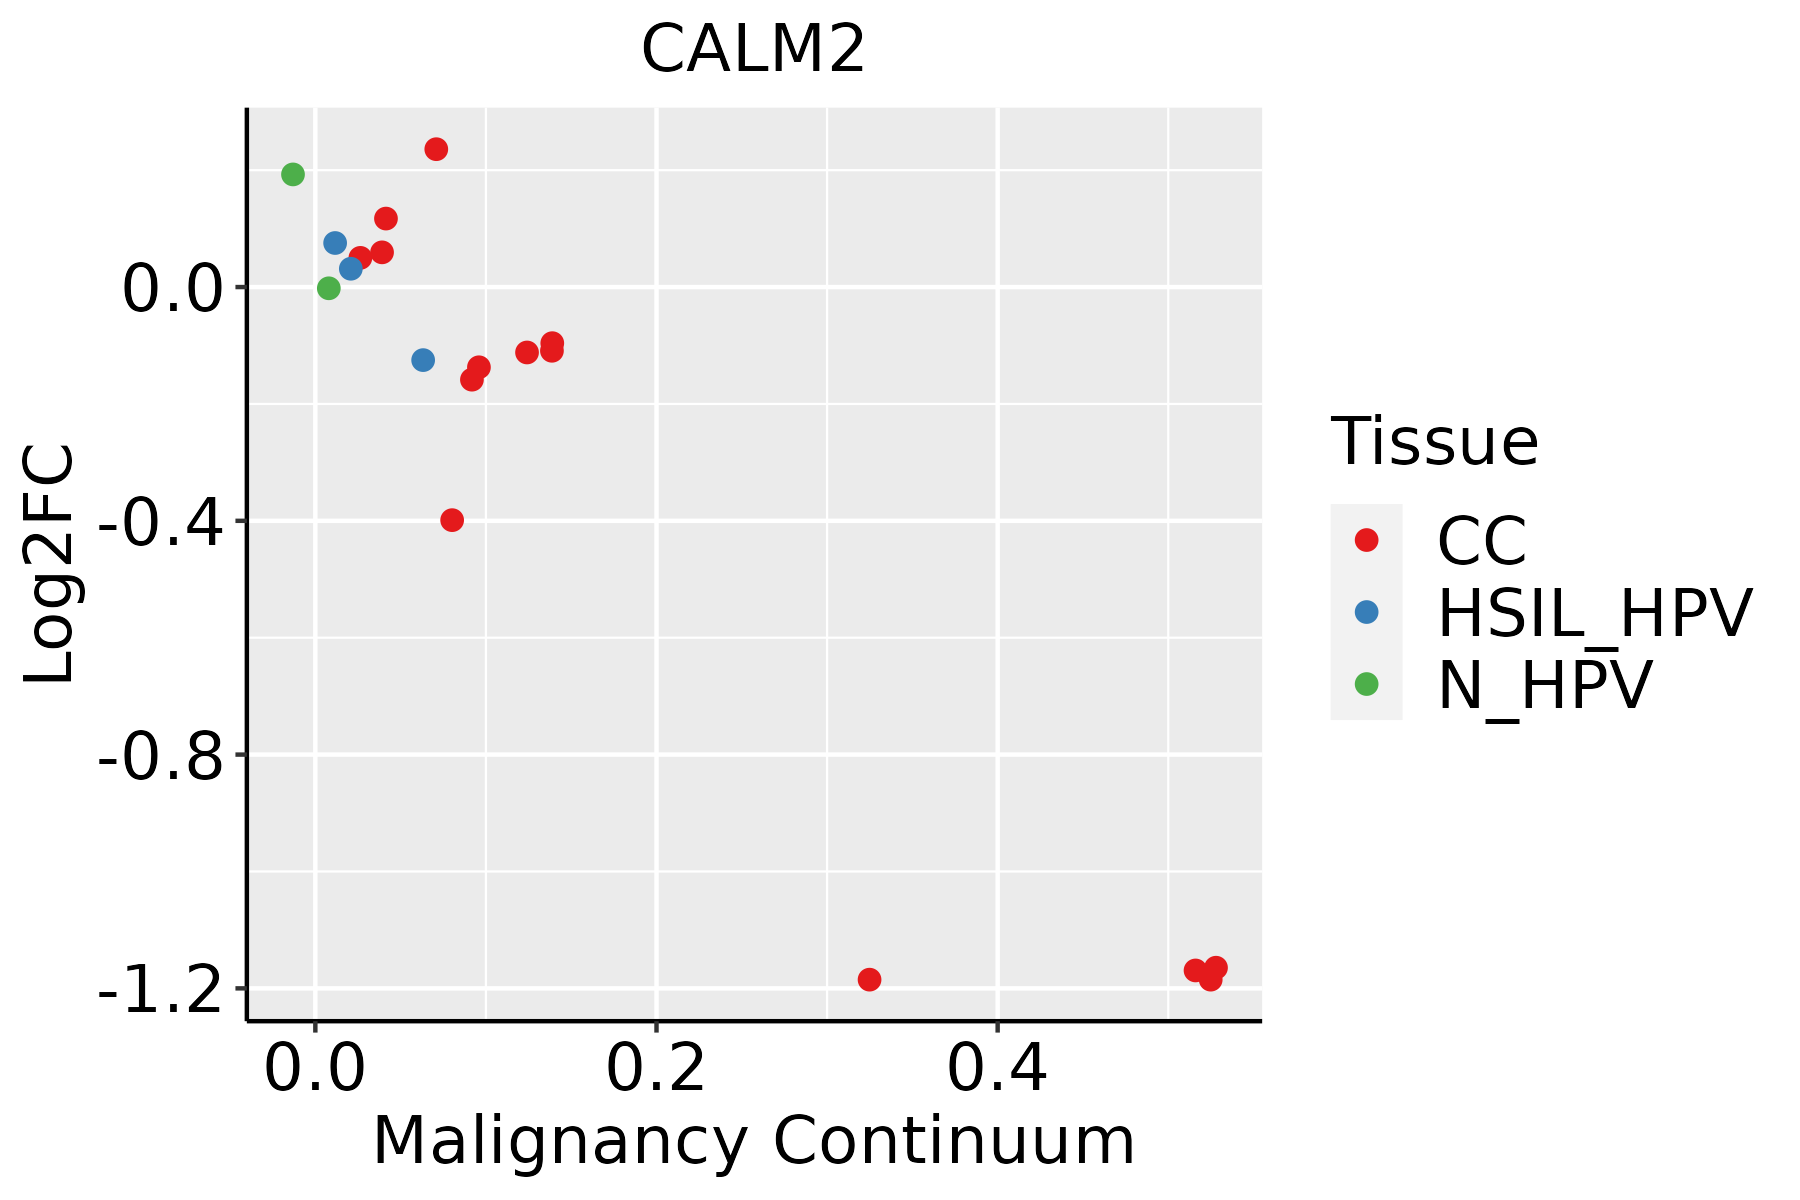 | CC: Cervix cancer |
| HSIL_HPV: HPV-infected high-grade squamous intraepithelial lesions |
| N_HPV: HPV-infected normal cervix |
| Colorectum (GSE201348) |  | FAP: Familial adenomatous polyposis |
| CRC: Colorectal cancer |
| Colorectum (HTA11) |  | AD: Adenomas |
| SER: Sessile serrated lesions |
| MSI-H: Microsatellite-high colorectal cancer |
| MSS: Microsatellite stable colorectal cancer |
| Endometrium | 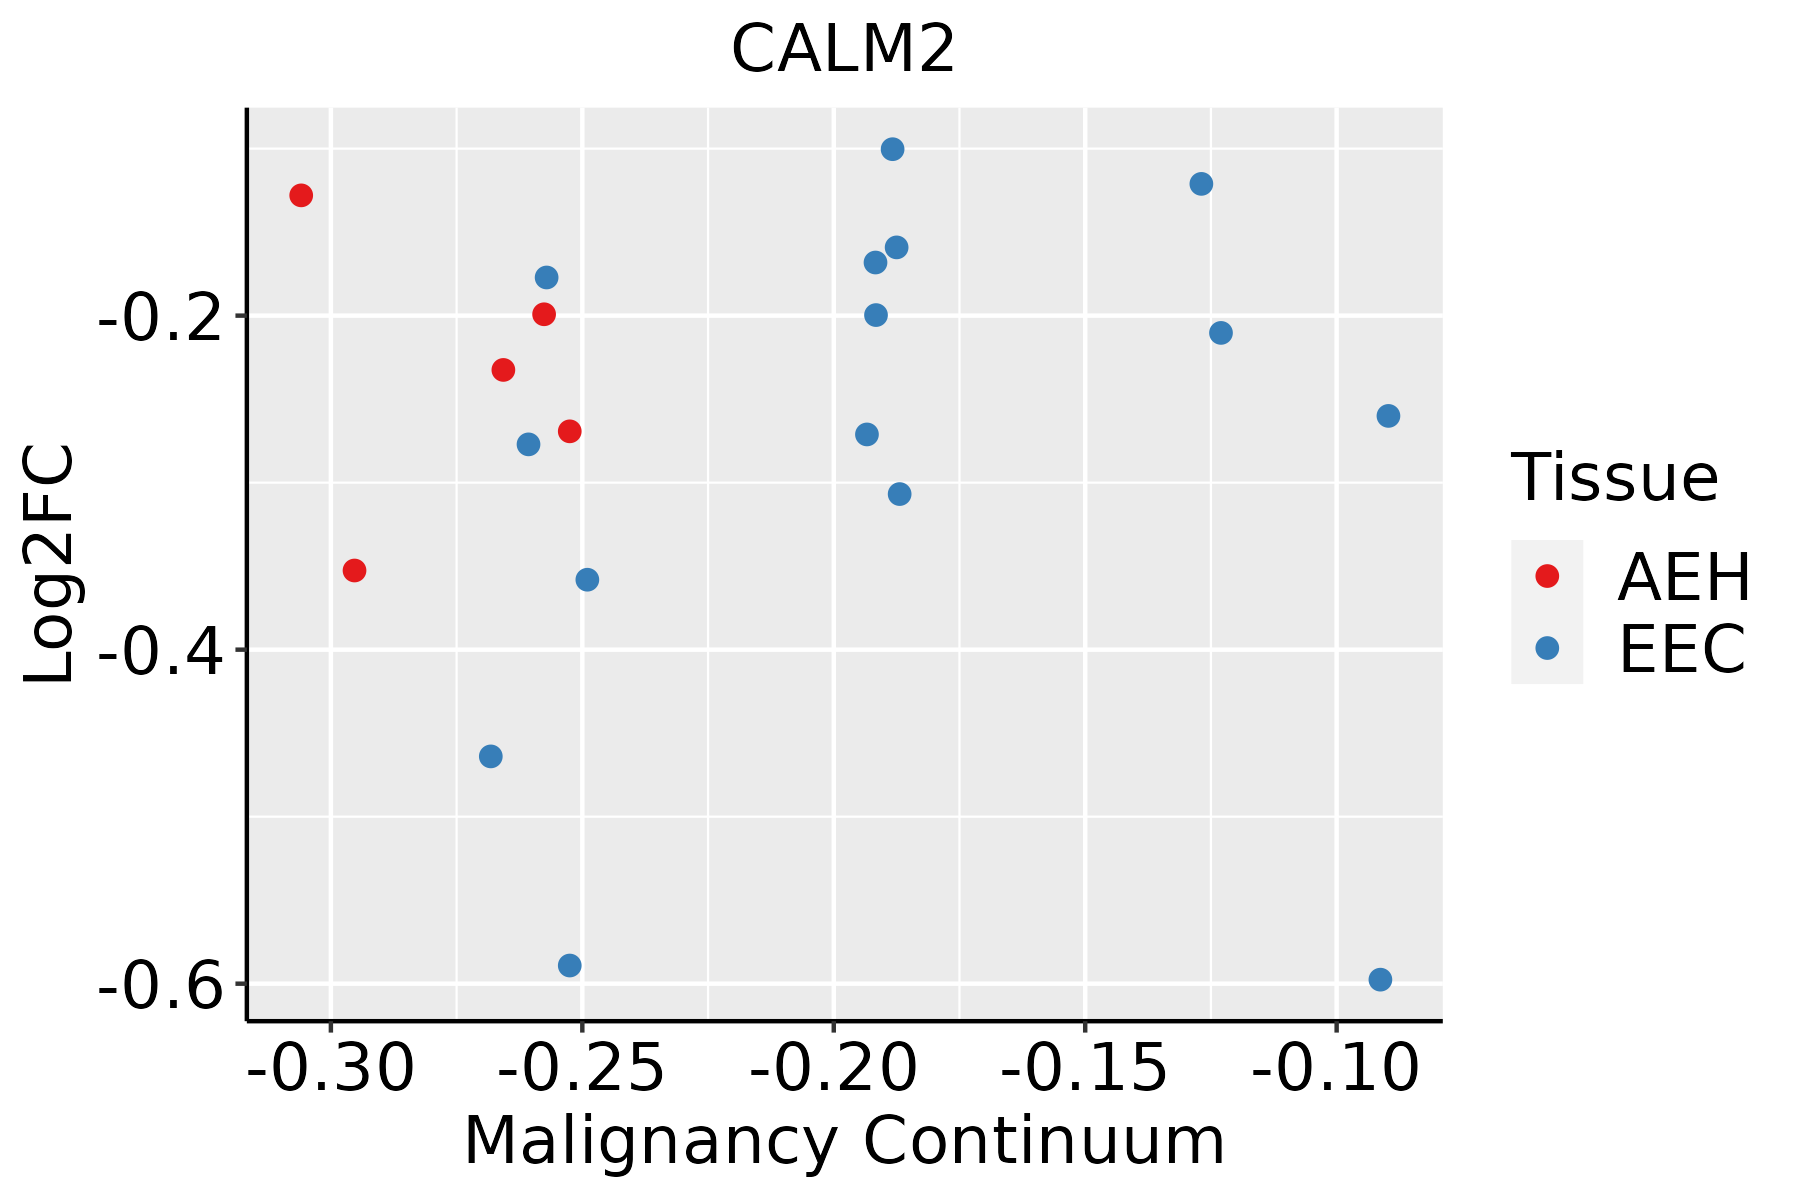 | AEH: Atypical endometrial hyperplasia |
| EEC: Endometrioid Cancer |
| Esophagus | 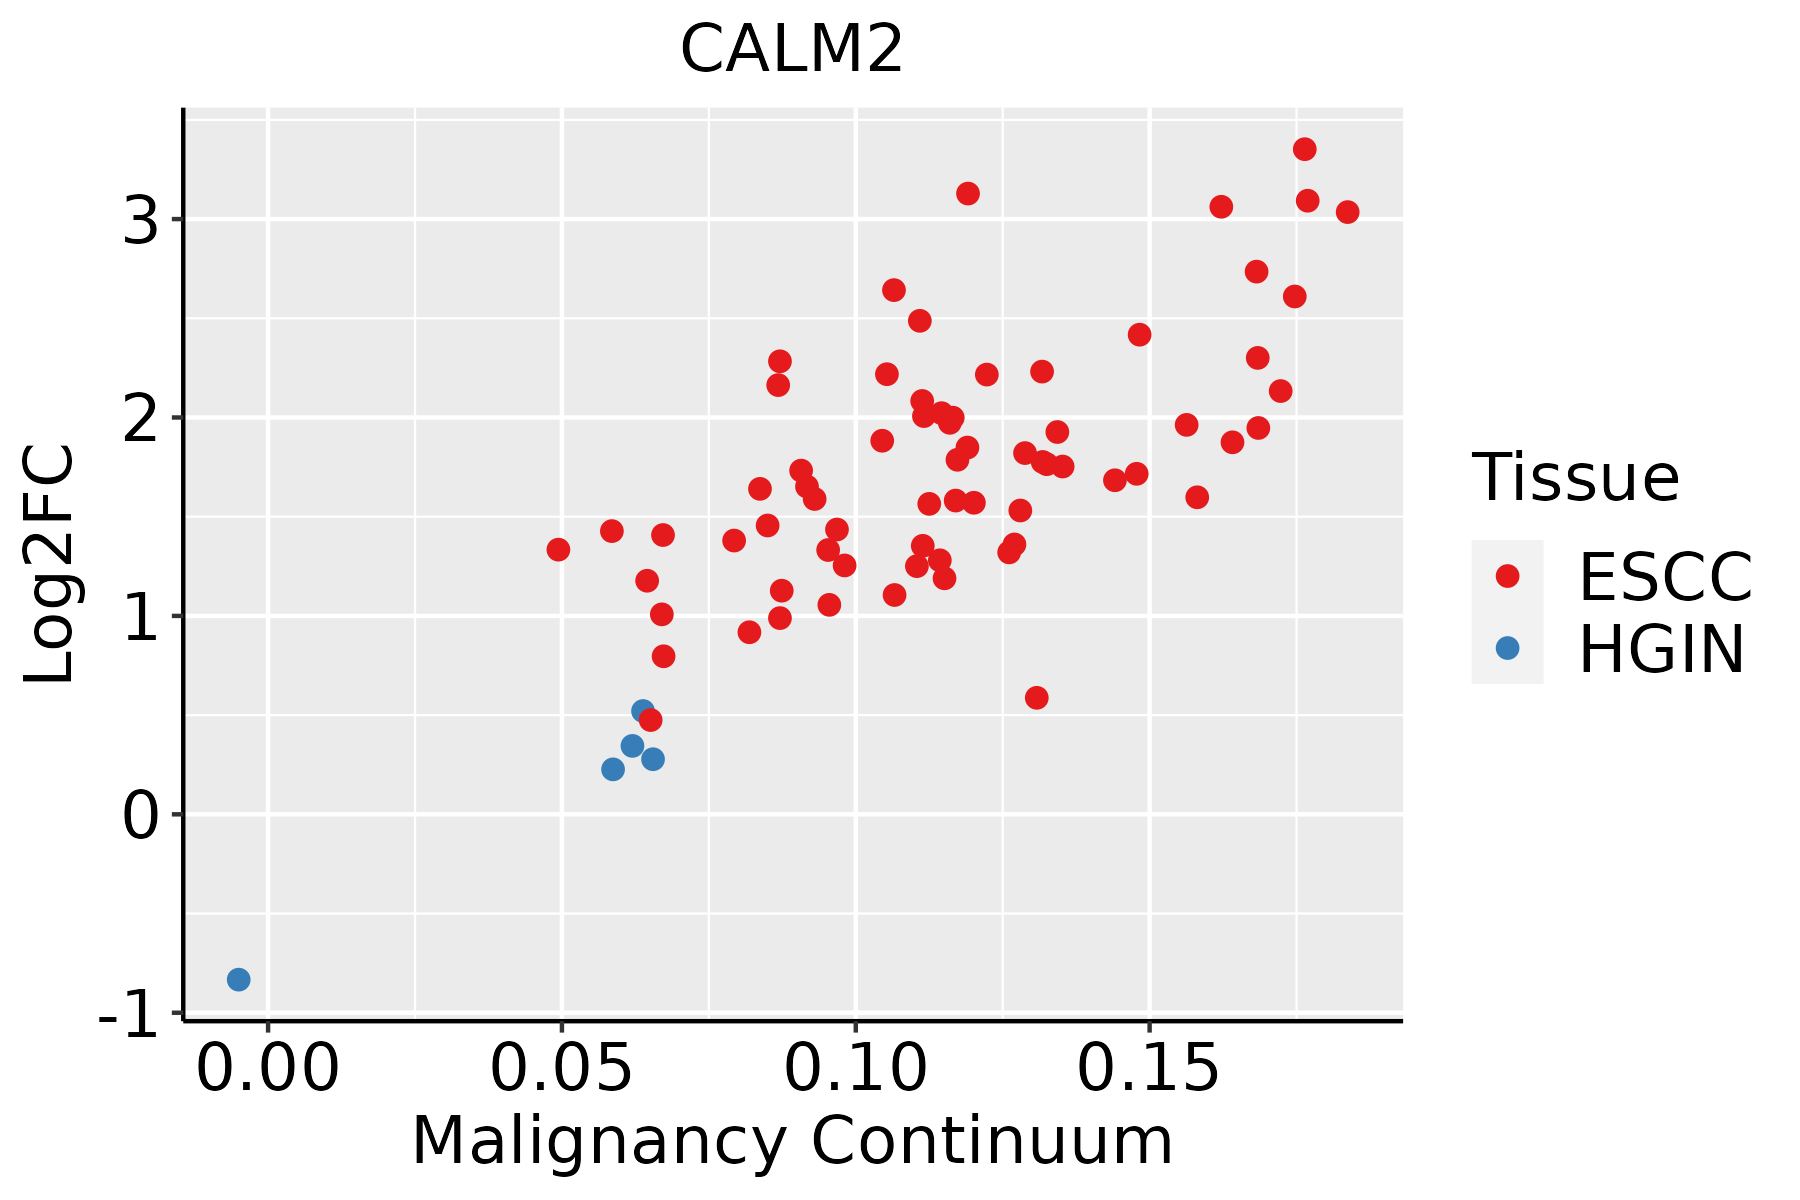 | ESCC: Esophageal squamous cell carcinoma |
| HGIN: High-grade intraepithelial neoplasias |
| LGIN: Low-grade intraepithelial neoplasias |
| GC | 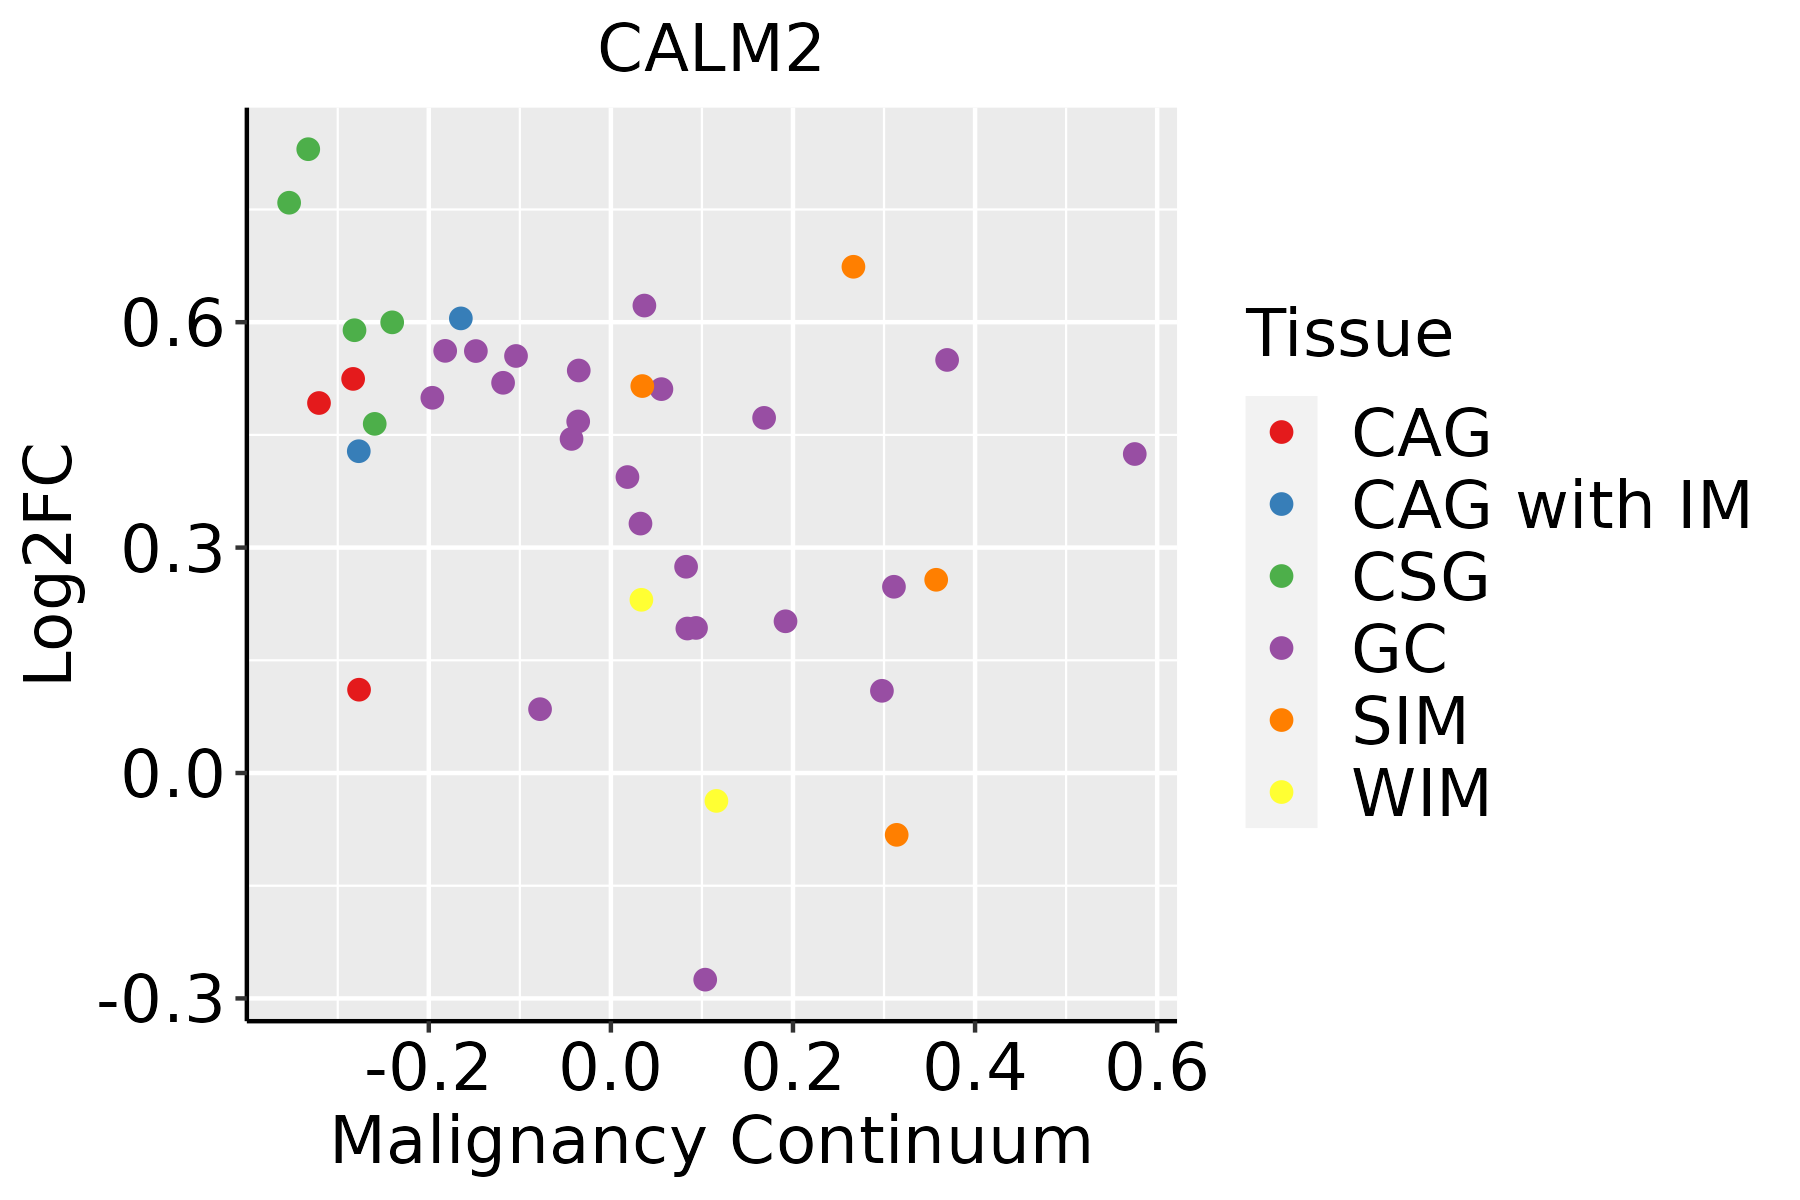 | CAG: Chronic atrophic gastritis |
| CAG with IM: Chronic atrophic gastritis with intestinal metaplasia |
| CSG: Chronic superficial gastritis |
| GC: Gastric cancer |
| SIM: Severe intestinal metaplasia |
| WIM: Wild intestinal metaplasia |
| Liver | 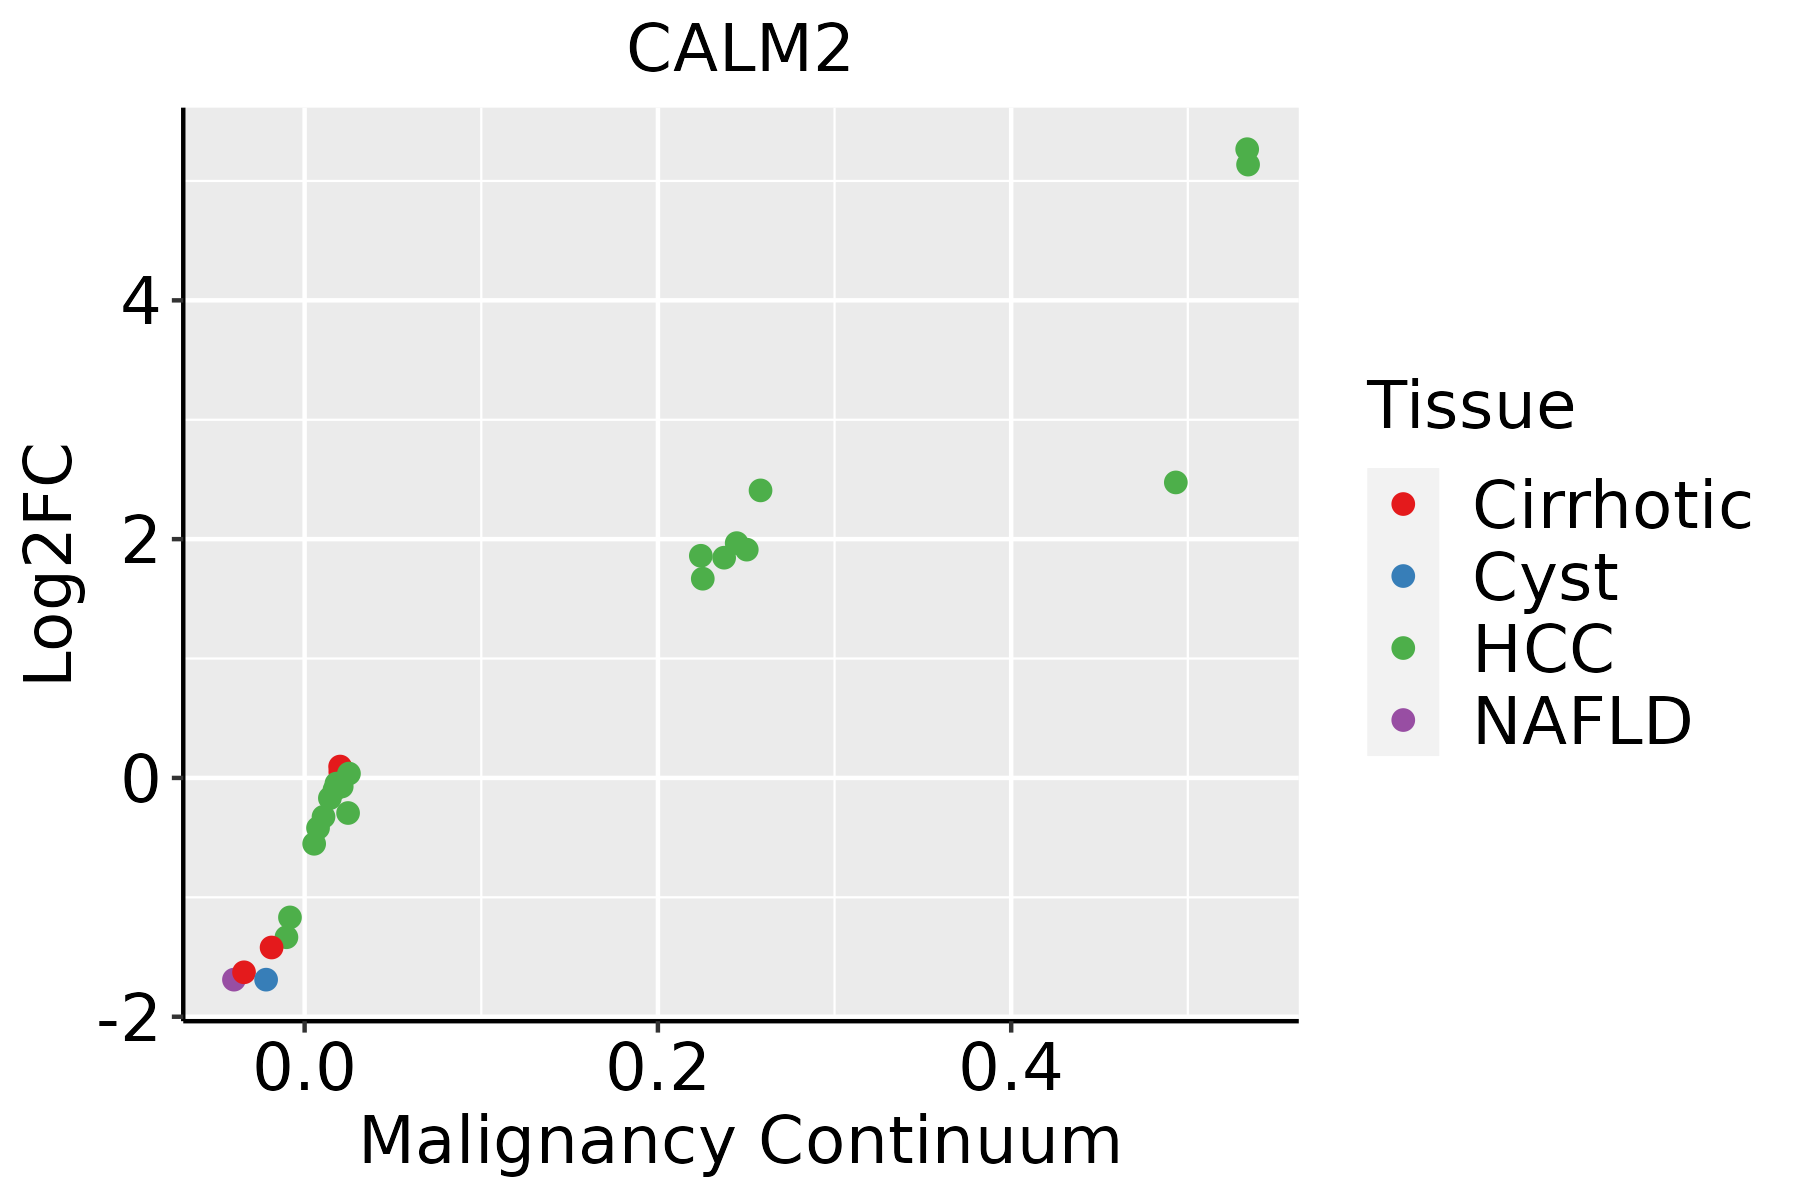 | HCC: Hepatocellular carcinoma |
| NAFLD: Non-alcoholic fatty liver disease |
| Lung |  | AAH: Atypical adenomatous hyperplasia |
| AIS: Adenocarcinoma in situ |
| IAC: Invasive lung adenocarcinoma |
| MIA: Minimally invasive adenocarcinoma |
| Oral Cavity |  | EOLP: Erosive Oral lichen planus |
| LP: leukoplakia |
| NEOLP: Non-erosive oral lichen planus |
| OSCC: Oral squamous cell carcinoma |
| Prostate | 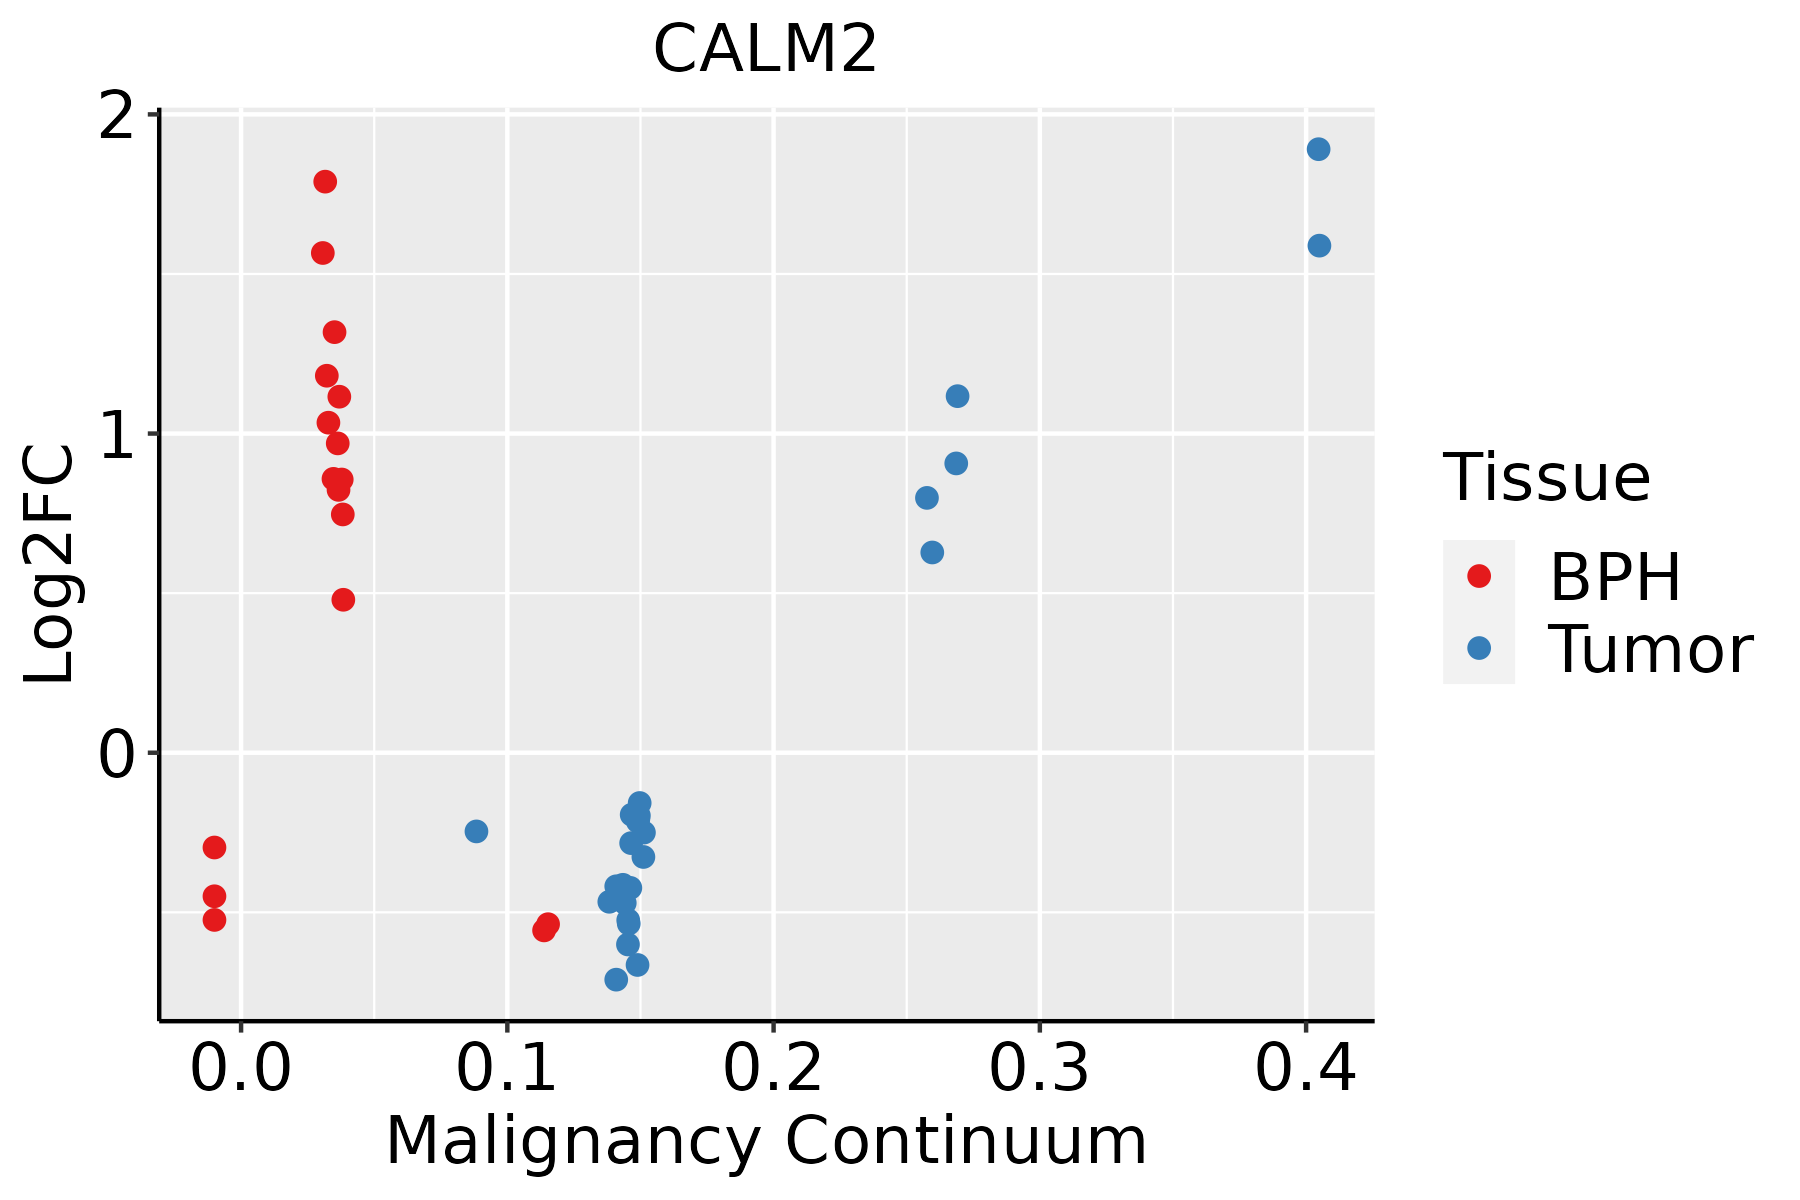 | BPH: Benign Prostatic Hyperplasia |
| Skin | 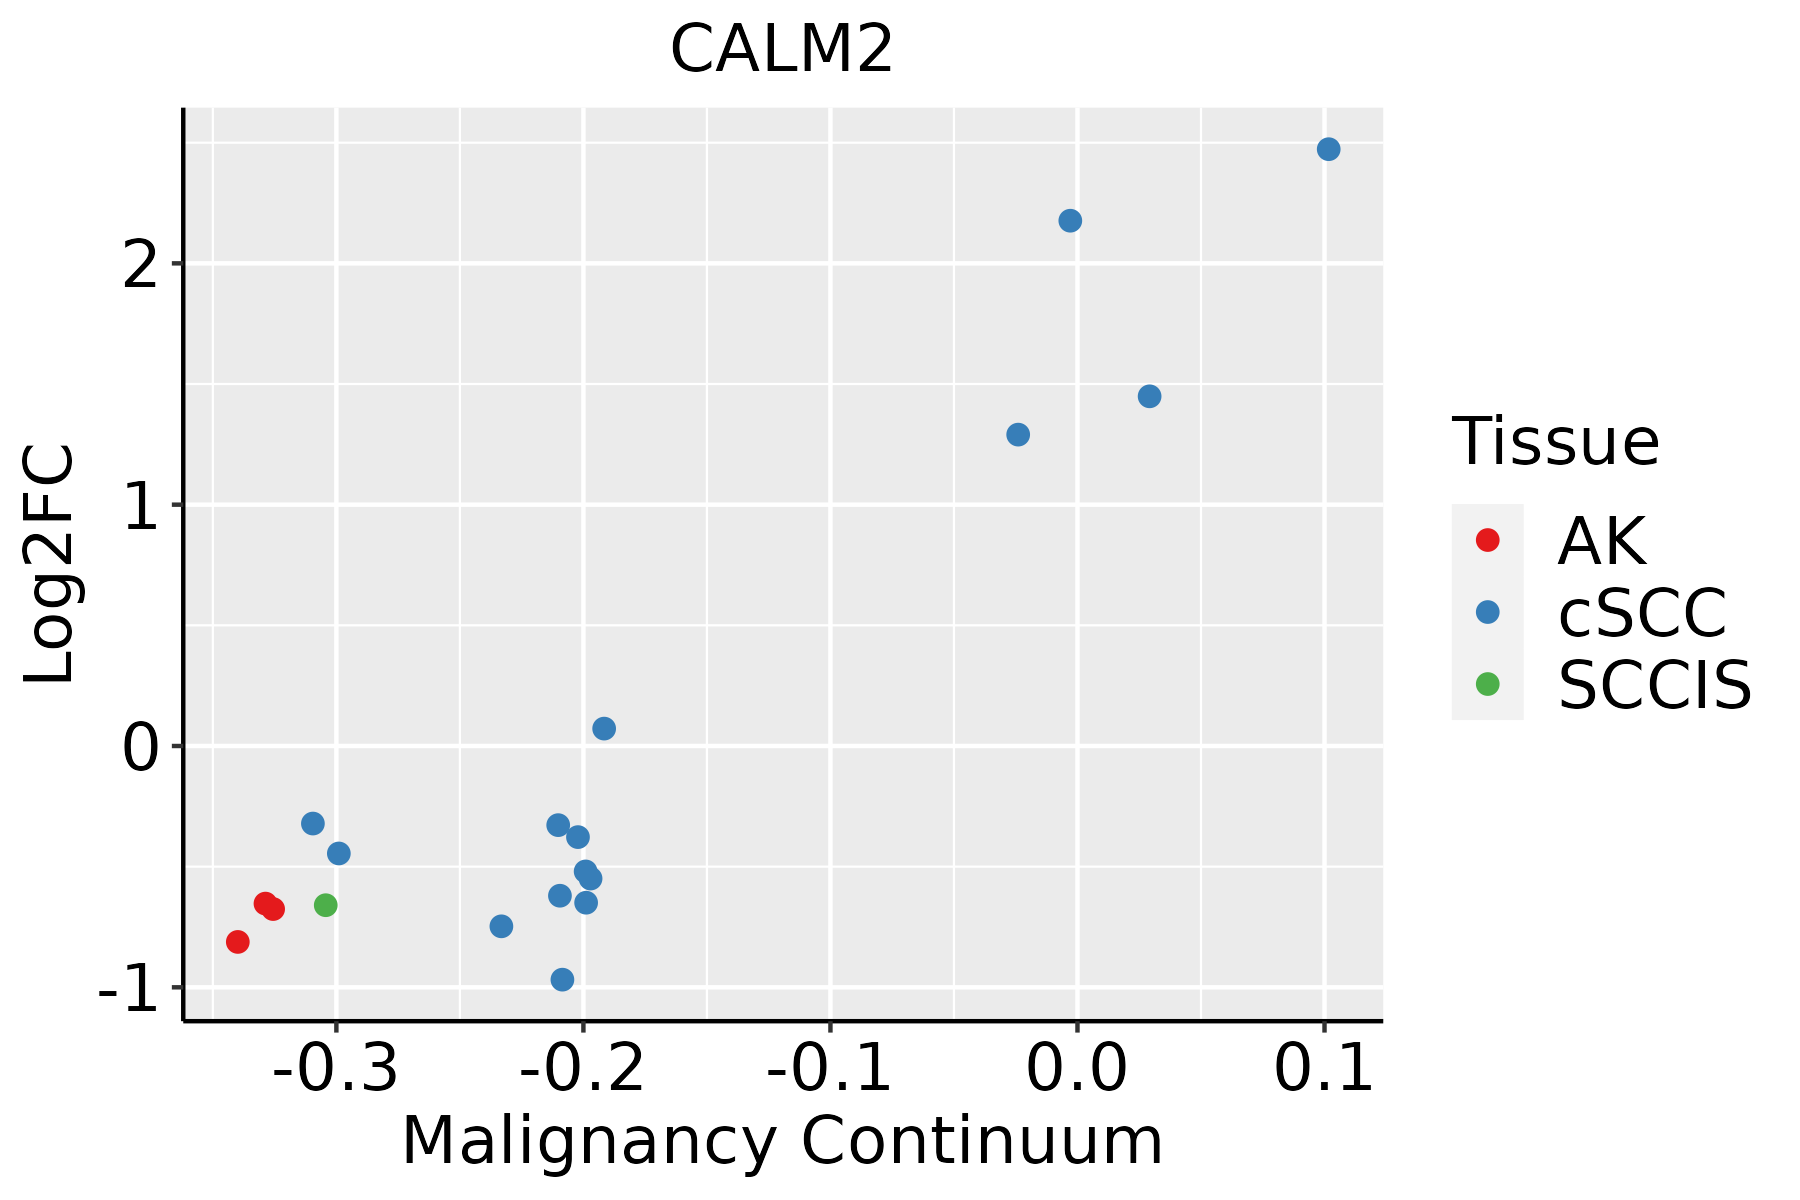 | AK: Actinic keratosis |
| cSCC: Cutaneous squamous cell carcinoma |
| SCCIS:squamous cell carcinoma in situ |
| Thyroid |  | ATC: Anaplastic thyroid cancer |
| HT: Hashimoto's thyroiditis |
| PTC: Papillary thyroid cancer |
| GO ID | Tissue | Disease Stage | Description | Gene Ratio | Bg Ratio | pvalue | p.adjust | Count |
| GO:0010563210 | Thyroid | goiters | negative regulation of phosphorus metabolic process | 23/497 | 442/18723 | 1.76e-03 | 3.14e-02 | 23 |
| GO:000193328 | Thyroid | goiters | negative regulation of protein phosphorylation | 19/497 | 342/18723 | 2.08e-03 | 3.48e-02 | 19 |
| GO:003090124 | Thyroid | goiters | midbrain development | 8/497 | 90/18723 | 2.69e-03 | 4.26e-02 | 8 |
| GO:005109834 | Thyroid | ATC | regulation of binding | 203/6293 | 363/18723 | 1.18e-18 | 1.55e-16 | 203 |
| GO:001056334 | Thyroid | ATC | negative regulation of phosphorus metabolic process | 234/6293 | 442/18723 | 2.30e-17 | 2.31e-15 | 234 |
| GO:004593634 | Thyroid | ATC | negative regulation of phosphate metabolic process | 233/6293 | 441/18723 | 3.68e-17 | 3.47e-15 | 233 |
| GO:004477219 | Thyroid | ATC | mitotic cell cycle phase transition | 223/6293 | 424/18723 | 3.46e-16 | 2.88e-14 | 223 |
| GO:000193333 | Thyroid | ATC | negative regulation of protein phosphorylation | 186/6293 | 342/18723 | 1.43e-15 | 1.08e-13 | 186 |
| GO:004232634 | Thyroid | ATC | negative regulation of phosphorylation | 203/6293 | 385/18723 | 5.30e-15 | 3.53e-13 | 203 |
| GO:005109934 | Thyroid | ATC | positive regulation of binding | 103/6293 | 173/18723 | 2.19e-12 | 9.05e-11 | 103 |
| GO:007190025 | Thyroid | ATC | regulation of protein serine/threonine kinase activity | 176/6293 | 359/18723 | 8.35e-10 | 2.17e-08 | 176 |
| GO:004586026 | Thyroid | ATC | positive regulation of protein kinase activity | 185/6293 | 386/18723 | 3.00e-09 | 7.02e-08 | 185 |
| GO:0000910110 | Thyroid | ATC | cytokinesis | 93/6293 | 173/18723 | 3.59e-08 | 6.67e-07 | 93 |
| GO:003367427 | Thyroid | ATC | positive regulation of kinase activity | 212/6293 | 467/18723 | 5.89e-08 | 1.05e-06 | 212 |
| GO:002176233 | Thyroid | ATC | substantia nigra development | 32/6293 | 44/18723 | 1.28e-07 | 2.12e-06 | 32 |
| GO:004677717 | Thyroid | ATC | protein autophosphorylation | 114/6293 | 227/18723 | 1.54e-07 | 2.49e-06 | 114 |
| GO:0035304113 | Thyroid | ATC | regulation of protein dephosphorylation | 54/6293 | 90/18723 | 2.54e-07 | 3.92e-06 | 54 |
| GO:0035303113 | Thyroid | ATC | regulation of dephosphorylation | 70/6293 | 128/18723 | 7.24e-07 | 9.65e-06 | 70 |
| GO:005123532 | Thyroid | ATC | maintenance of location | 152/6293 | 327/18723 | 7.84e-07 | 1.04e-05 | 152 |
| GO:005165133 | Thyroid | ATC | maintenance of location in cell | 105/6293 | 214/18723 | 1.92e-06 | 2.31e-05 | 105 |
| Pathway ID | Tissue | Disease Stage | Description | Gene Ratio | Bg Ratio | pvalue | p.adjust | qvalue | Count |
| hsa0501218 | Breast | Precancer | Parkinson disease | 99/684 | 266/8465 | 3.58e-42 | 5.65e-40 | 4.33e-40 | 99 |
| hsa0501016 | Breast | Precancer | Alzheimer disease | 103/684 | 384/8465 | 1.03e-29 | 4.66e-28 | 3.57e-28 | 103 |
| hsa0502216 | Breast | Precancer | Pathways of neurodegeneration - multiple diseases | 112/684 | 476/8465 | 6.96e-27 | 2.44e-25 | 1.87e-25 | 112 |
| hsa0516718 | Breast | Precancer | Kaposi sarcoma-associated herpesvirus infection | 36/684 | 194/8465 | 1.68e-06 | 2.53e-05 | 1.94e-05 | 36 |
| hsa0491518 | Breast | Precancer | Estrogen signaling pathway | 28/684 | 138/8465 | 4.10e-06 | 5.39e-05 | 4.13e-05 | 28 |
| hsa0541818 | Breast | Precancer | Fluid shear stress and atherosclerosis | 28/684 | 139/8465 | 4.74e-06 | 6.00e-05 | 4.59e-05 | 28 |
| hsa0541718 | Breast | Precancer | Lipid and atherosclerosis | 37/684 | 215/8465 | 7.64e-06 | 9.29e-05 | 7.12e-05 | 37 |
| hsa042189 | Breast | Precancer | Cellular senescence | 29/684 | 156/8465 | 1.66e-05 | 1.69e-04 | 1.30e-04 | 29 |
| hsa05031 | Breast | Precancer | Amphetamine addiction | 14/684 | 69/8465 | 1.05e-03 | 7.35e-03 | 5.63e-03 | 14 |
| hsa0516316 | Breast | Precancer | Human cytomegalovirus infection | 32/684 | 225/8465 | 1.13e-03 | 7.57e-03 | 5.80e-03 | 32 |
| hsa0501219 | Breast | Precancer | Parkinson disease | 99/684 | 266/8465 | 3.58e-42 | 5.65e-40 | 4.33e-40 | 99 |
| hsa0501017 | Breast | Precancer | Alzheimer disease | 103/684 | 384/8465 | 1.03e-29 | 4.66e-28 | 3.57e-28 | 103 |
| hsa0502217 | Breast | Precancer | Pathways of neurodegeneration - multiple diseases | 112/684 | 476/8465 | 6.96e-27 | 2.44e-25 | 1.87e-25 | 112 |
| hsa0516719 | Breast | Precancer | Kaposi sarcoma-associated herpesvirus infection | 36/684 | 194/8465 | 1.68e-06 | 2.53e-05 | 1.94e-05 | 36 |
| hsa0491519 | Breast | Precancer | Estrogen signaling pathway | 28/684 | 138/8465 | 4.10e-06 | 5.39e-05 | 4.13e-05 | 28 |
| hsa0541819 | Breast | Precancer | Fluid shear stress and atherosclerosis | 28/684 | 139/8465 | 4.74e-06 | 6.00e-05 | 4.59e-05 | 28 |
| hsa0541719 | Breast | Precancer | Lipid and atherosclerosis | 37/684 | 215/8465 | 7.64e-06 | 9.29e-05 | 7.12e-05 | 37 |
| hsa0421814 | Breast | Precancer | Cellular senescence | 29/684 | 156/8465 | 1.66e-05 | 1.69e-04 | 1.30e-04 | 29 |
| hsa050311 | Breast | Precancer | Amphetamine addiction | 14/684 | 69/8465 | 1.05e-03 | 7.35e-03 | 5.63e-03 | 14 |
| hsa0516317 | Breast | Precancer | Human cytomegalovirus infection | 32/684 | 225/8465 | 1.13e-03 | 7.57e-03 | 5.80e-03 | 32 |
| Hugo Symbol | Variant Class | Variant Classification | dbSNP RS | HGVSc | HGVSp | HGVSp Short | SWISSPROT | BIOTYPE | SIFT | PolyPhen | Tumor Sample Barcode | Tissue | Histology | Sex | Age | Stage | Therapy Types | Drugs | Outcome |
| CALM2 | SNV | Missense_Mutation | | c.39C>G | p.Phe13Leu | p.F13L | P62158 | protein_coding | deleterious_low_confidence(0.03) | benign(0.206) | TCGA-D8-A27G-01 | Breast | breast invasive carcinoma | Female | >=65 | I/II | Unknown | Unknown | SD |
| CALM2 | SNV | Missense_Mutation | | c.193G>C | p.Asp65His | p.D65H | P62158 | protein_coding | deleterious_low_confidence(0) | possibly_damaging(0.845) | TCGA-GM-A2DO-01 | Breast | breast invasive carcinoma | Female | <65 | I/II | Hormone Therapy | tamoxiphen | CR |
| CALM2 | SNV | Missense_Mutation | | c.319N>T | p.Arg107Cys | p.R107C | P62158 | protein_coding | tolerated_low_confidence(0.07) | benign(0.015) | TCGA-CA-6717-01 | Colorectum | colon adenocarcinoma | Male | <65 | I/II | Chemotherapy | oxaliplatin | CR |
| CALM2 | SNV | Missense_Mutation | | c.77N>A | p.Gly26Glu | p.G26E | P62158 | protein_coding | deleterious_low_confidence(0.02) | possibly_damaging(0.903) | TCGA-AP-A051-01 | Endometrium | uterine corpus endometrioid carcinoma | Female | >=65 | I/II | Unknown | Unknown | SD |
| CALM2 | SNV | Missense_Mutation | novel | c.334A>G | p.Asn112Asp | p.N112D | P62158 | protein_coding | deleterious_low_confidence(0.01) | possibly_damaging(0.623) | TCGA-AP-A059-01 | Endometrium | uterine corpus endometrioid carcinoma | Female | >=65 | I/II | Unknown | Unknown | SD |
| CALM2 | SNV | Missense_Mutation | | c.319N>T | p.Arg107Cys | p.R107C | P62158 | protein_coding | tolerated_low_confidence(0.07) | benign(0.015) | TCGA-AP-A0LM-01 | Endometrium | uterine corpus endometrioid carcinoma | Female | <65 | III/IV | Chemotherapy | cisplatin | SD |
| CALM2 | SNV | Missense_Mutation | | c.185G>A | p.Gly62Asp | p.G62D | P62158 | protein_coding | deleterious_low_confidence(0) | possibly_damaging(0.89) | TCGA-AX-A0J1-01 | Endometrium | uterine corpus endometrioid carcinoma | Female | >=65 | I/II | Unknown | Unknown | SD |
| CALM2 | SNV | Missense_Mutation | | c.343N>A | p.Glu115Lys | p.E115K | P62158 | protein_coding | deleterious_low_confidence(0) | possibly_damaging(0.851) | TCGA-B5-A0JY-01 | Endometrium | uterine corpus endometrioid carcinoma | Female | <65 | III/IV | Chemotherapy | doxorubicin | SD |
| CALM2 | SNV | Missense_Mutation | novel | c.345N>T | p.Glu115Asp | p.E115D | P62158 | protein_coding | deleterious_low_confidence(0.02) | benign(0.337) | TCGA-B5-A11N-01 | Endometrium | uterine corpus endometrioid carcinoma | Female | >=65 | I/II | Unknown | Unknown | SD |
| CALM2 | SNV | Missense_Mutation | | c.185N>A | p.Gly62Asp | p.G62D | P62158 | protein_coding | deleterious_low_confidence(0) | possibly_damaging(0.89) | TCGA-B5-A3FC-01 | Endometrium | uterine corpus endometrioid carcinoma | Female | <65 | I/II | Unknown | Unknown | SD |


