
|
|||||
|
 | |
| |
| |
| |
| |
| |
|
Gene: SET |
Gene summary for SET |
| Gene information | Species | Human | Gene symbol | SET | Gene ID | 6418 |
| Gene name | SET nuclear proto-oncogene | |
| Gene Alias | 2PP2A | |
| Cytomap | 9q34.11 | |
| Gene Type | protein-coding | GO ID | GO:0006139 | UniProtAcc | Q01105 |
Top |
Malignant transformation analysis |
| Identification of the aberrant gene expression in precancerous and cancerous lesions by comparing the gene expression of stem-like cells in diseased tissues with normal stem cells |
| Entrez ID | Symbol | Replicates | Species | Organ | Tissue | Adj P-value | Log2FC | Malignancy |
| 6418 | SET | GSM4909281 | Human | Breast | IDC | 1.19e-12 | 4.38e-01 | 0.21 |
| 6418 | SET | GSM4909282 | Human | Breast | IDC | 5.84e-06 | 2.65e-01 | -0.0288 |
| 6418 | SET | GSM4909286 | Human | Breast | IDC | 1.21e-04 | 2.05e-01 | 0.1081 |
| 6418 | SET | GSM4909288 | Human | Breast | IDC | 4.01e-02 | 8.44e-02 | 0.0988 |
| 6418 | SET | GSM4909290 | Human | Breast | IDC | 1.06e-06 | 3.80e-01 | 0.2096 |
| 6418 | SET | GSM4909293 | Human | Breast | IDC | 3.04e-10 | 3.72e-01 | 0.1581 |
| 6418 | SET | GSM4909294 | Human | Breast | IDC | 1.30e-17 | 2.92e-01 | 0.2022 |
| 6418 | SET | GSM4909296 | Human | Breast | IDC | 3.02e-15 | -3.98e-01 | 0.1524 |
| 6418 | SET | GSM4909297 | Human | Breast | IDC | 1.76e-25 | 2.22e-01 | 0.1517 |
| 6418 | SET | GSM4909306 | Human | Breast | IDC | 7.23e-03 | -2.71e-01 | 0.1564 |
| 6418 | SET | GSM4909309 | Human | Breast | IDC | 2.00e-02 | -2.24e-01 | 0.0483 |
| 6418 | SET | GSM4909311 | Human | Breast | IDC | 3.37e-49 | -5.41e-01 | 0.1534 |
| 6418 | SET | GSM4909312 | Human | Breast | IDC | 1.00e-09 | -2.43e-01 | 0.1552 |
| 6418 | SET | GSM4909317 | Human | Breast | IDC | 1.36e-02 | 2.79e-01 | 0.1355 |
| 6418 | SET | GSM4909318 | Human | Breast | IDC | 4.71e-08 | 4.81e-01 | 0.2031 |
| 6418 | SET | GSM4909319 | Human | Breast | IDC | 1.16e-58 | -8.01e-01 | 0.1563 |
| 6418 | SET | GSM4909320 | Human | Breast | IDC | 5.01e-11 | -7.26e-01 | 0.1575 |
| 6418 | SET | GSM4909321 | Human | Breast | IDC | 1.85e-12 | -3.31e-01 | 0.1559 |
| 6418 | SET | brca10 | Human | Breast | Precancer | 1.12e-11 | -5.22e-01 | -0.0029 |
| 6418 | SET | M2 | Human | Breast | IDC | 7.97e-12 | 4.74e-01 | 0.21 |
| Page: 1 2 3 4 5 6 7 8 9 10 11 12 13 |
| Tissue | Expression Dynamics | Abbreviation |
| Breast |  | IDC: Invasive ductal carcinoma |
| DCIS: Ductal carcinoma in situ | ||
| Precancer(BRCA1-mut): Precancerous lesion from BRCA1 mutation carriers | ||
| Cervix | 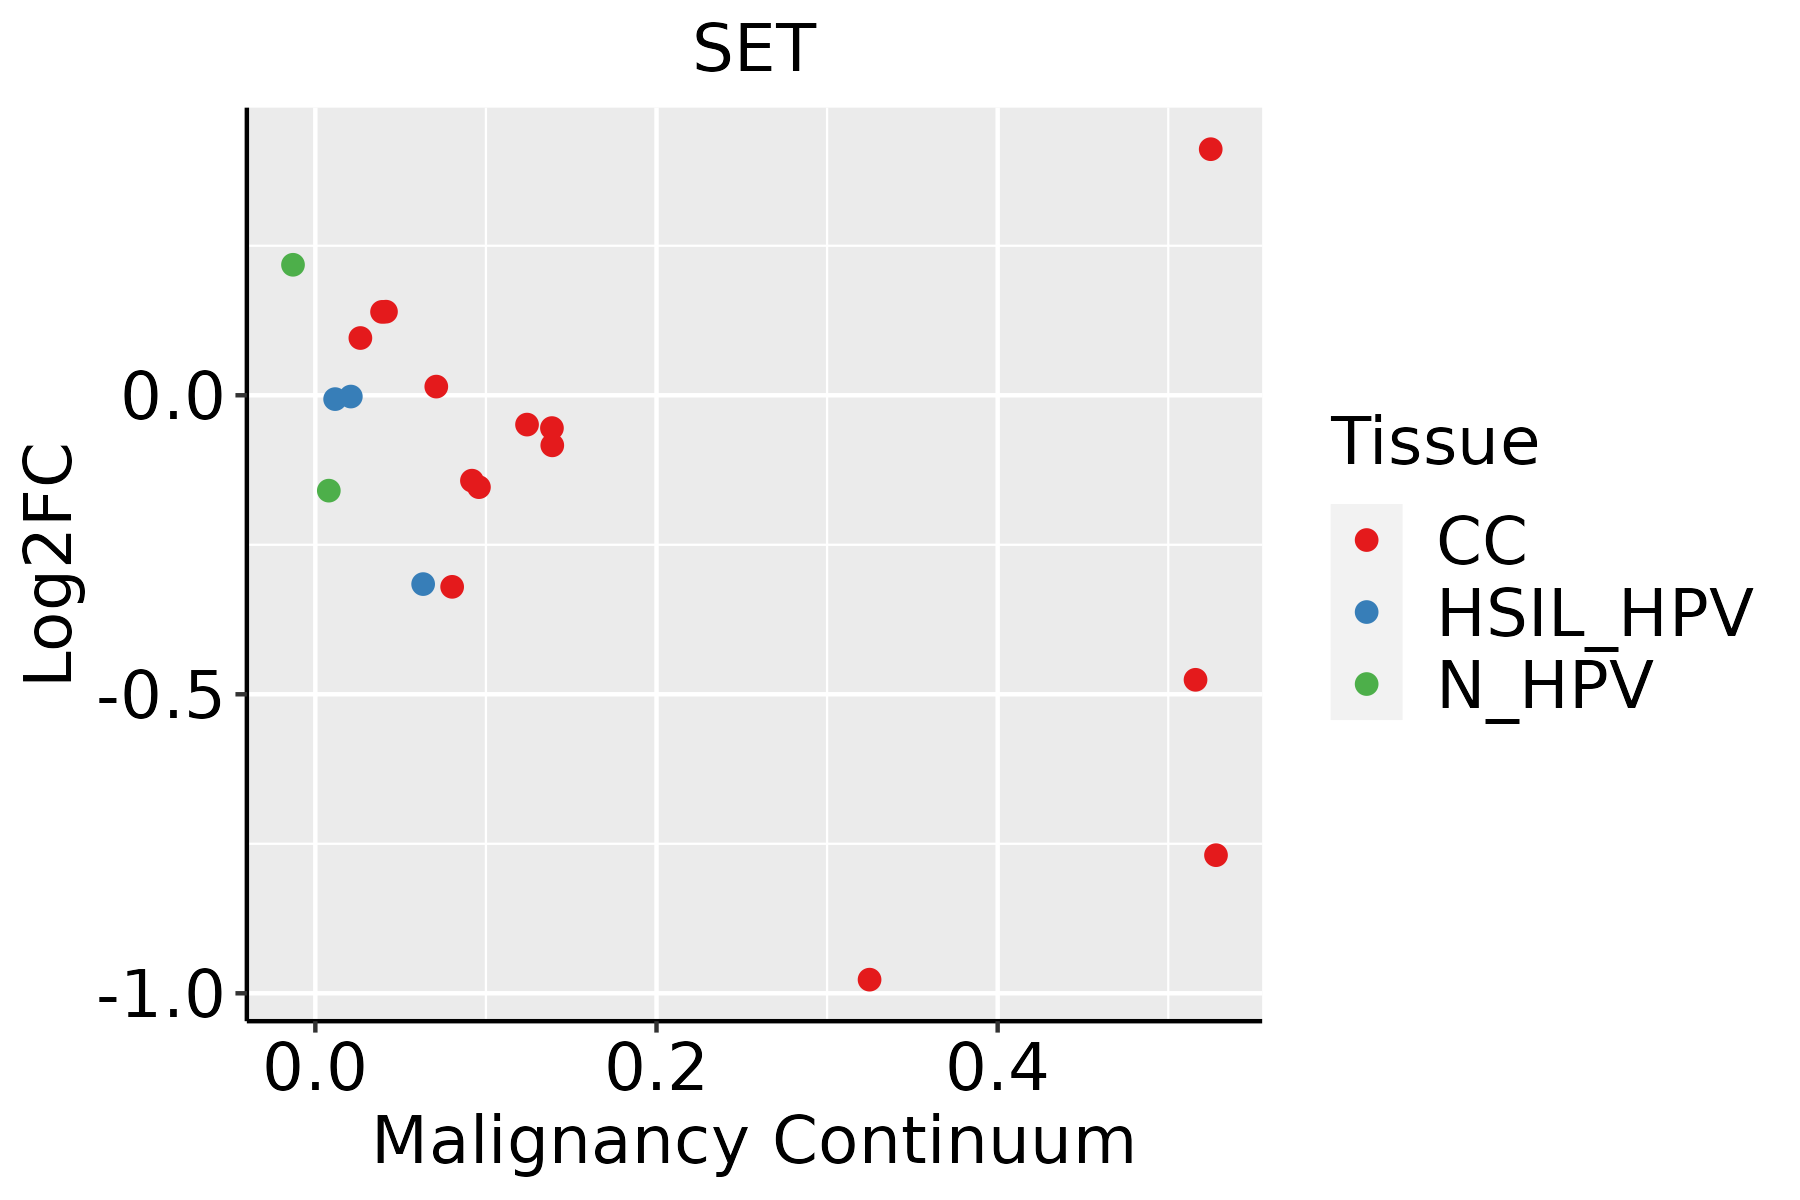 | CC: Cervix cancer |
| HSIL_HPV: HPV-infected high-grade squamous intraepithelial lesions | ||
| N_HPV: HPV-infected normal cervix | ||
| Colorectum (GSE201348) | 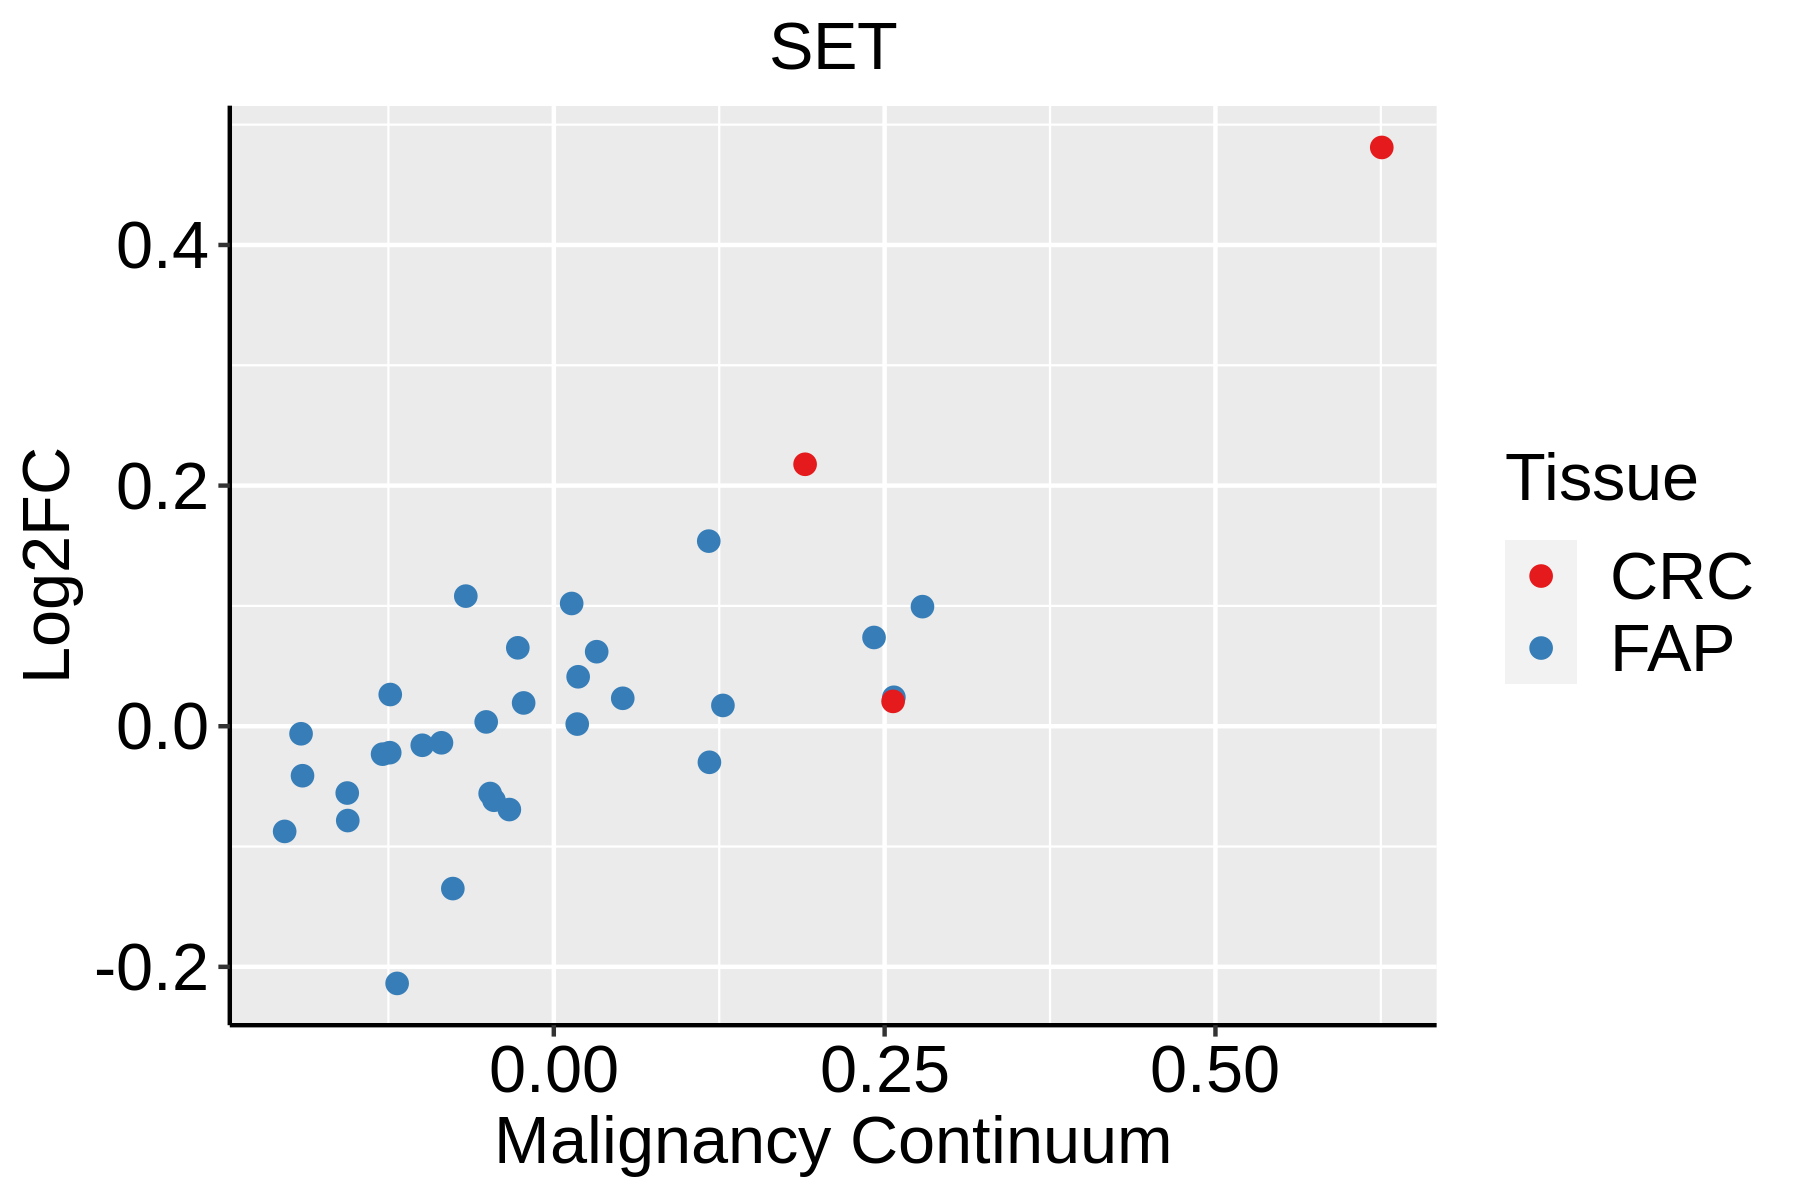 | FAP: Familial adenomatous polyposis |
| CRC: Colorectal cancer | ||
| Colorectum (HTA11) | 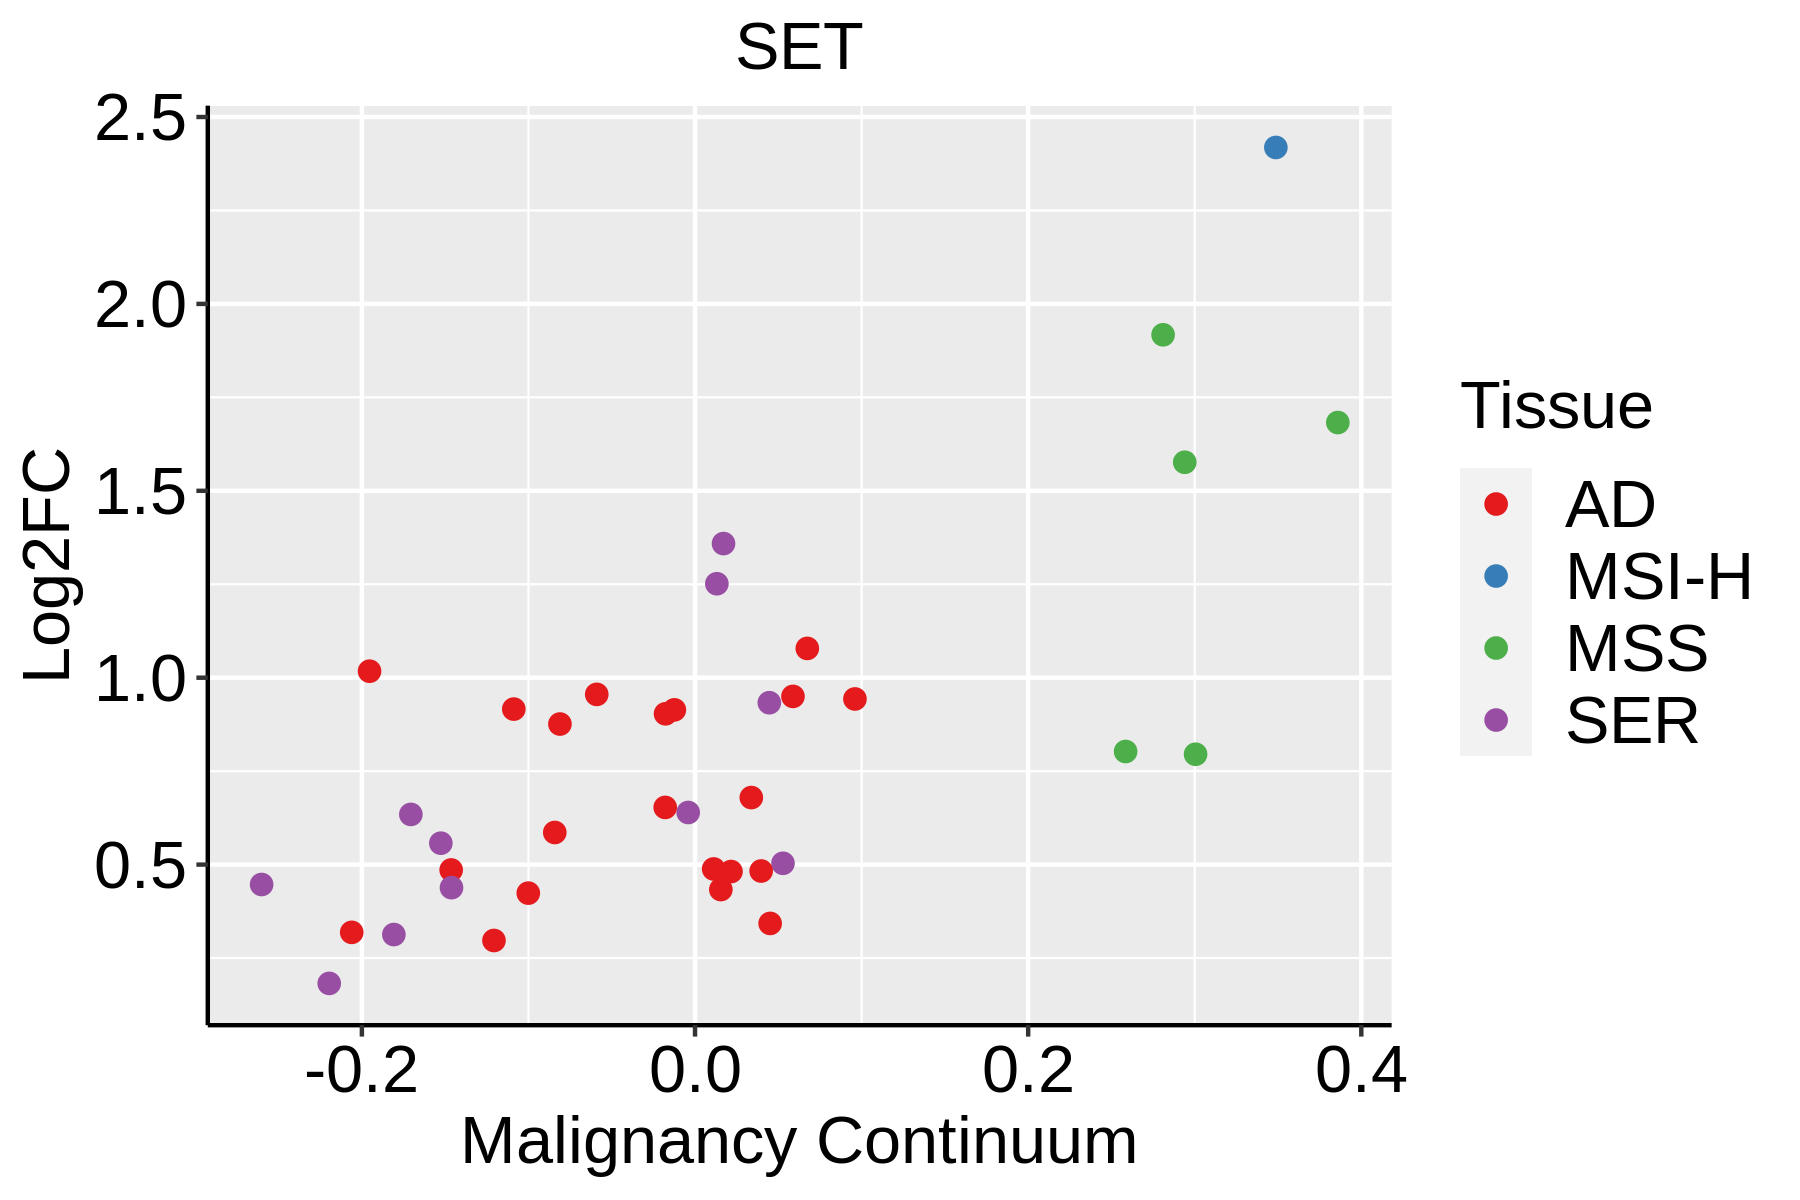 | AD: Adenomas |
| SER: Sessile serrated lesions | ||
| MSI-H: Microsatellite-high colorectal cancer | ||
| MSS: Microsatellite stable colorectal cancer | ||
| Endometrium | 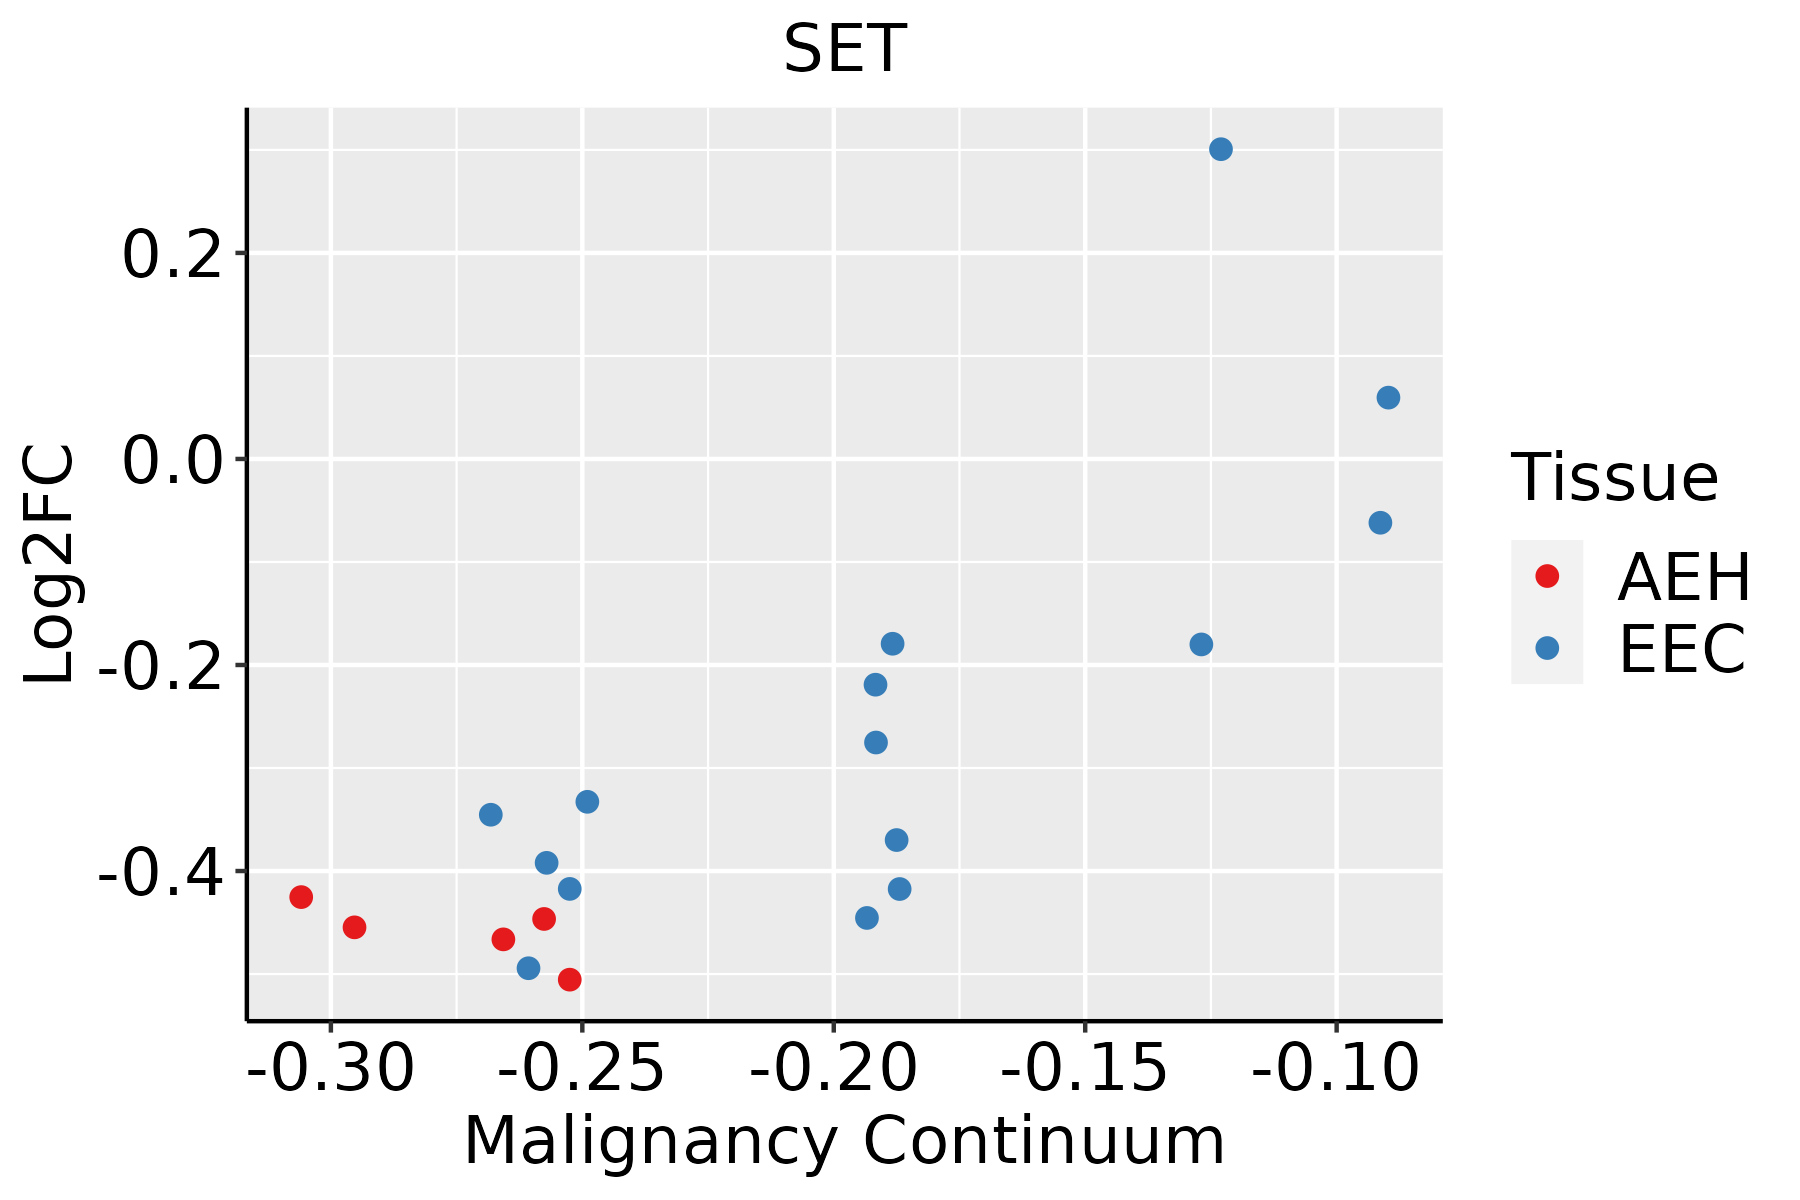 | AEH: Atypical endometrial hyperplasia |
| EEC: Endometrioid Cancer | ||
| Esophagus | 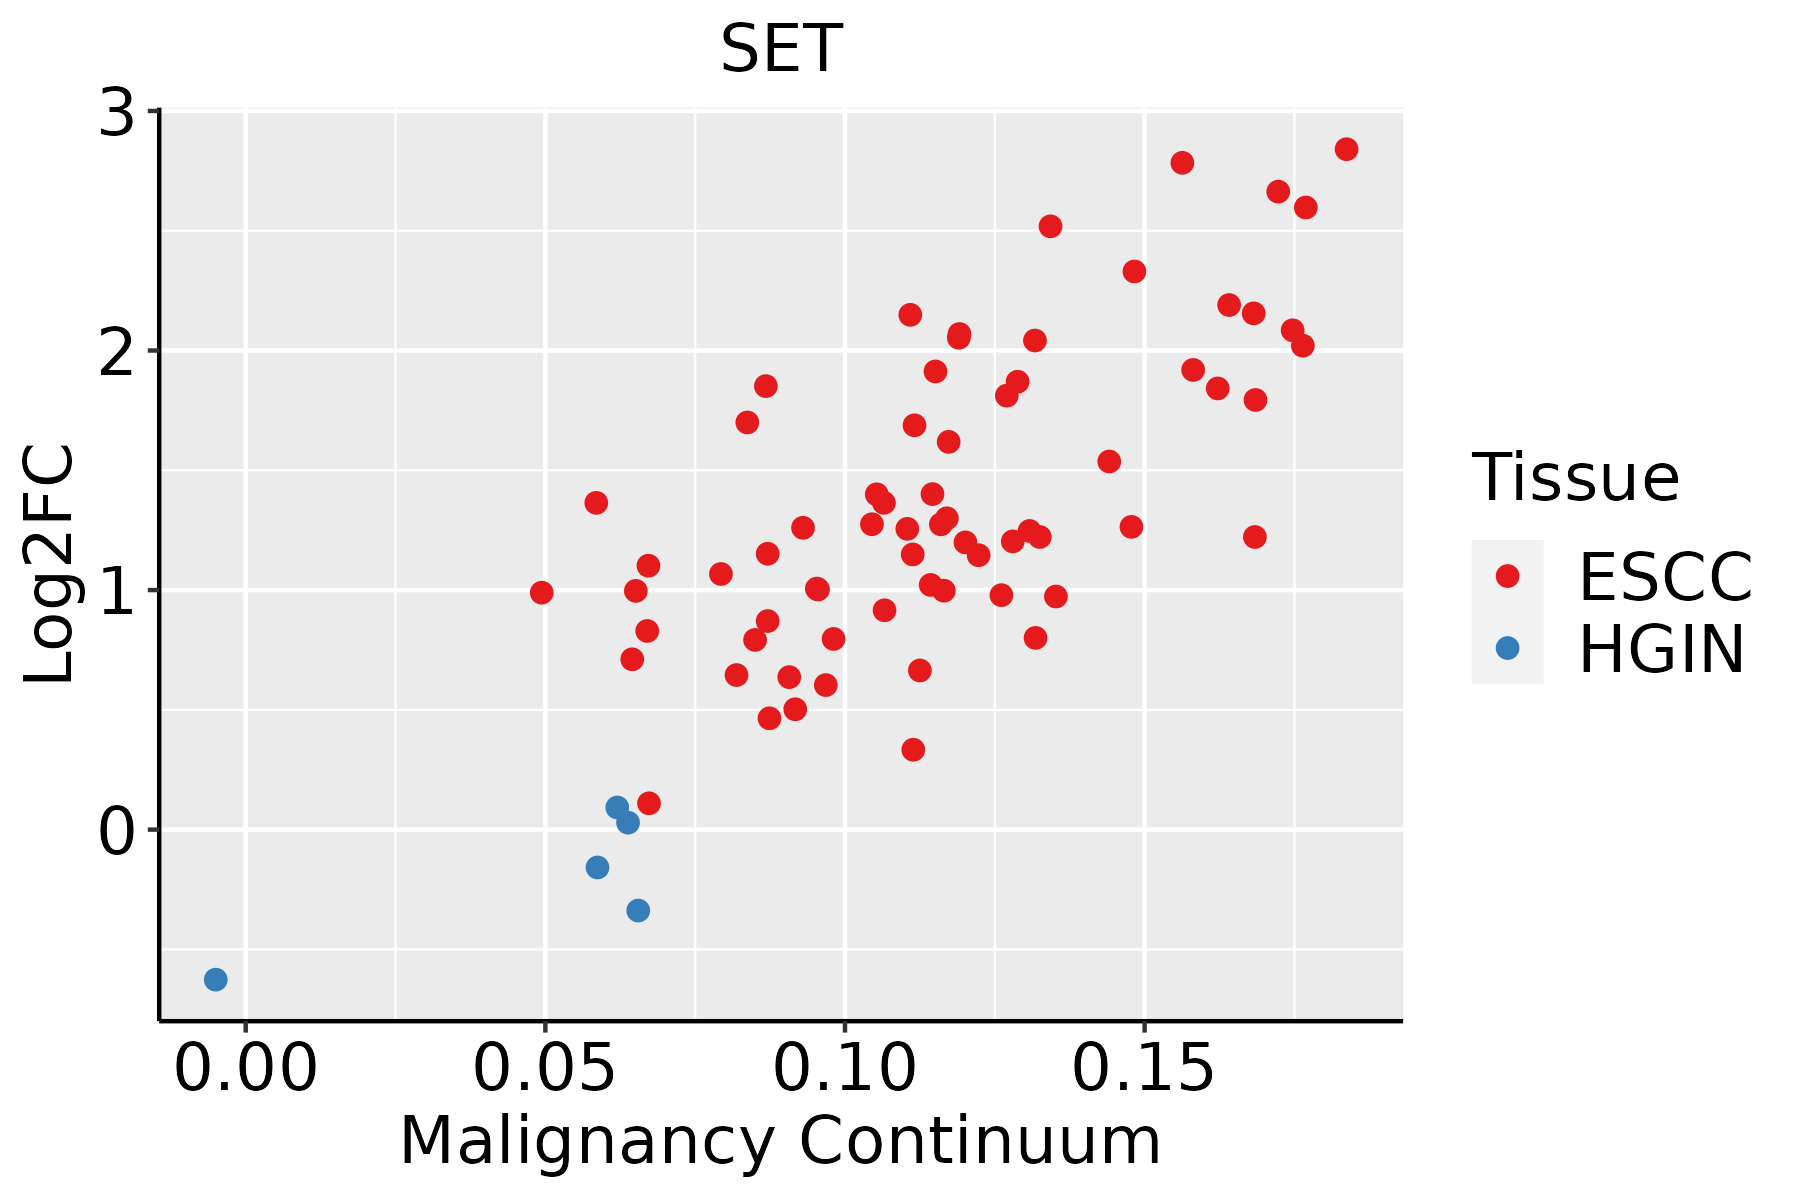 | ESCC: Esophageal squamous cell carcinoma |
| HGIN: High-grade intraepithelial neoplasias | ||
| LGIN: Low-grade intraepithelial neoplasias | ||
| Liver | 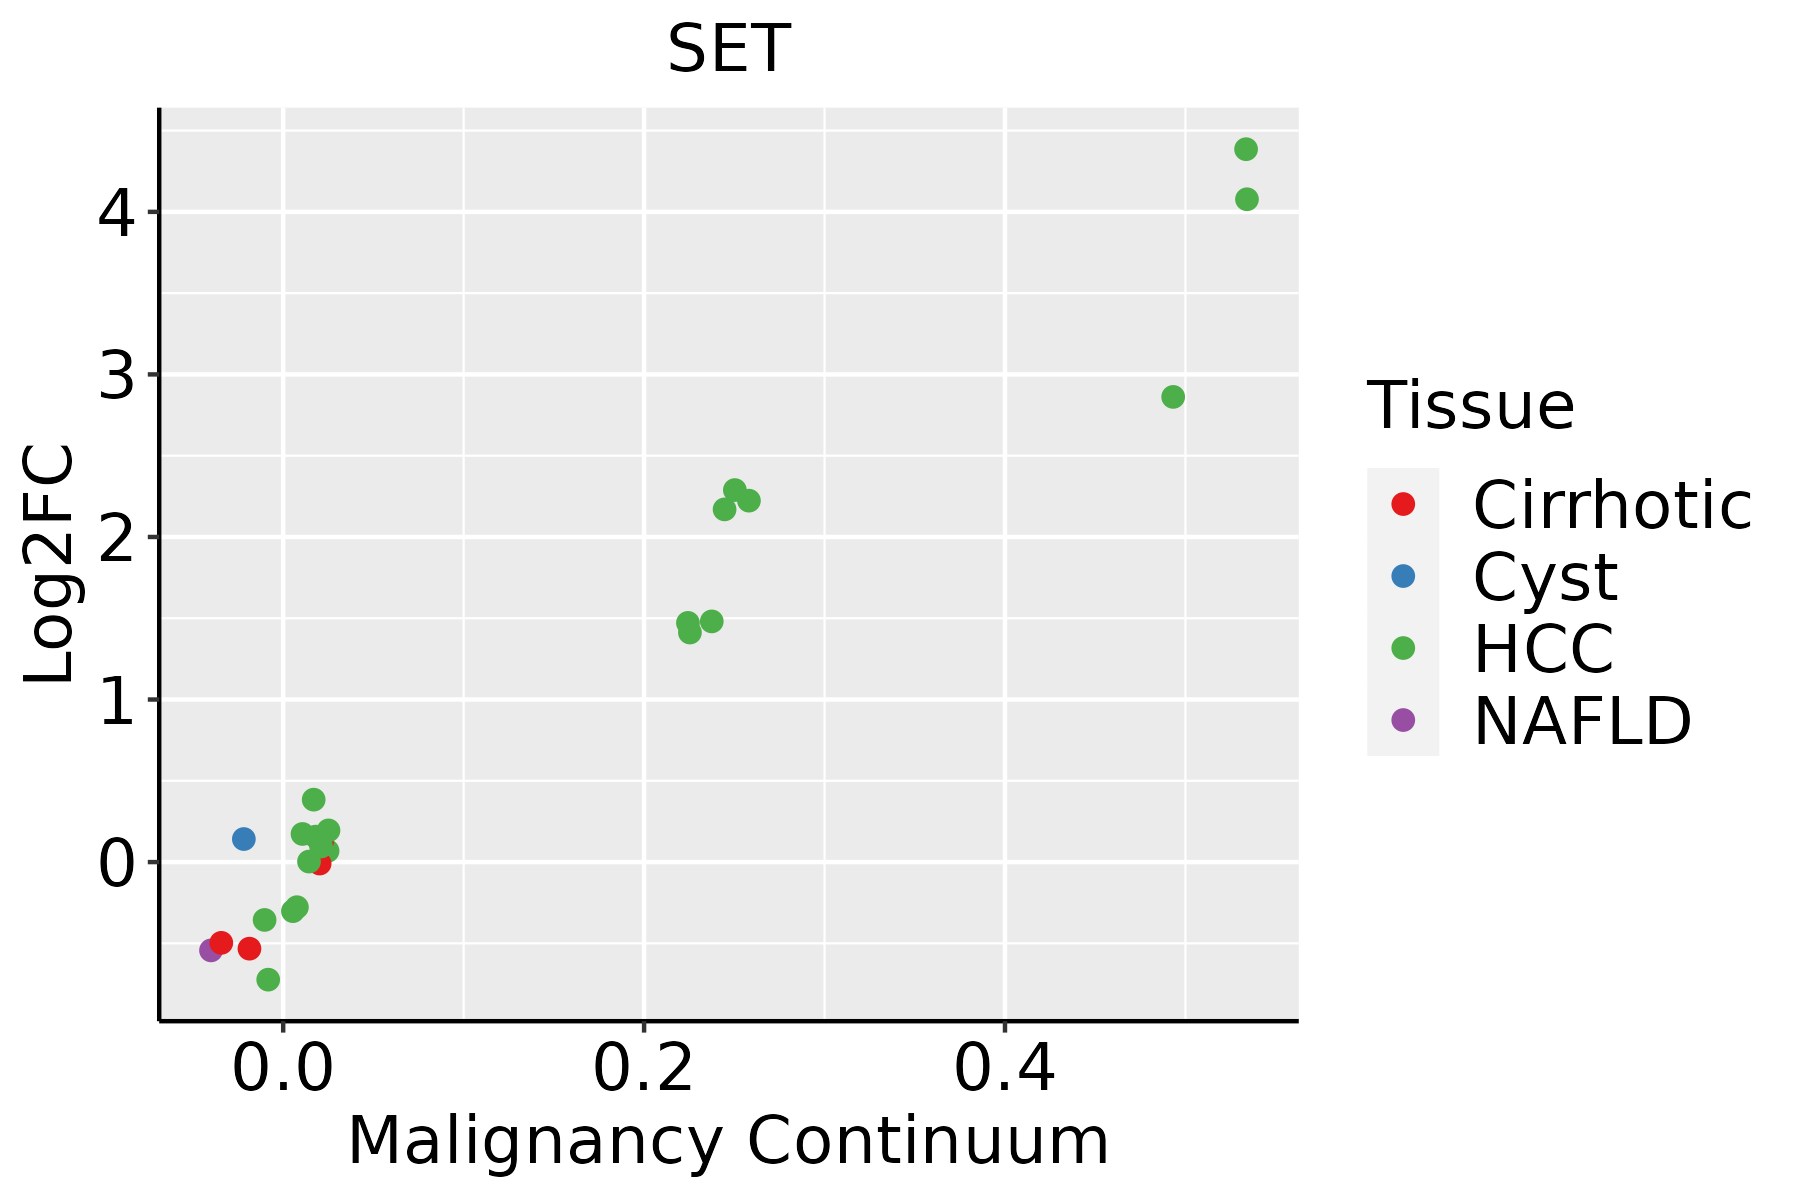 | HCC: Hepatocellular carcinoma |
| NAFLD: Non-alcoholic fatty liver disease | ||
| Oral Cavity | 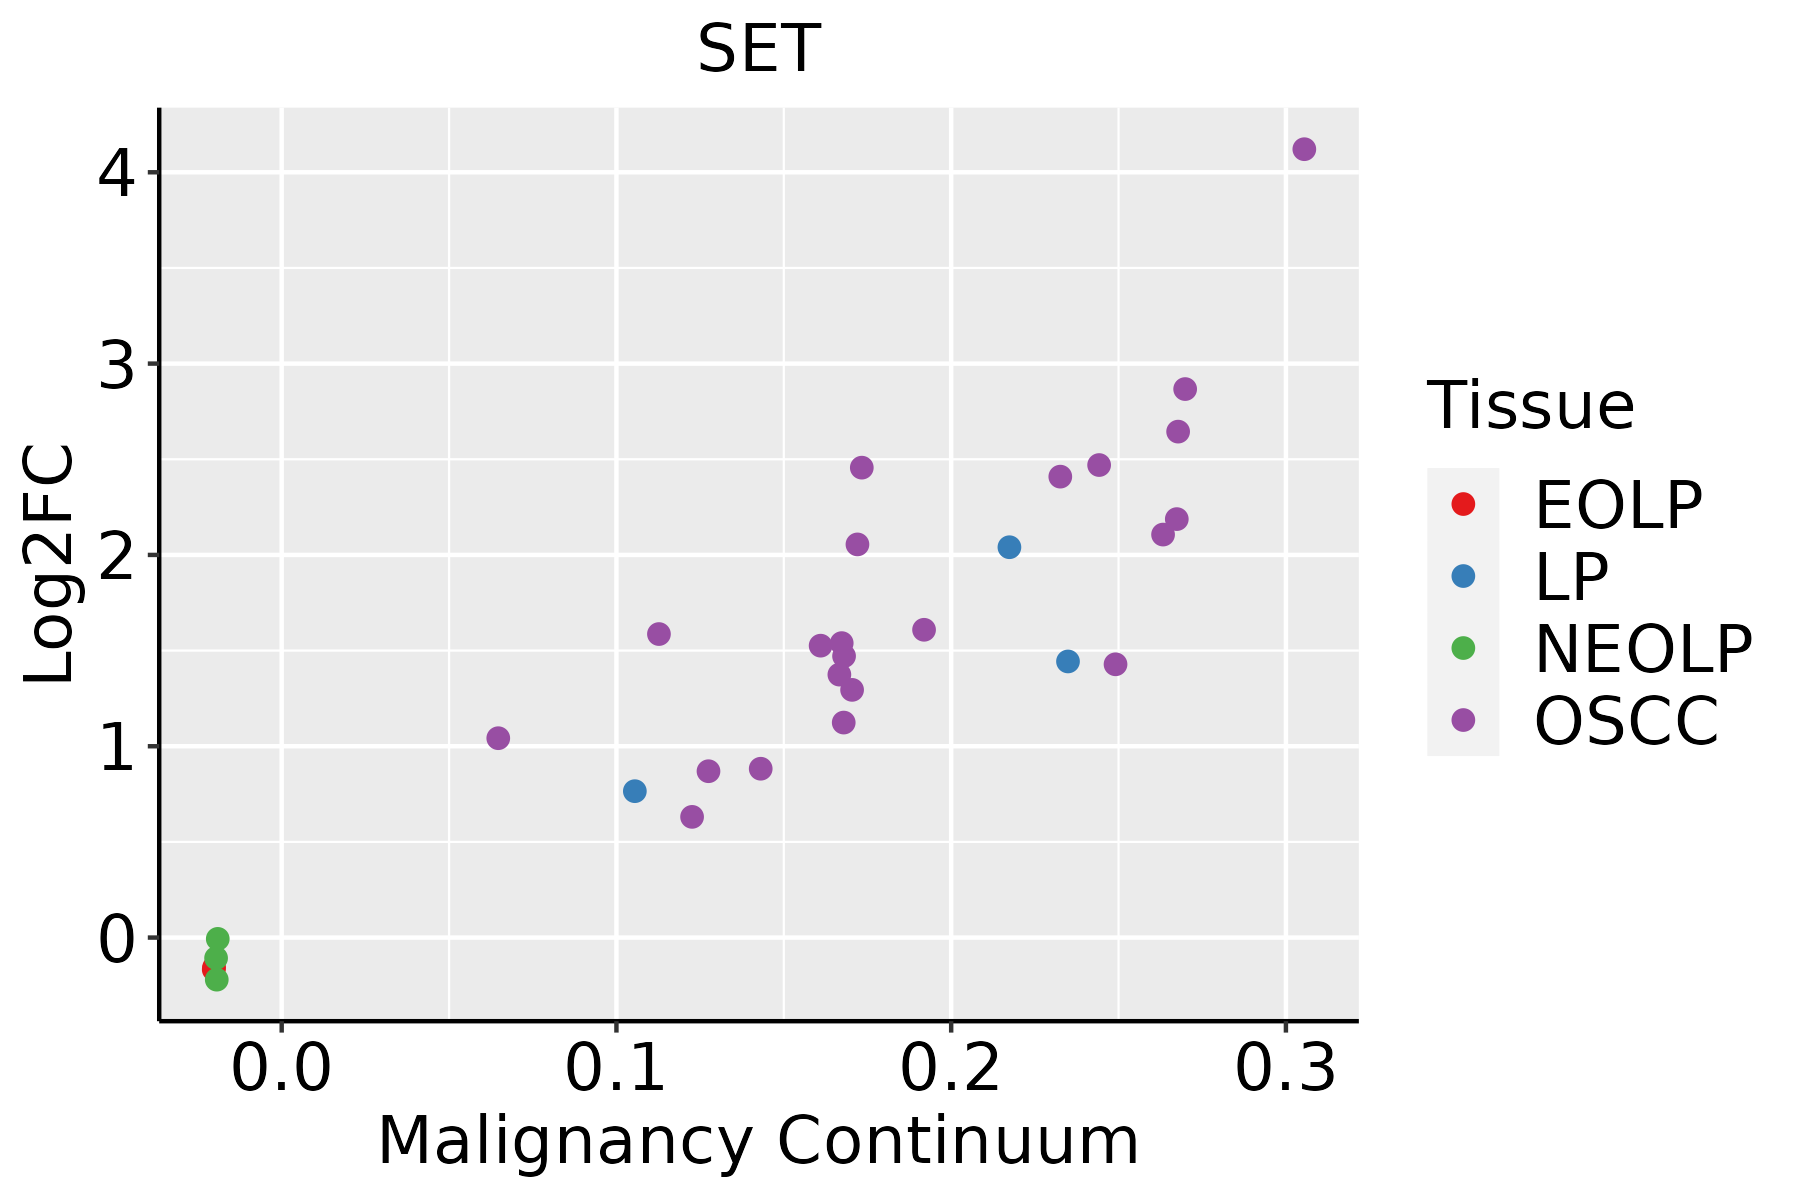 | EOLP: Erosive Oral lichen planus |
| LP: leukoplakia | ||
| NEOLP: Non-erosive oral lichen planus | ||
| OSCC: Oral squamous cell carcinoma | ||
| Prostate | 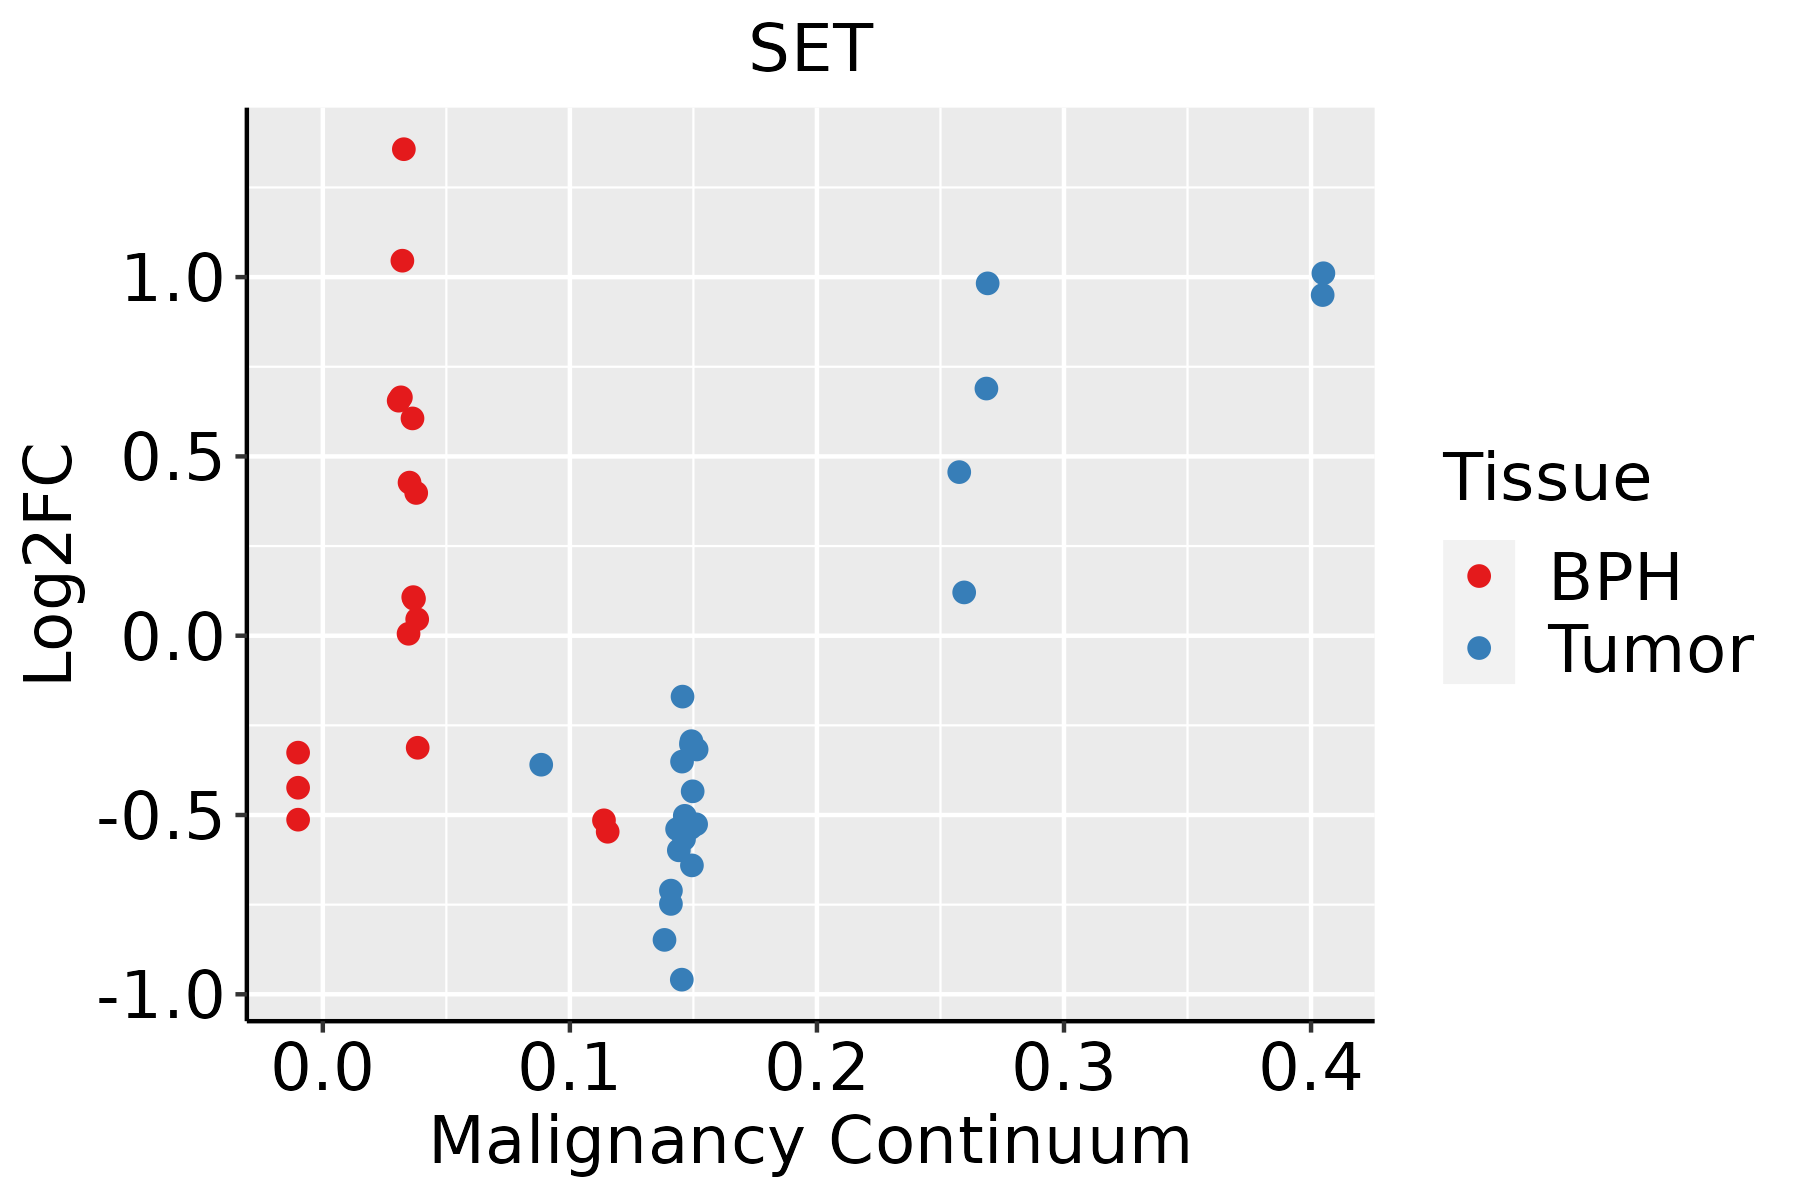 | BPH: Benign Prostatic Hyperplasia |
| Skin |  | AK: Actinic keratosis |
| cSCC: Cutaneous squamous cell carcinoma | ||
| SCCIS:squamous cell carcinoma in situ | ||
| Thyroid |  | ATC: Anaplastic thyroid cancer |
| HT: Hashimoto's thyroiditis | ||
| PTC: Papillary thyroid cancer |
| ∗log2FC in expression of this searched gene in stem-like cells from each diseased tissue sample relative to stem-like cells in normal samples in each tissue plotted against the malignancy continuum. Samples are colored based on if they are from different disease stage. |
Top |
Malignant transformation related pathway analysis |
| Find out the enriched GO biological processes and KEGG pathways involved in transition from healthy to precancer to cancer |
| Tissue | Disease Stage | Enriched GO biological Processes |
| Colorectum | AD |  |
| Colorectum | SER |  |
| Colorectum | MSS |  |
| Colorectum | MSI-H |  |
| Colorectum | FAP |  |
| ∗Top 15 enriched GO BP terms are showed in the bar plot of each disease state in each tissue. Each row represents a significant GO biological process which is colored according to the -log10(p.adjust). |
| Page: 1 2 3 4 5 6 7 8 9 |
| GO ID | Tissue | Disease Stage | Description | Gene Ratio | Bg Ratio | pvalue | p.adjust | Count |
| GO:00310601 | Liver | HCC | regulation of histone methylation | 46/7958 | 69/18723 | 4.30e-05 | 4.20e-04 | 46 |
| GO:00349681 | Liver | HCC | histone lysine methylation | 70/7958 | 115/18723 | 5.32e-05 | 5.04e-04 | 70 |
| GO:005140212 | Liver | HCC | neuron apoptotic process | 135/7958 | 246/18723 | 5.64e-05 | 5.26e-04 | 135 |
| GO:009730522 | Liver | HCC | response to alcohol | 138/7958 | 253/18723 | 6.91e-05 | 6.26e-04 | 138 |
| GO:000762321 | Liver | HCC | circadian rhythm | 117/7958 | 210/18723 | 7.29e-05 | 6.54e-04 | 117 |
| GO:0090502 | Liver | HCC | RNA phosphodiester bond hydrolysis, endonucleolytic | 52/7958 | 82/18723 | 1.06e-04 | 9.08e-04 | 52 |
| GO:004352312 | Liver | HCC | regulation of neuron apoptotic process | 117/7958 | 212/18723 | 1.25e-04 | 1.03e-03 | 117 |
| GO:00018415 | Liver | HCC | neural tube formation | 62/7958 | 102/18723 | 1.47e-04 | 1.18e-03 | 62 |
| GO:20007561 | Liver | HCC | regulation of peptidyl-lysine acetylation | 41/7958 | 63/18723 | 2.47e-04 | 1.84e-03 | 41 |
| GO:19019831 | Liver | HCC | regulation of protein acetylation | 48/7958 | 77/18723 | 3.49e-04 | 2.43e-03 | 48 |
| GO:004851121 | Liver | HCC | rhythmic process | 156/7958 | 298/18723 | 3.54e-04 | 2.46e-03 | 156 |
| GO:190121512 | Liver | HCC | negative regulation of neuron death | 113/7958 | 208/18723 | 3.68e-04 | 2.54e-03 | 113 |
| GO:20001421 | Liver | HCC | regulation of DNA-templated transcription, initiation | 28/7958 | 40/18723 | 4.01e-04 | 2.71e-03 | 28 |
| GO:000189211 | Liver | HCC | embryonic placenta development | 50/7958 | 82/18723 | 5.62e-04 | 3.61e-03 | 50 |
| GO:000189011 | Liver | HCC | placenta development | 81/7958 | 144/18723 | 5.91e-04 | 3.75e-03 | 81 |
| GO:00018433 | Liver | HCC | neural tube closure | 53/7958 | 88/18723 | 5.95e-04 | 3.75e-03 | 53 |
| GO:00468312 | Liver | HCC | regulation of RNA export from nucleus | 11/7958 | 12/18723 | 5.97e-04 | 3.75e-03 | 11 |
| GO:003239211 | Liver | HCC | DNA geometric change | 54/7958 | 90/18723 | 6.04e-04 | 3.79e-03 | 54 |
| GO:00345021 | Liver | HCC | protein localization to chromosome | 55/7958 | 92/18723 | 6.12e-04 | 3.82e-03 | 55 |
| GO:00140204 | Liver | HCC | primary neural tube formation | 56/7958 | 94/18723 | 6.19e-04 | 3.86e-03 | 56 |
| Page: 1 2 3 4 5 6 7 8 9 10 11 12 13 14 15 16 17 18 19 20 21 22 23 24 25 26 27 28 29 30 31 32 33 34 35 36 37 38 39 40 41 42 43 44 45 46 47 48 49 50 51 52 53 54 55 56 57 58 59 60 61 62 63 64 65 66 67 68 69 70 71 72 73 74 75 76 77 78 79 80 81 82 83 84 85 86 87 88 89 90 91 92 93 94 95 96 97 98 99 100 101 102 103 104 105 106 107 108 109 110 111 112 113 |
| Pathway ID | Tissue | Disease Stage | Description | Gene Ratio | Bg Ratio | pvalue | p.adjust | qvalue | Count |
| Page: 1 |
Top |
Cell-cell communication analysis |
| Identification of potential cell-cell interactions between two cell types and their ligand-receptor pairs for different disease states |
| Ligand | Receptor | LRpair | Pathway | Tissue | Disease Stage |
| Page: 1 |
Top |
Single-cell gene regulatory network inference analysis |
| Find out the significant the regulons (TFs) and the target genes of each regulon across cell types for different disease states |
| TF | Cell Type | Tissue | Disease Stage | Target Gene | RSS | Regulon Activity |
| ∗The dot plots of a searched regulon are shown for all cell subpopulations in each disease state of each tissue based on the regulon specific score inferred using pySCENIC and by calculating the average expression. |
| Page: 1 |
Top |
Somatic mutation of malignant transformation related genes |
| Annotation of somatic variants for genes involved in malignant transformation |
| Hugo Symbol | Variant Class | Variant Classification | dbSNP RS | HGVSc | HGVSp | HGVSp Short | SWISSPROT | BIOTYPE | SIFT | PolyPhen | Tumor Sample Barcode | Tissue | Histology | Sex | Age | Stage | Therapy Types | Drugs | Outcome |
| SET | SNV | Missense_Mutation | rs142648600 | c.548N>T | p.Ser183Leu | p.S183L | Q01105 | protein_coding | tolerated(0.16) | benign(0.11) | TCGA-AN-A046-01 | Breast | breast invasive carcinoma | Female | >=65 | I/II | Unknown | Unknown | SD |
| SET | SNV | Missense_Mutation | novel | c.270N>C | p.Lys90Asn | p.K90N | Q01105 | protein_coding | tolerated(0.05) | benign(0.16) | TCGA-2W-A8YY-01 | Cervix | cervical & endocervical cancer | Female | <65 | I/II | Chemotherapy | cisplatin | CR |
| SET | SNV | Missense_Mutation | c.195N>C | p.Glu65Asp | p.E65D | Q01105 | protein_coding | deleterious(0.01) | possibly_damaging(0.651) | TCGA-C5-A1MH-01 | Cervix | cervical & endocervical cancer | Female | >=65 | III/IV | Chemotherapy | cisplatin | PD | |
| SET | SNV | Missense_Mutation | novel | c.469N>A | p.His157Asn | p.H157N | Q01105 | protein_coding | tolerated(0.06) | benign(0.208) | TCGA-HM-A4S6-01 | Cervix | cervical & endocervical cancer | Female | <65 | III/IV | Chemotherapy | cisplatin | CR |
| SET | SNV | Missense_Mutation | c.229C>T | p.Arg77Cys | p.R77C | Q01105 | protein_coding | tolerated(0.11) | benign(0.444) | TCGA-CM-4746-01 | Colorectum | colon adenocarcinoma | Male | <65 | I/II | Unknown | Unknown | SD | |
| SET | SNV | Missense_Mutation | c.572G>A | p.Ser191Asn | p.S191N | Q01105 | protein_coding | tolerated(0.16) | benign(0.029) | TCGA-CM-4746-01 | Colorectum | colon adenocarcinoma | Male | <65 | I/II | Unknown | Unknown | SD | |
| SET | SNV | Missense_Mutation | c.260N>C | p.Leu87Ser | p.L87S | Q01105 | protein_coding | deleterious(0) | probably_damaging(0.974) | TCGA-F4-6570-01 | Colorectum | colon adenocarcinoma | Female | >=65 | I/II | Unknown | Unknown | SD | |
| SET | SNV | Missense_Mutation | c.508N>A | p.Glu170Lys | p.E170K | Q01105 | protein_coding | tolerated(0.18) | benign(0.086) | TCGA-G4-6628-01 | Colorectum | colon adenocarcinoma | Male | >=65 | I/II | Unknown | Unknown | SD | |
| SET | deletion | Frame_Shift_Del | c.273delN | p.Pro92GlnfsTer5 | p.P92Qfs*5 | Q01105 | protein_coding | TCGA-CM-5862-01 | Colorectum | colon adenocarcinoma | Male | >=65 | I/II | Unknown | Unknown | PD | |||
| SET | SNV | Missense_Mutation | novel | c.161N>C | p.Glu54Ala | p.E54A | Q01105 | protein_coding | tolerated(0.06) | possibly_damaging(0.893) | TCGA-A5-A0G2-01 | Endometrium | uterine corpus endometrioid carcinoma | Female | <65 | III/IV | Unknown | Unknown | SD |
| Page: 1 2 3 4 |
Top |
Related drugs of malignant transformation related genes |
| Identification of chemicals and drugs interact with genes involved in malignant transfromation |
| (DGIdb 4.0) |
| Entrez ID | Symbol | Category | Interaction Types | Drug Claim Name | Drug Name | PMIDs |
| Page: 1 |

Copyright 2023-Present -The University of Texas Health Science Center at Houston |