
|
|||||
|
 | |
| |
| |
| |
| |
| |
|
Gene: GABARAP |
Gene summary for GABARAP |
| Gene information | Species | Human | Gene symbol | GABARAP | Gene ID | 11337 |
| Gene name | GABA type A receptor-associated protein | |
| Gene Alias | ATG8A | |
| Cytomap | 17p13.1 | |
| Gene Type | protein-coding | GO ID | GO:0000045 | UniProtAcc | O95166 |
Top |
Malignant transformation analysis |
| Identification of the aberrant gene expression in precancerous and cancerous lesions by comparing the gene expression of stem-like cells in diseased tissues with normal stem cells |
| Entrez ID | Symbol | Replicates | Species | Organ | Tissue | Adj P-value | Log2FC | Malignancy |
| 11337 | GABARAP | CA_HPV_1 | Human | Cervix | CC | 1.07e-06 | 3.58e-01 | 0.0264 |
| 11337 | GABARAP | N_HPV_2 | Human | Cervix | N_HPV | 2.33e-05 | 3.15e-01 | -0.0131 |
| 11337 | GABARAP | CCI_1 | Human | Cervix | CC | 7.94e-03 | -3.60e-01 | 0.528 |
| 11337 | GABARAP | CCI_3 | Human | Cervix | CC | 3.28e-02 | -3.44e-01 | 0.516 |
| 11337 | GABARAP | CCII_1 | Human | Cervix | CC | 1.26e-02 | -3.26e-01 | 0.3249 |
| 11337 | GABARAP | Tumor | Human | Cervix | CC | 1.01e-03 | -2.37e-01 | 0.1241 |
| 11337 | GABARAP | sample1 | Human | Cervix | CC | 6.35e-03 | 4.06e-01 | 0.0959 |
| 11337 | GABARAP | sample3 | Human | Cervix | CC | 3.97e-19 | 5.25e-01 | 0.1387 |
| 11337 | GABARAP | H2 | Human | Cervix | HSIL_HPV | 1.94e-26 | 6.76e-01 | 0.0632 |
| 11337 | GABARAP | L1 | Human | Cervix | CC | 1.94e-14 | 6.05e-01 | 0.0802 |
| 11337 | GABARAP | T1 | Human | Cervix | CC | 4.04e-03 | 3.09e-01 | 0.0918 |
| 11337 | GABARAP | T2 | Human | Cervix | CC | 5.79e-06 | 5.43e-01 | 0.0709 |
| 11337 | GABARAP | T3 | Human | Cervix | CC | 1.17e-18 | 5.50e-01 | 0.1389 |
| 11337 | GABARAP | AEH-subject1 | Human | Endometrium | AEH | 9.75e-22 | 6.29e-01 | -0.3059 |
| 11337 | GABARAP | AEH-subject2 | Human | Endometrium | AEH | 9.74e-21 | 6.07e-01 | -0.2525 |
| 11337 | GABARAP | AEH-subject3 | Human | Endometrium | AEH | 1.45e-24 | 6.82e-01 | -0.2576 |
| 11337 | GABARAP | AEH-subject4 | Human | Endometrium | AEH | 1.41e-10 | 4.52e-01 | -0.2657 |
| 11337 | GABARAP | AEH-subject5 | Human | Endometrium | AEH | 2.87e-18 | 5.19e-01 | -0.2953 |
| 11337 | GABARAP | EEC-subject1 | Human | Endometrium | EEC | 1.60e-17 | 5.12e-01 | -0.2682 |
| 11337 | GABARAP | EEC-subject2 | Human | Endometrium | EEC | 1.21e-10 | 4.36e-01 | -0.2607 |
| Page: 1 2 3 4 5 6 7 8 9 10 11 12 13 |
| Tissue | Expression Dynamics | Abbreviation |
| Cervix | 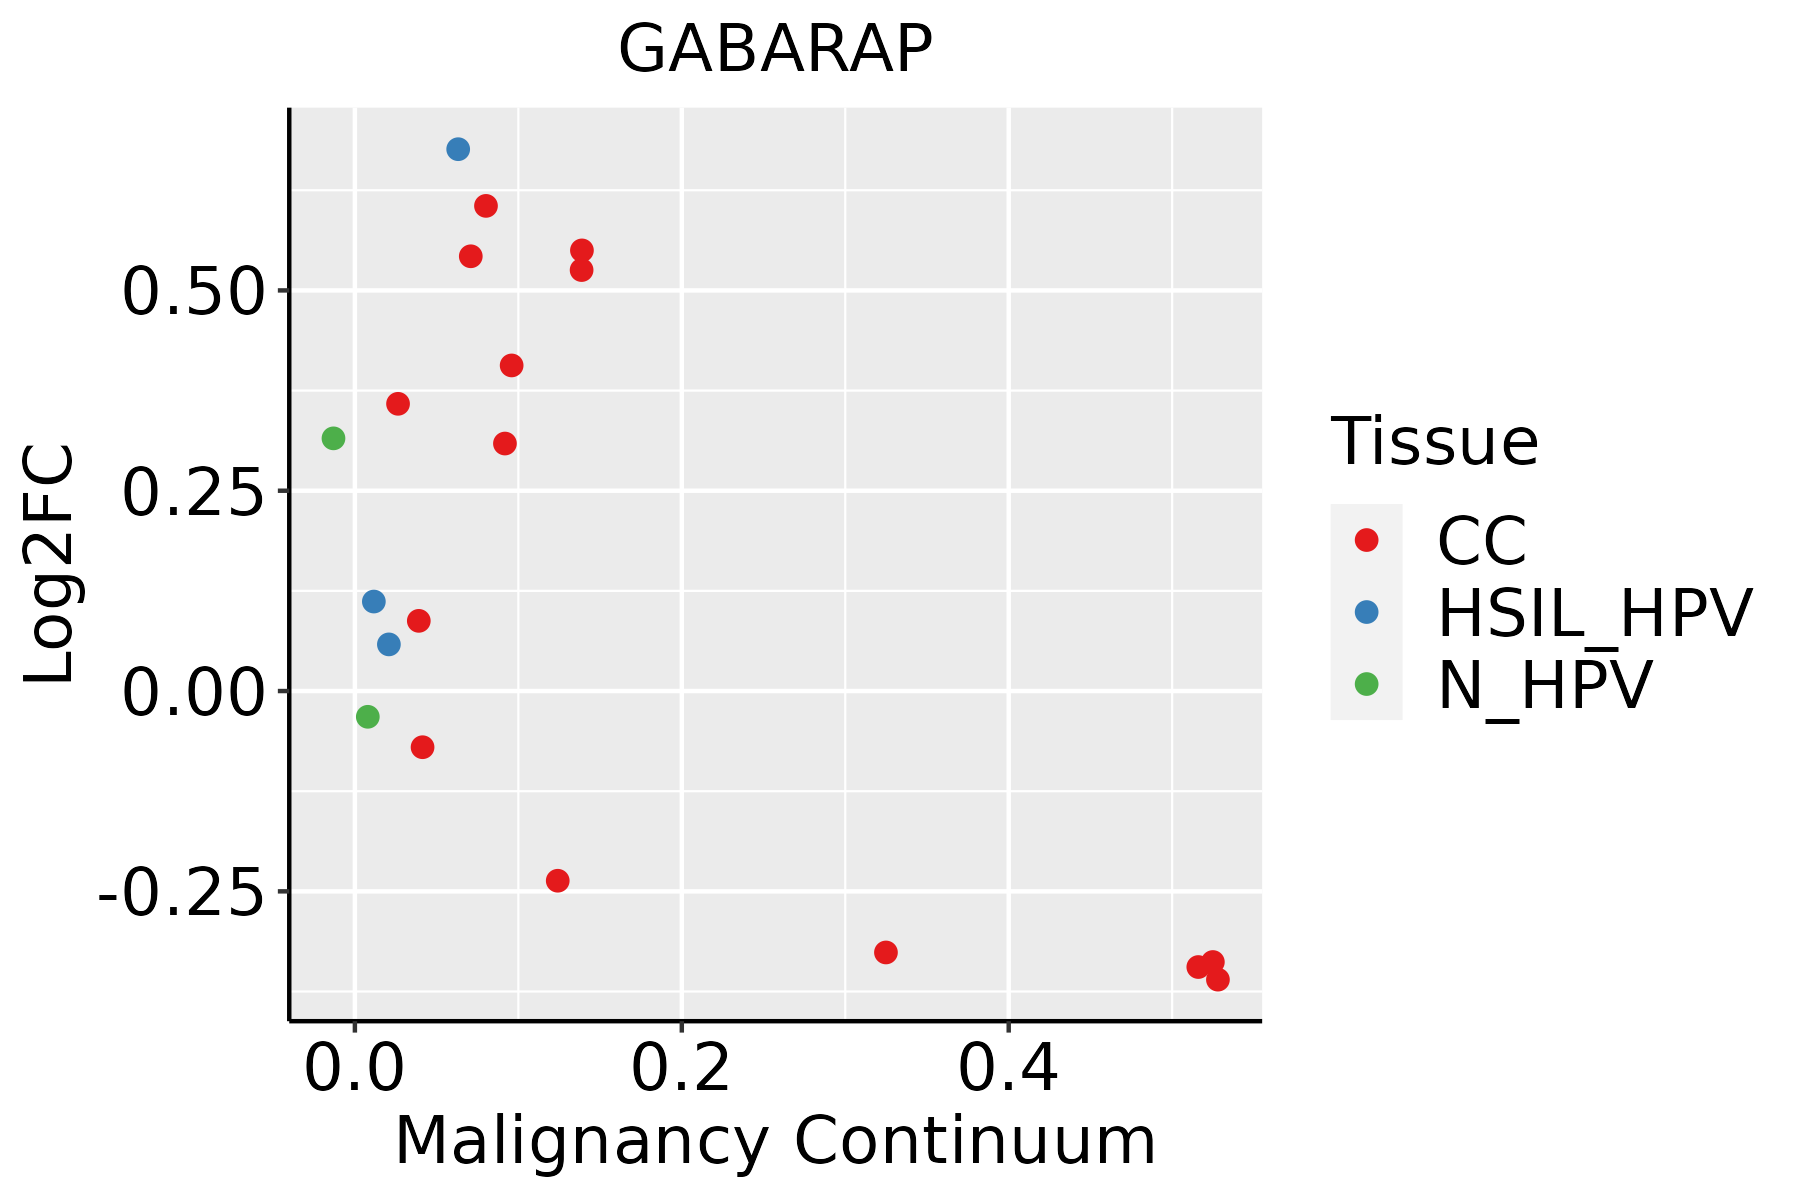 | CC: Cervix cancer |
| HSIL_HPV: HPV-infected high-grade squamous intraepithelial lesions | ||
| N_HPV: HPV-infected normal cervix | ||
| Endometrium | 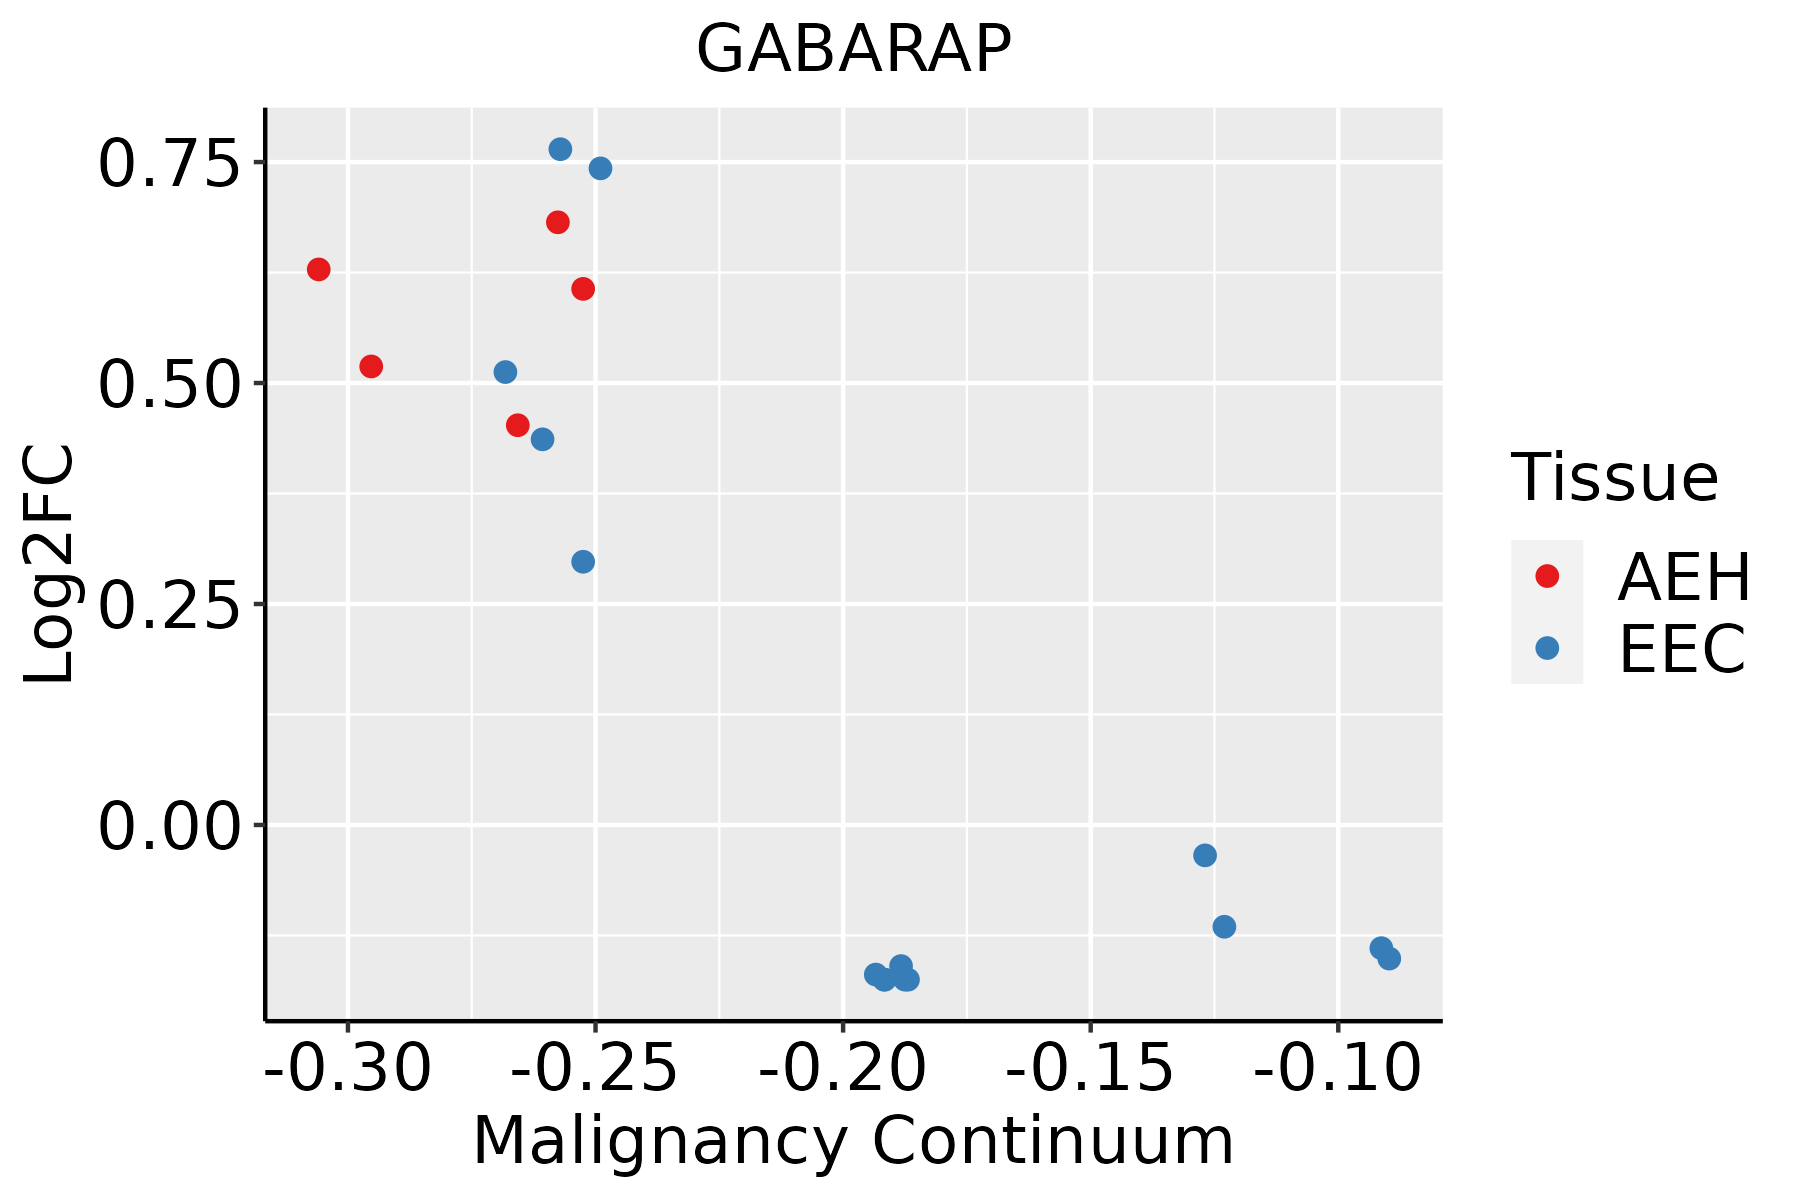 | AEH: Atypical endometrial hyperplasia |
| EEC: Endometrioid Cancer | ||
| Esophagus | 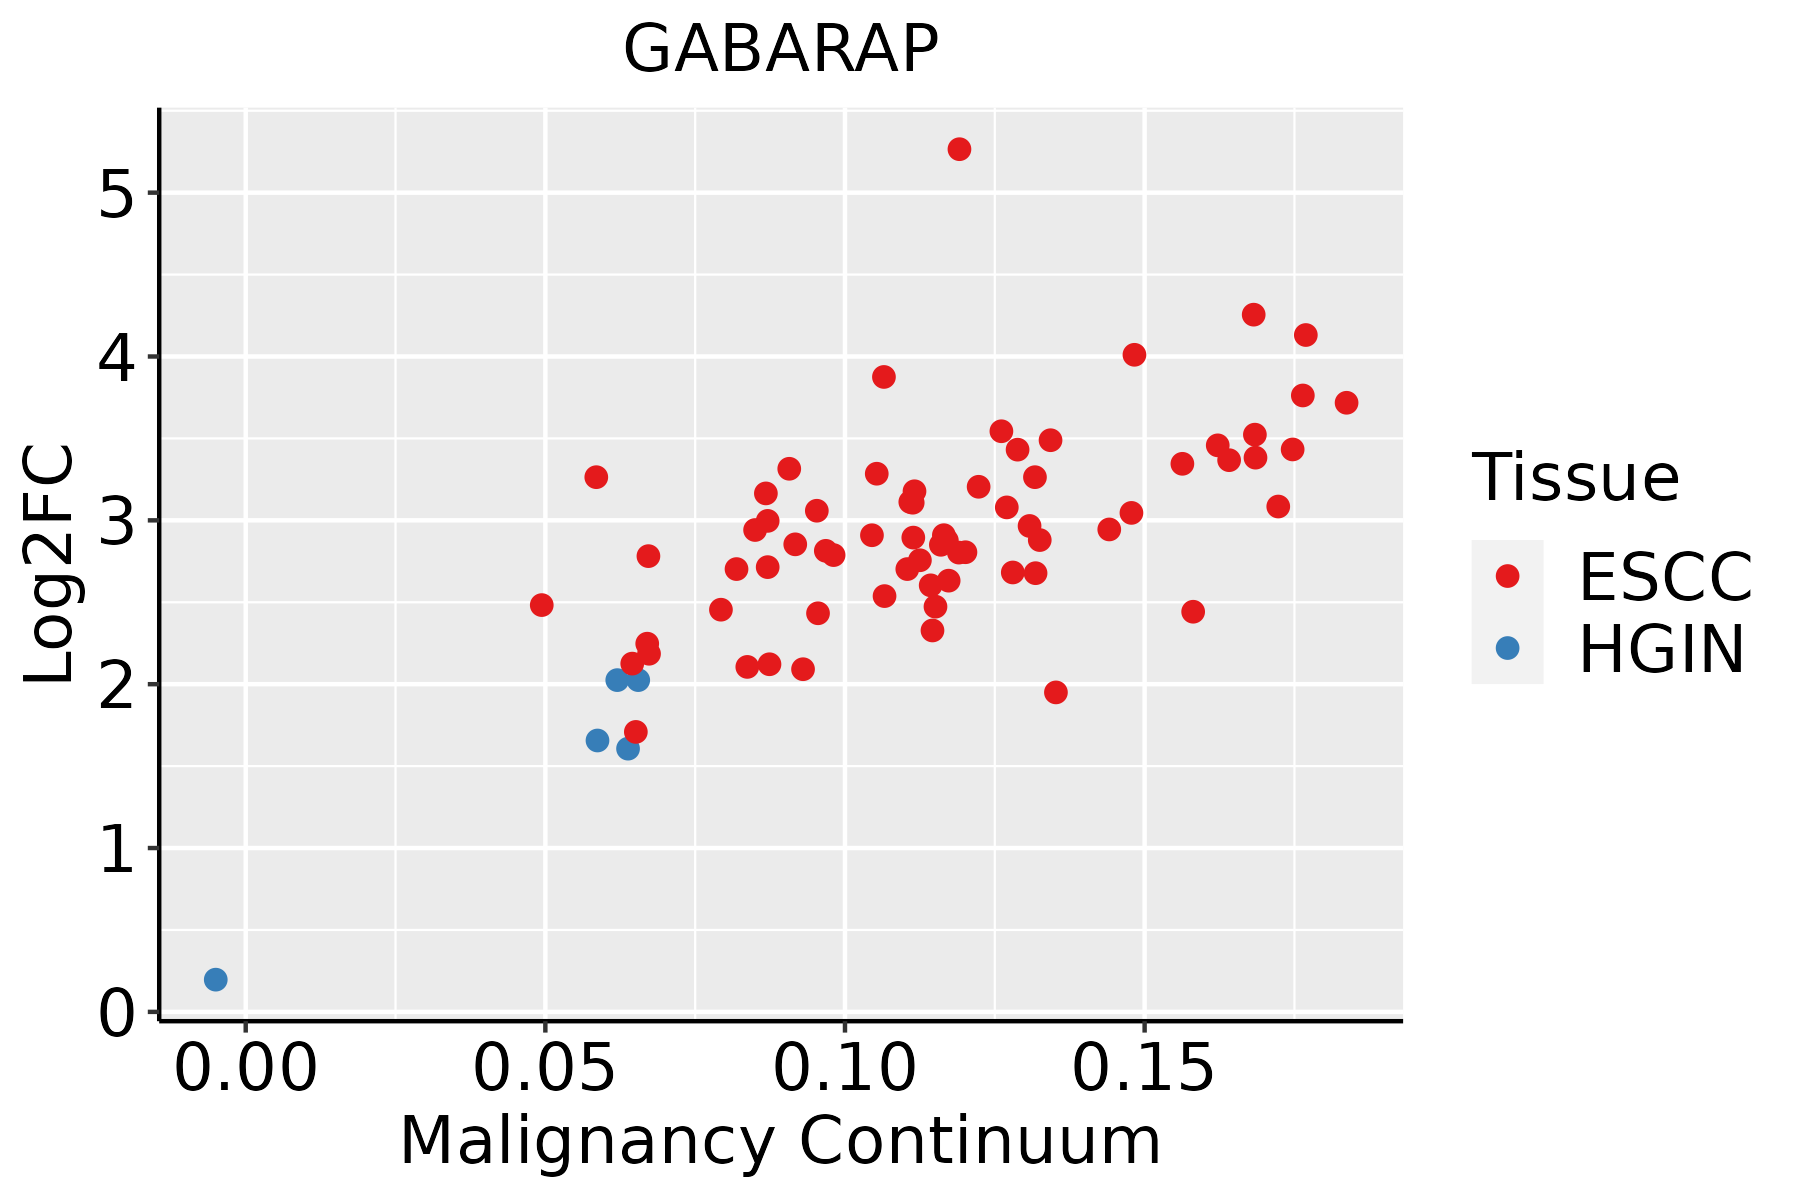 | ESCC: Esophageal squamous cell carcinoma |
| HGIN: High-grade intraepithelial neoplasias | ||
| LGIN: Low-grade intraepithelial neoplasias | ||
| GC | 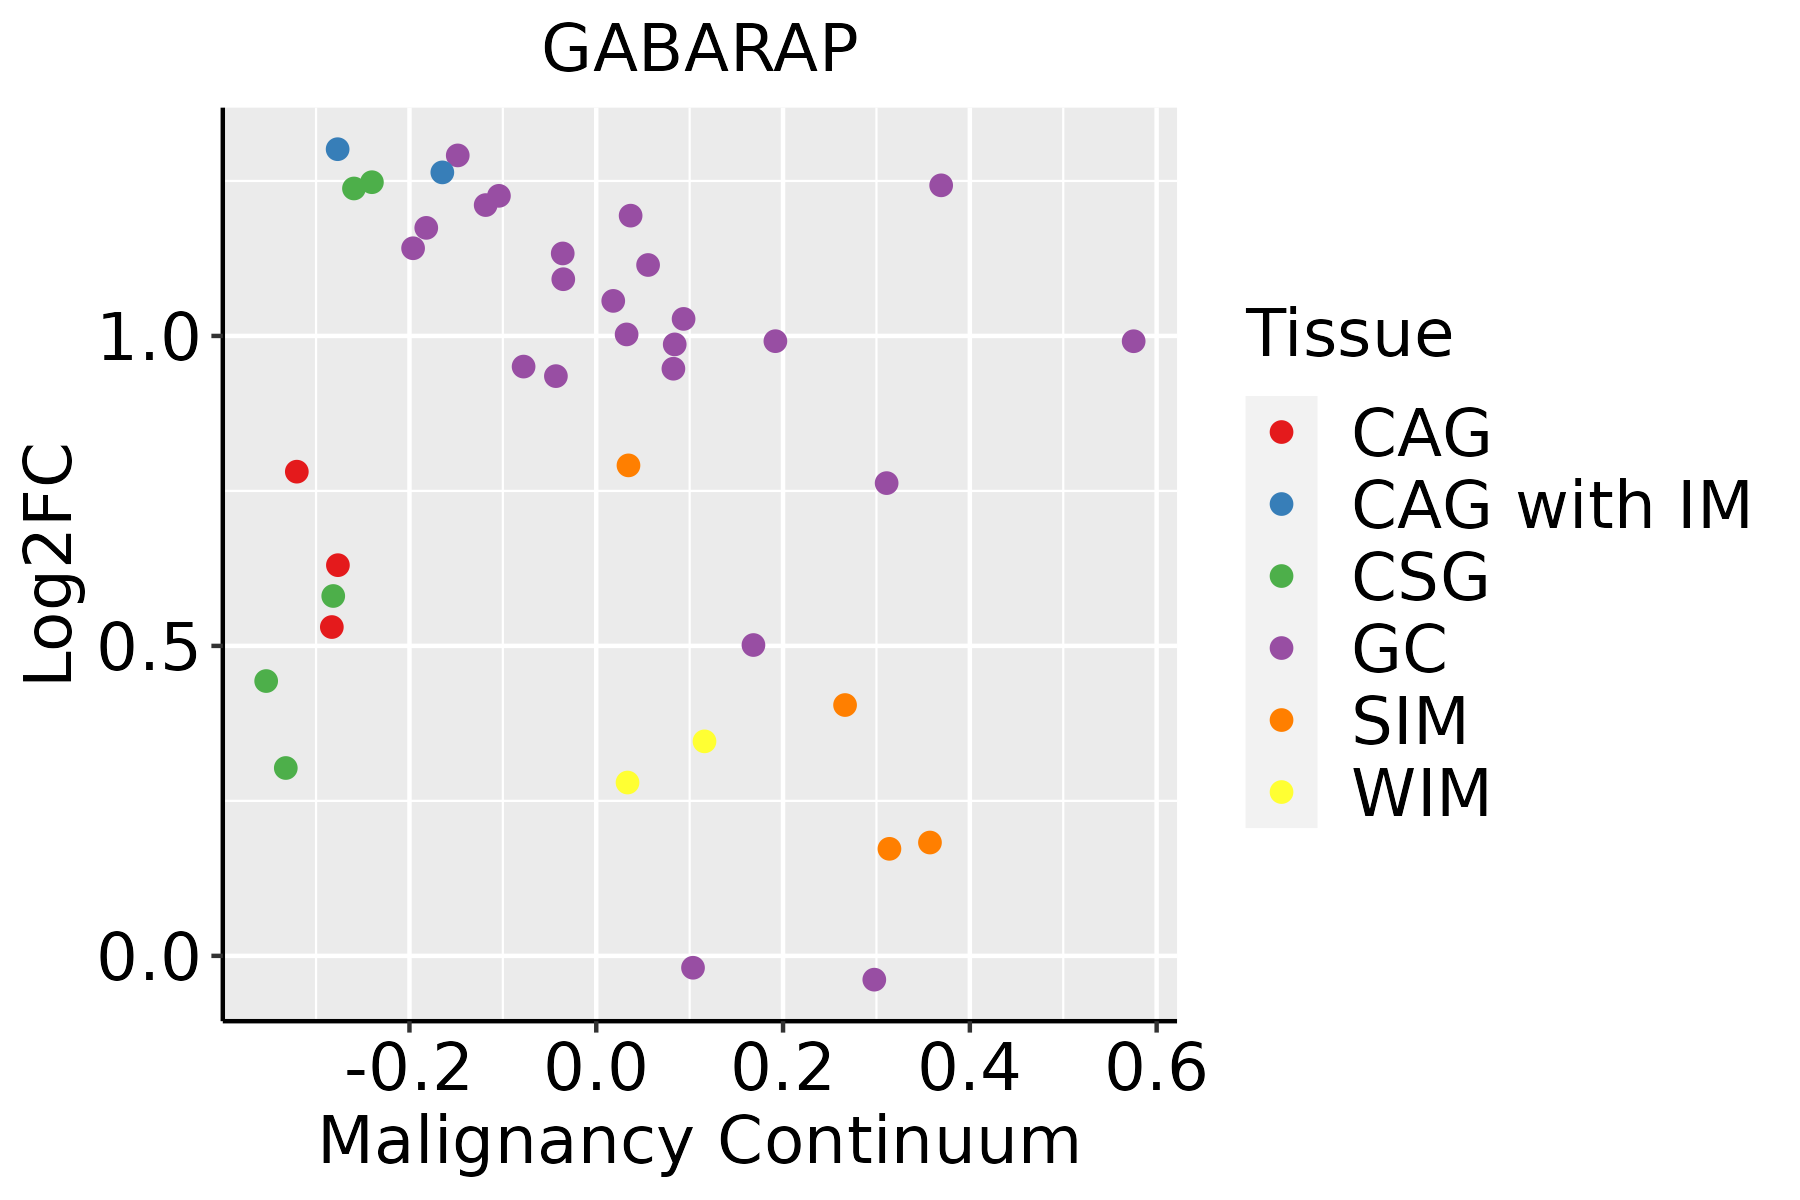 | CAG: Chronic atrophic gastritis |
| CAG with IM: Chronic atrophic gastritis with intestinal metaplasia | ||
| CSG: Chronic superficial gastritis | ||
| GC: Gastric cancer | ||
| SIM: Severe intestinal metaplasia | ||
| WIM: Wild intestinal metaplasia | ||
| Liver | 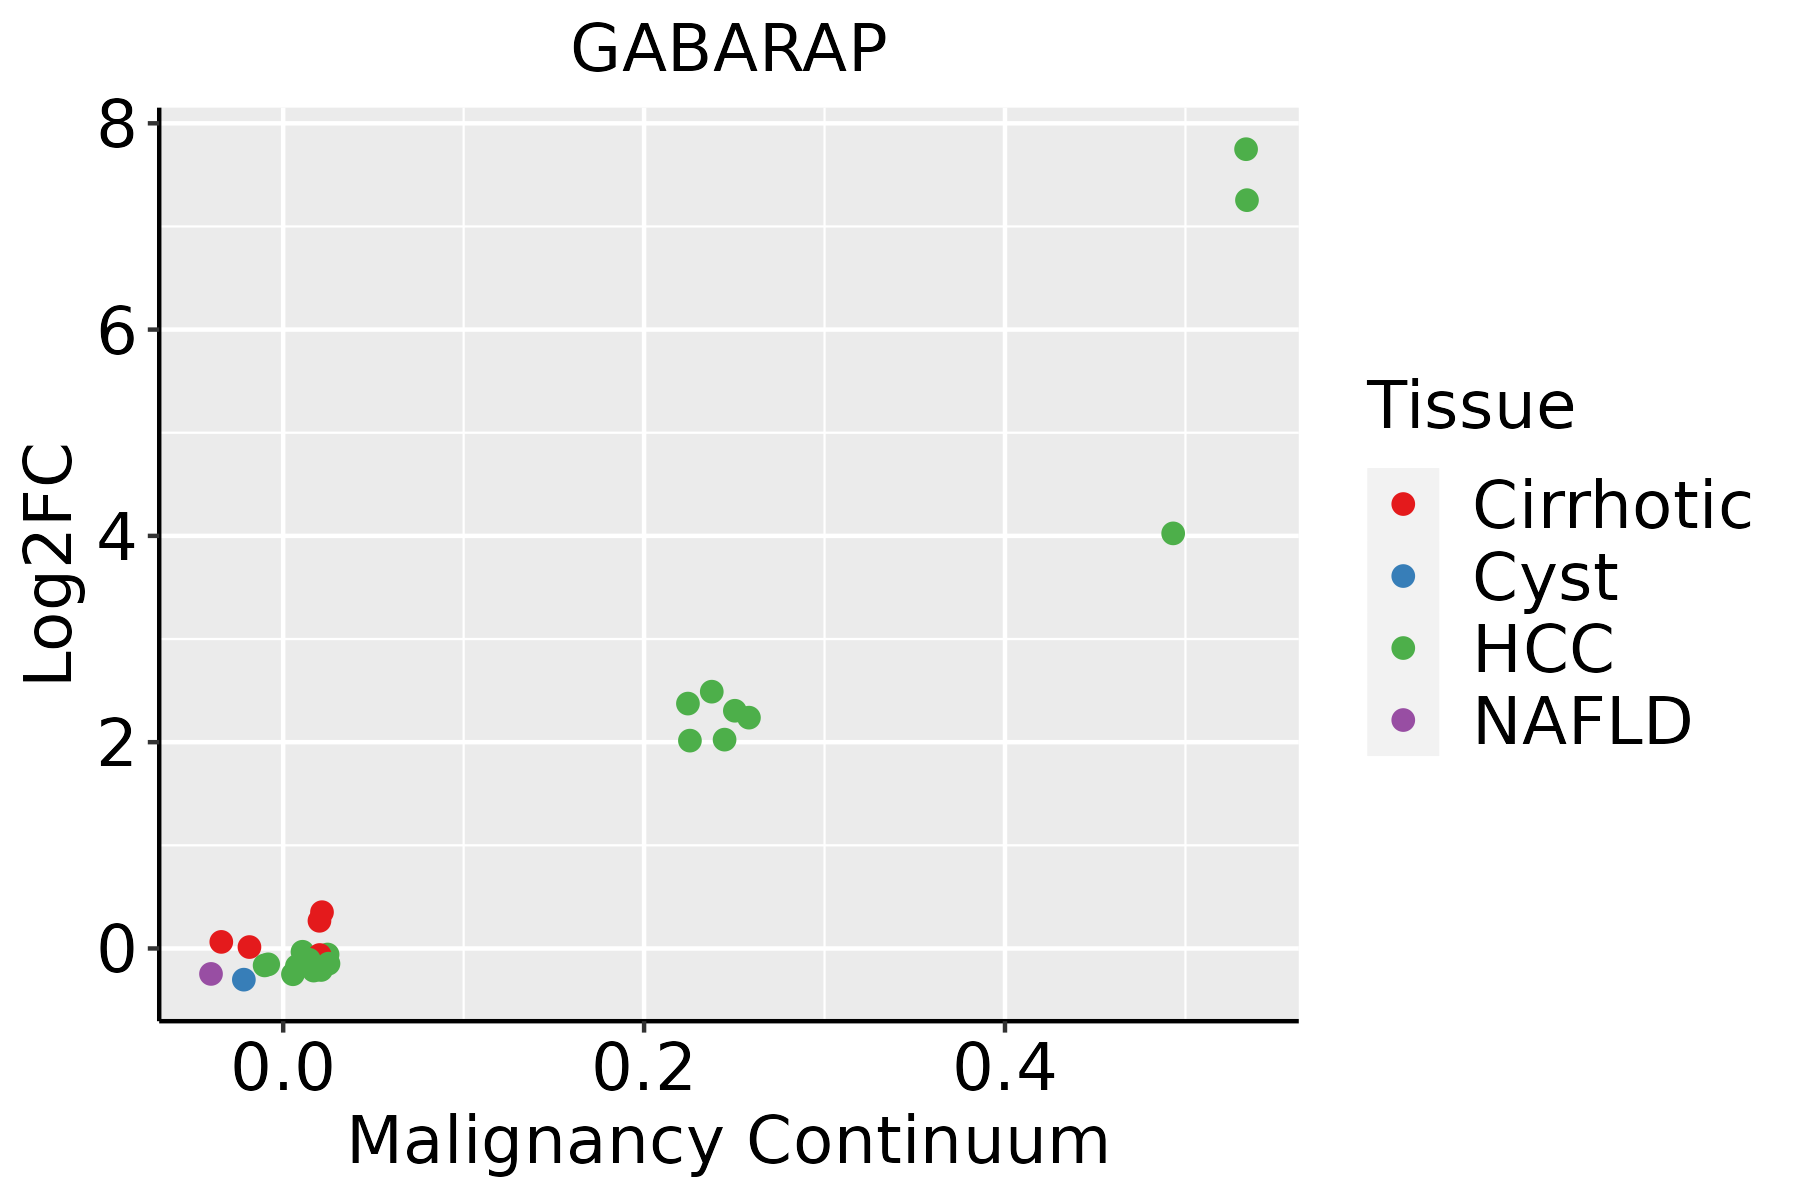 | HCC: Hepatocellular carcinoma |
| NAFLD: Non-alcoholic fatty liver disease | ||
| Lung | 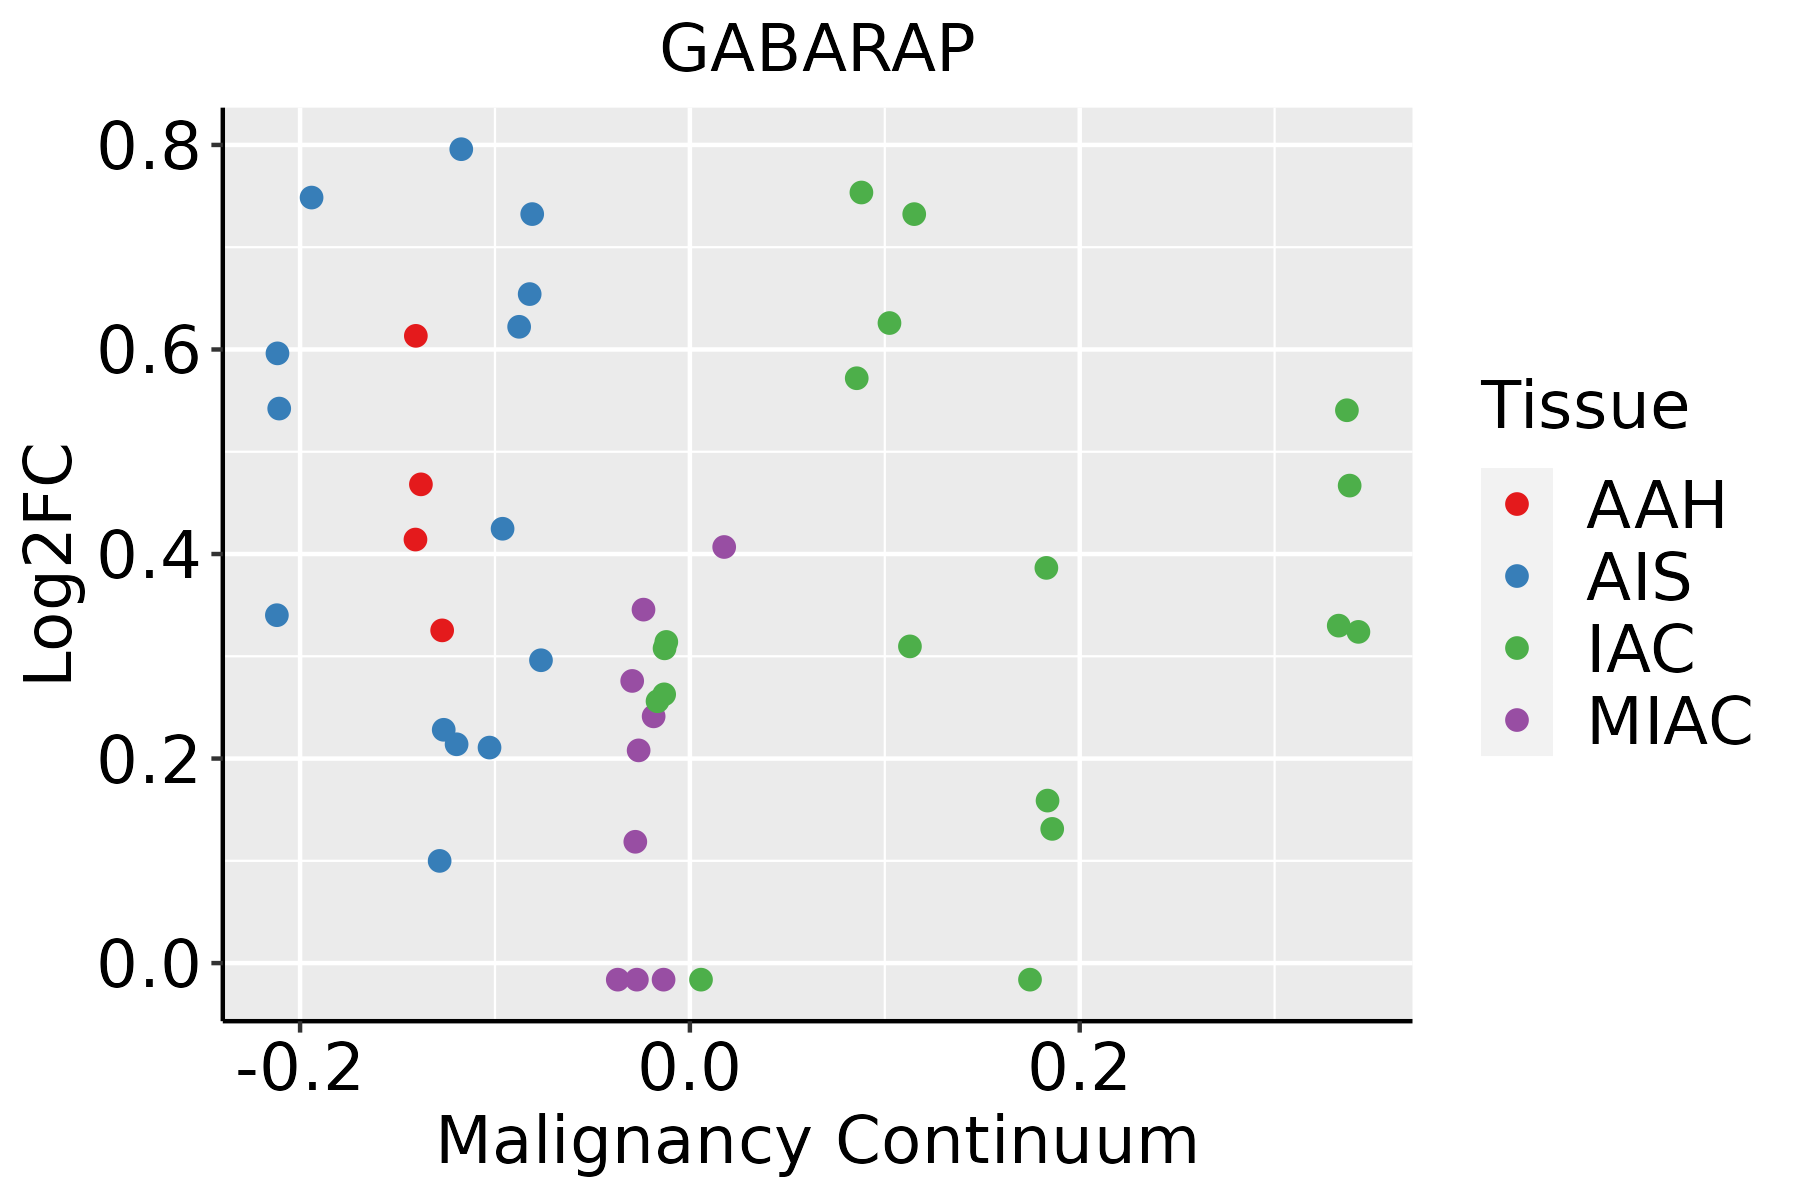 | AAH: Atypical adenomatous hyperplasia |
| AIS: Adenocarcinoma in situ | ||
| IAC: Invasive lung adenocarcinoma | ||
| MIA: Minimally invasive adenocarcinoma | ||
| Oral Cavity | 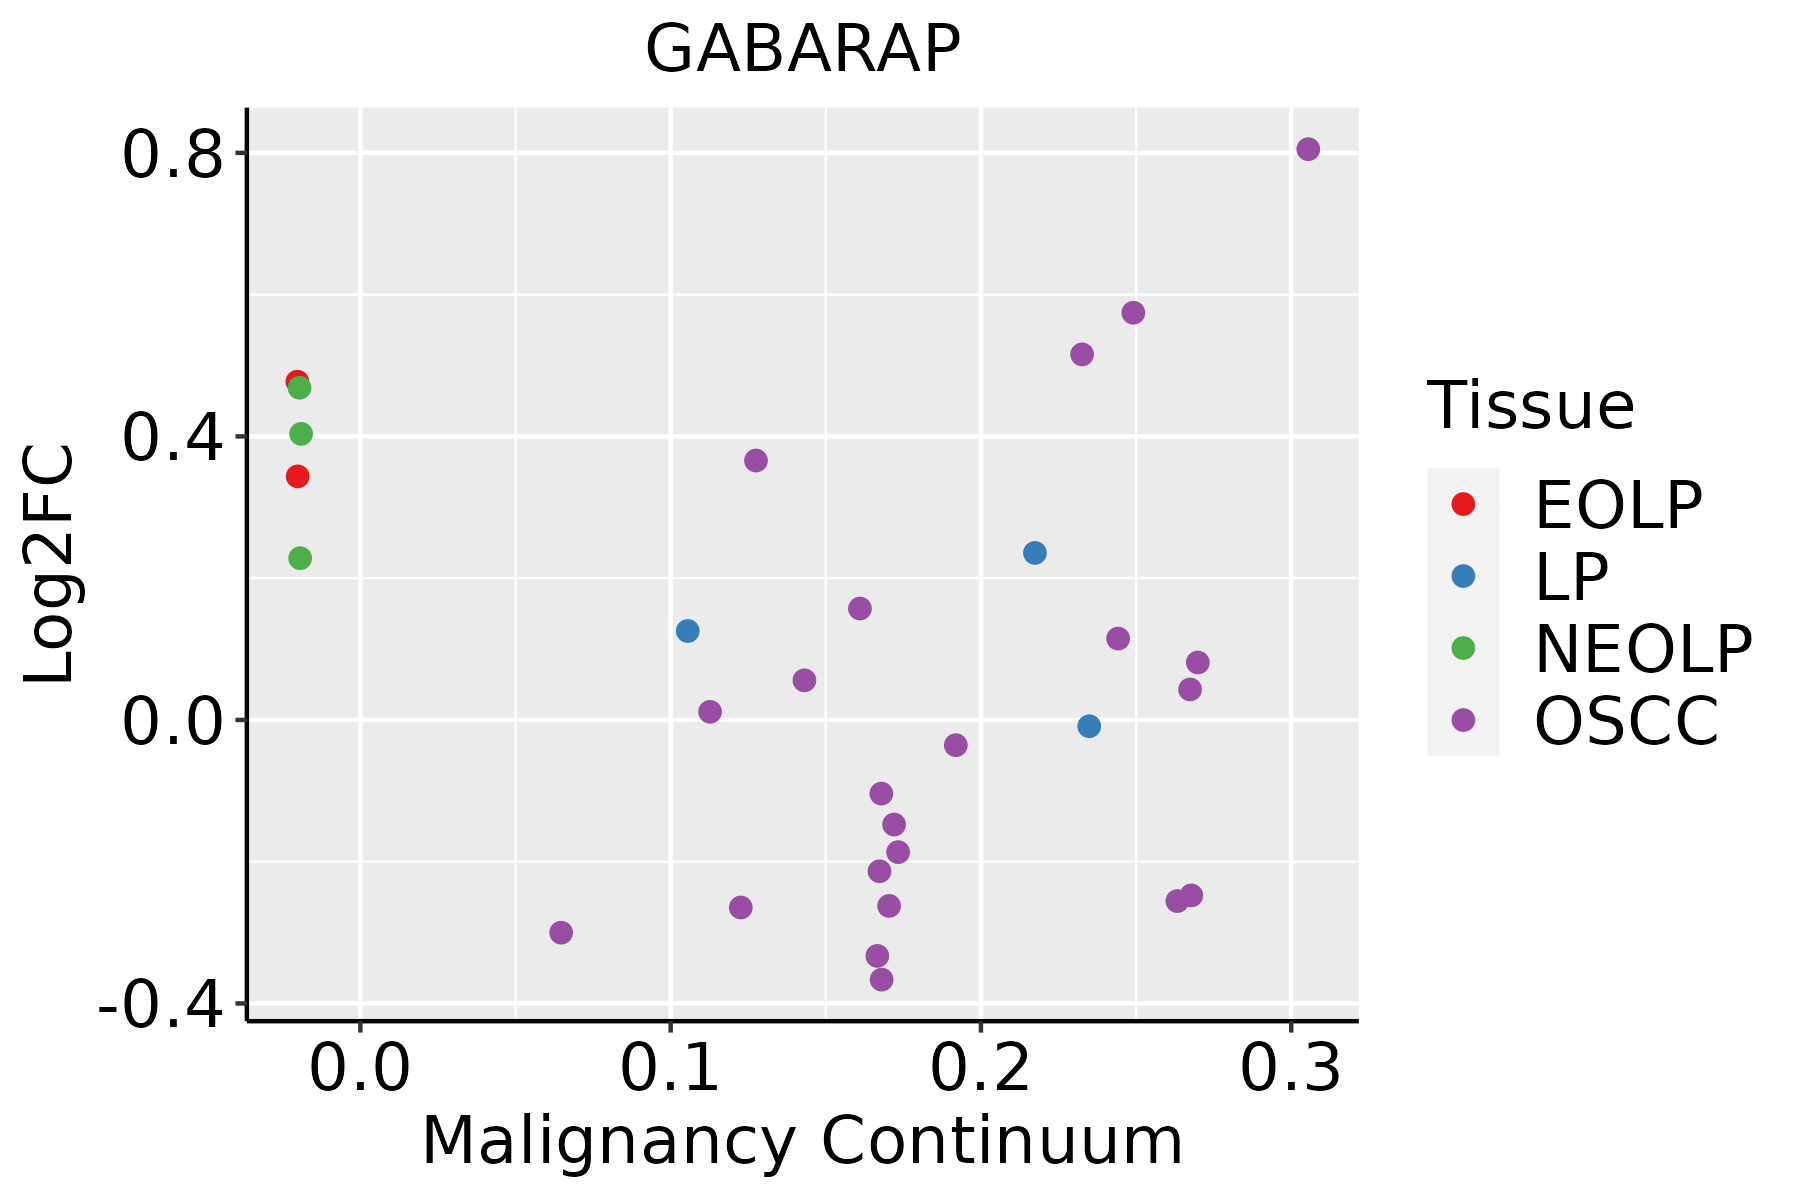 | EOLP: Erosive Oral lichen planus |
| LP: leukoplakia | ||
| NEOLP: Non-erosive oral lichen planus | ||
| OSCC: Oral squamous cell carcinoma | ||
| Prostate | 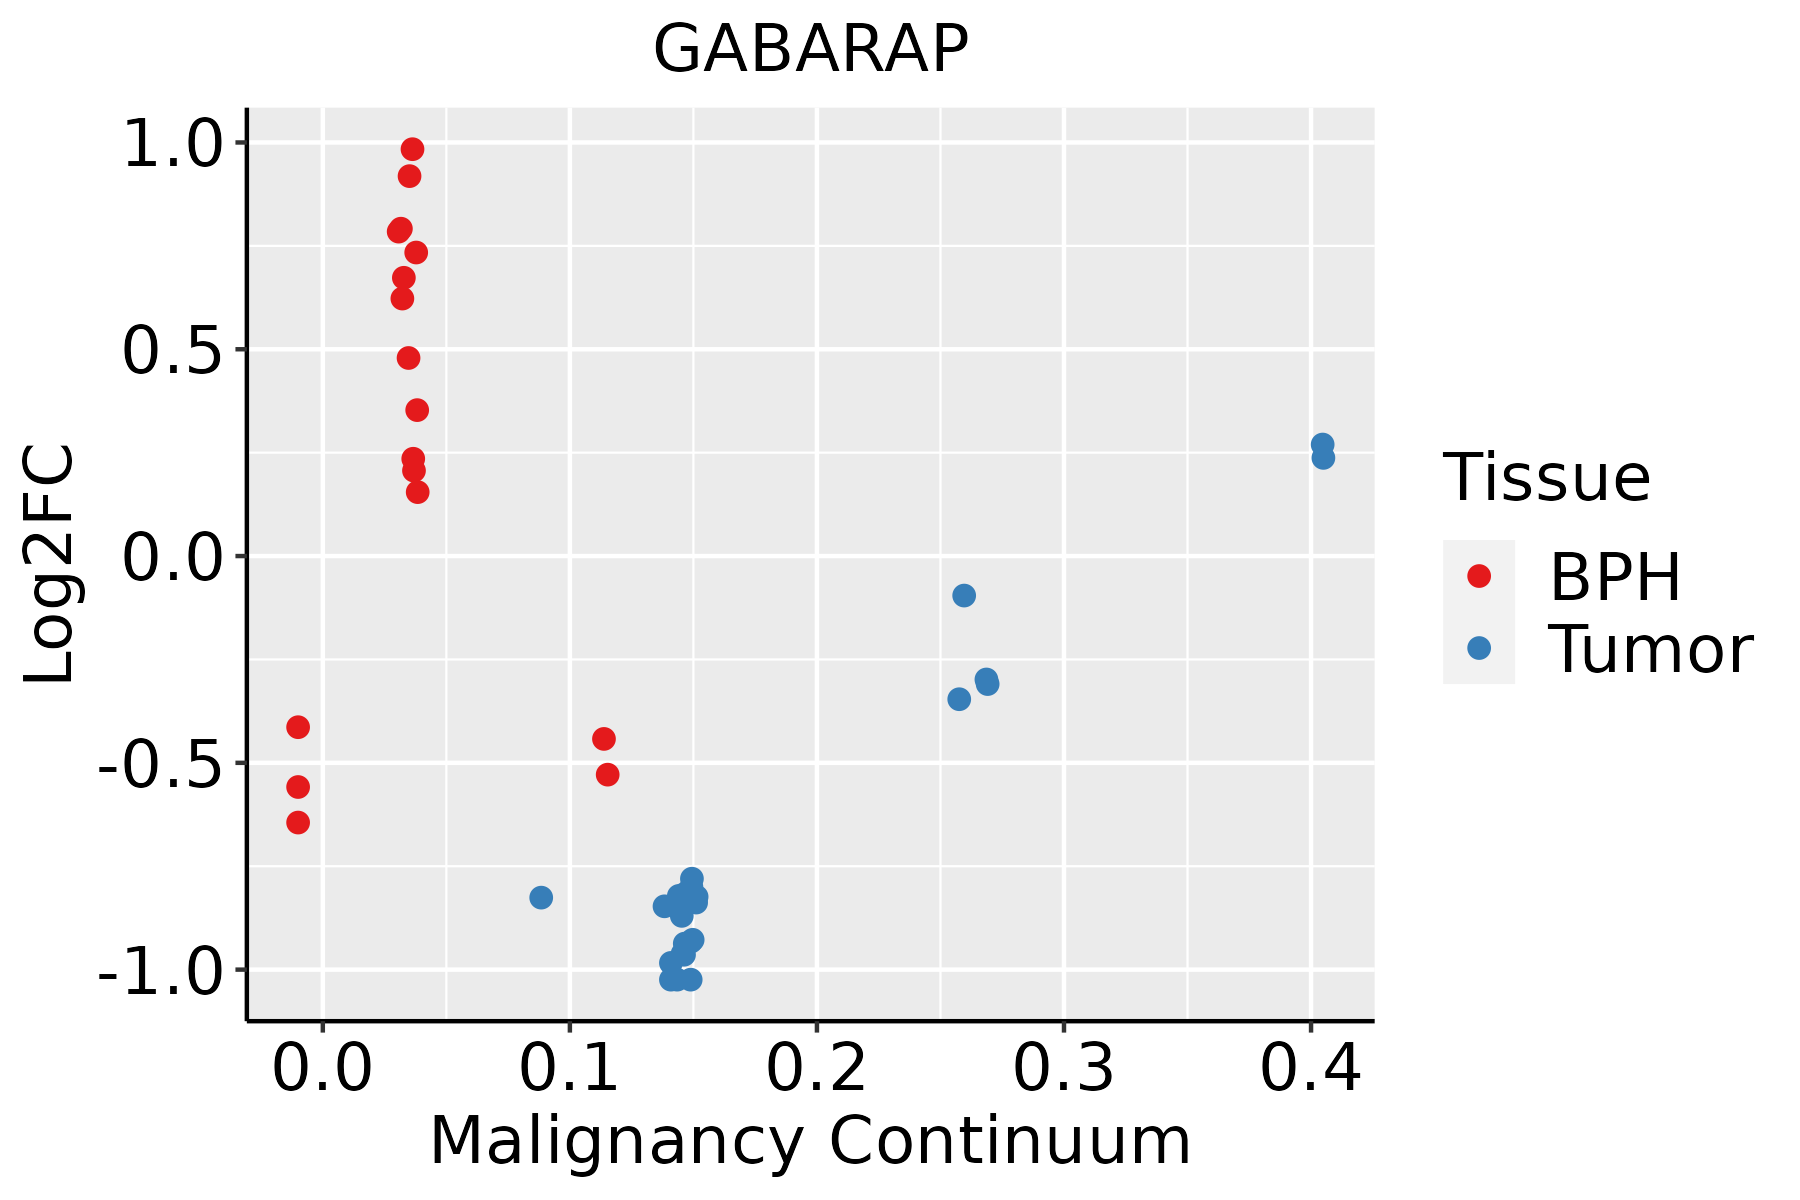 | BPH: Benign Prostatic Hyperplasia |
| Skin | 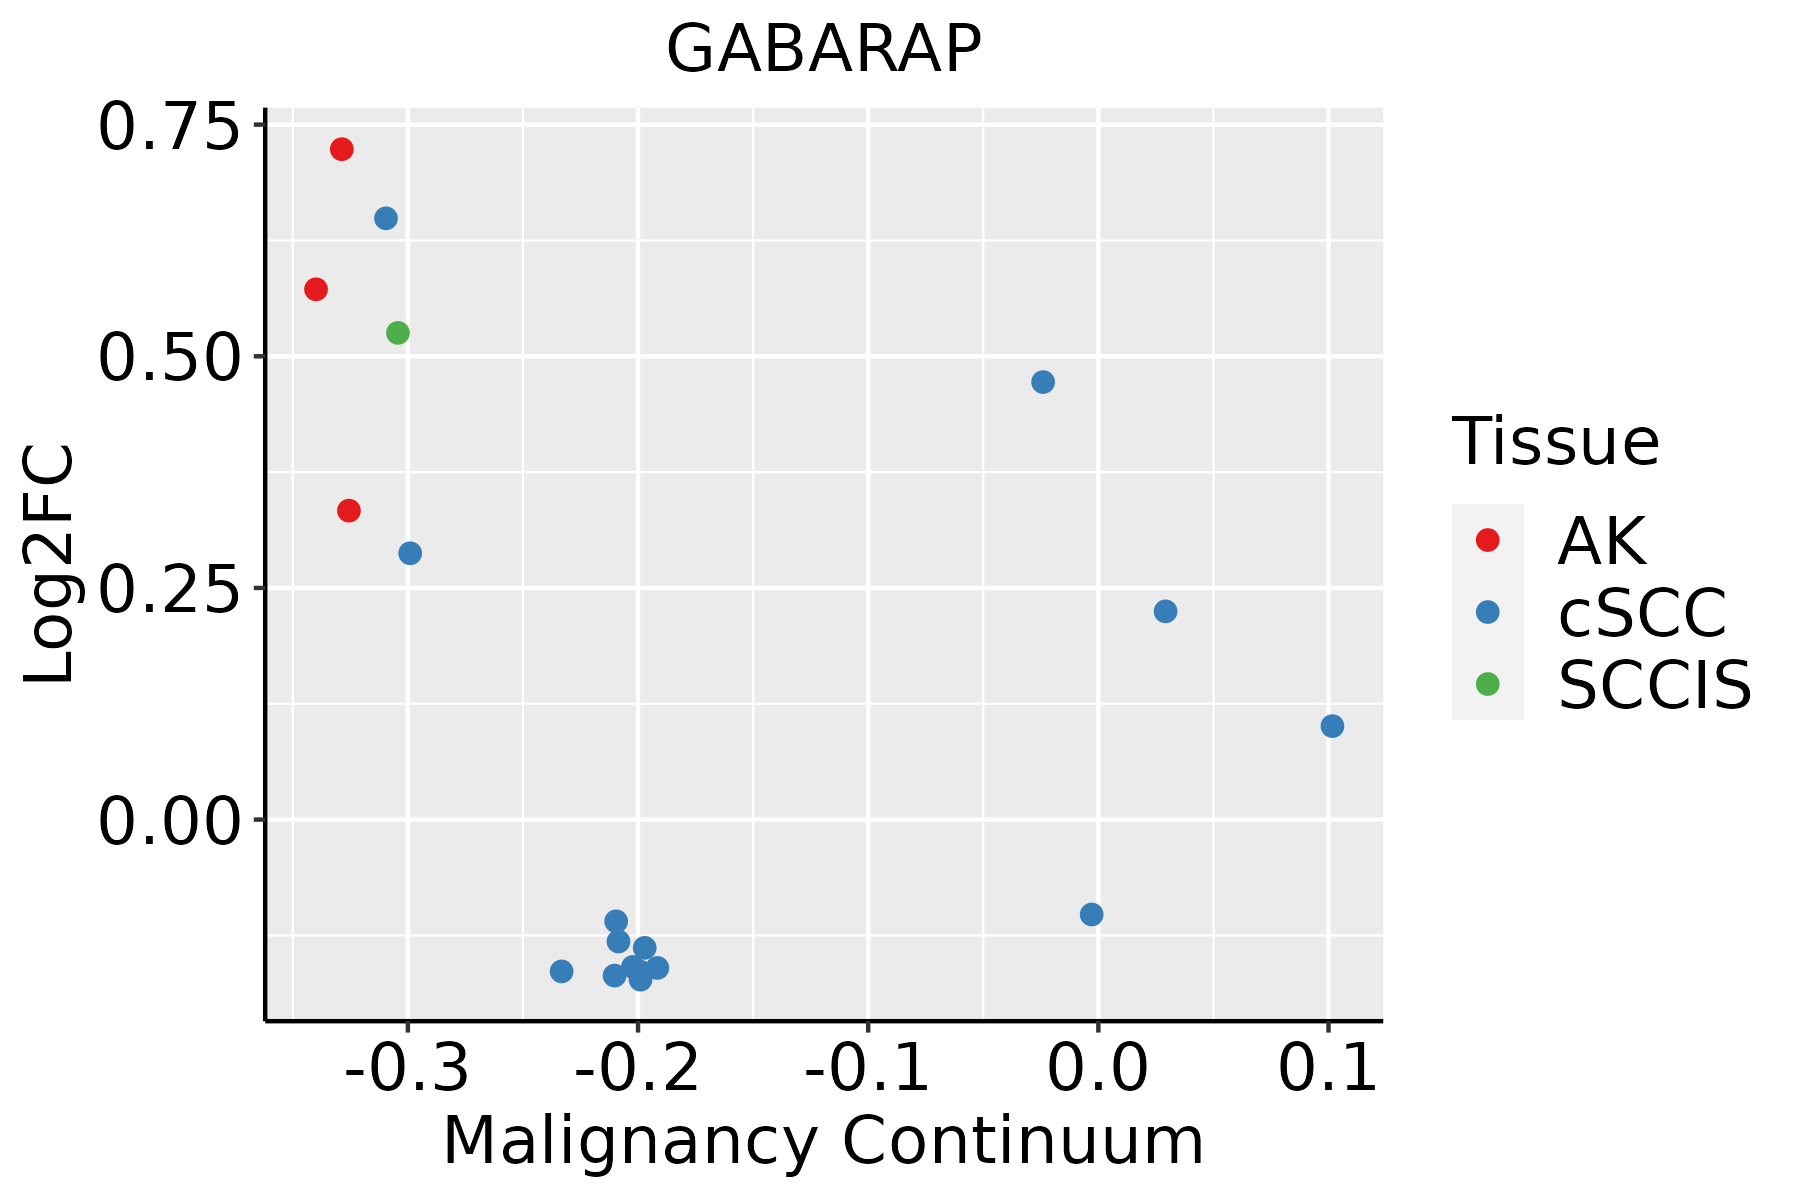 | AK: Actinic keratosis |
| cSCC: Cutaneous squamous cell carcinoma | ||
| SCCIS:squamous cell carcinoma in situ | ||
| Thyroid | 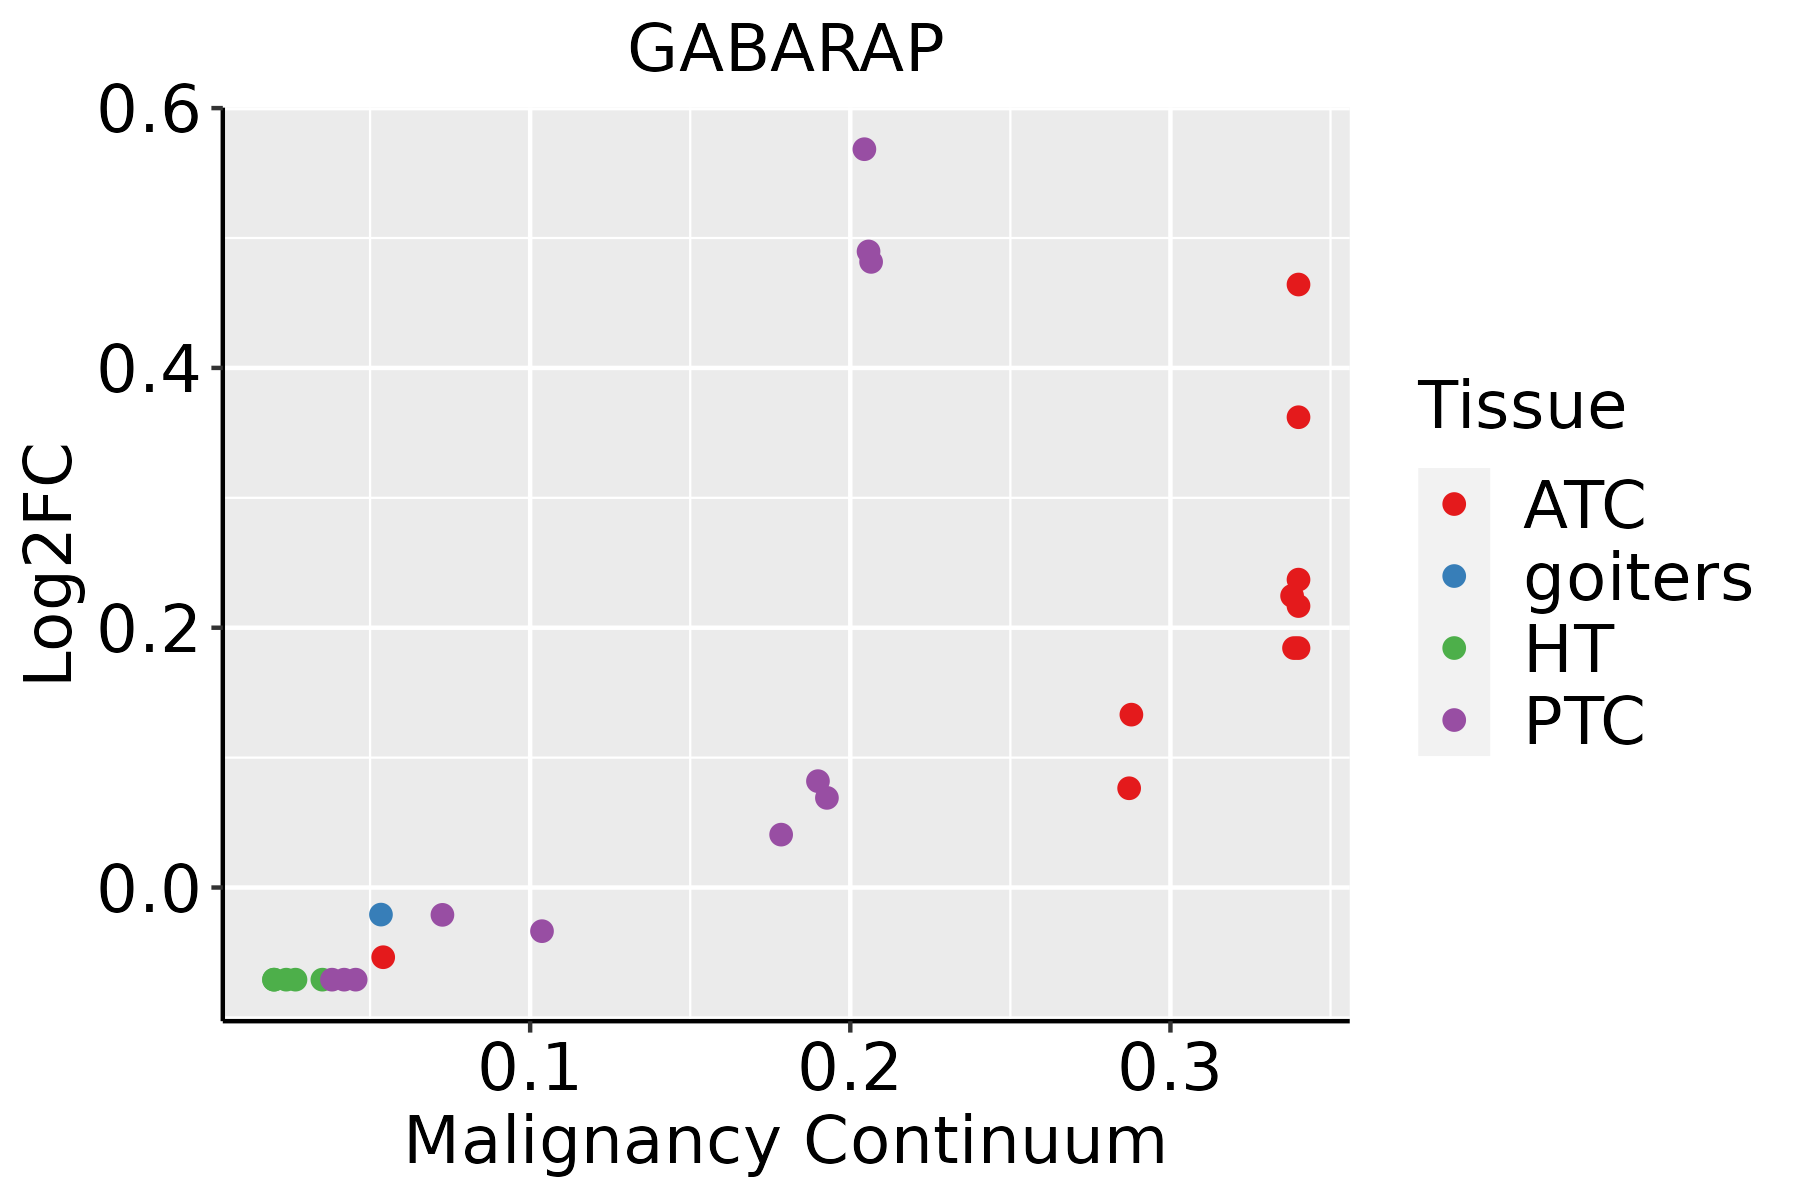 | ATC: Anaplastic thyroid cancer |
| HT: Hashimoto's thyroiditis | ||
| PTC: Papillary thyroid cancer |
| ∗log2FC in expression of this searched gene in stem-like cells from each diseased tissue sample relative to stem-like cells in normal samples in each tissue plotted against the malignancy continuum. Samples are colored based on if they are from different disease stage. |
Top |
Malignant transformation related pathway analysis |
| Find out the enriched GO biological processes and KEGG pathways involved in transition from healthy to precancer to cancer |
| Tissue | Disease Stage | Enriched GO biological Processes |
| Colorectum | AD |  |
| Colorectum | SER |  |
| Colorectum | MSS |  |
| Colorectum | MSI-H |  |
| Colorectum | FAP |  |
| ∗Top 15 enriched GO BP terms are showed in the bar plot of each disease state in each tissue. Each row represents a significant GO biological process which is colored according to the -log10(p.adjust). |
| Page: 1 2 3 4 5 6 7 8 9 |
| GO ID | Tissue | Disease Stage | Description | Gene Ratio | Bg Ratio | pvalue | p.adjust | Count |
| GO:2000058112 | Skin | SCCIS | regulation of ubiquitin-dependent protein catabolic process | 26/919 | 164/18723 | 1.18e-07 | 1.52e-05 | 26 |
| GO:0045862112 | Skin | SCCIS | positive regulation of proteolysis | 43/919 | 372/18723 | 1.69e-07 | 1.91e-05 | 43 |
| GO:1903320112 | Skin | SCCIS | regulation of protein modification by small protein conjugation or removal | 32/919 | 242/18723 | 3.31e-07 | 3.03e-05 | 32 |
| GO:0031396112 | Skin | SCCIS | regulation of protein ubiquitination | 28/919 | 210/18723 | 1.51e-06 | 8.89e-05 | 28 |
| GO:0061136112 | Skin | SCCIS | regulation of proteasomal protein catabolic process | 26/919 | 187/18723 | 1.60e-06 | 9.11e-05 | 26 |
| GO:0009896112 | Skin | SCCIS | positive regulation of catabolic process | 49/919 | 492/18723 | 2.10e-06 | 1.09e-04 | 49 |
| GO:0032434112 | Skin | SCCIS | regulation of proteasomal ubiquitin-dependent protein catabolic process | 21/919 | 134/18723 | 2.31e-06 | 1.17e-04 | 21 |
| GO:0010498112 | Skin | SCCIS | proteasomal protein catabolic process | 48/919 | 490/18723 | 4.21e-06 | 1.82e-04 | 48 |
| GO:2000060112 | Skin | SCCIS | positive regulation of ubiquitin-dependent protein catabolic process | 18/919 | 107/18723 | 4.32e-06 | 1.85e-04 | 18 |
| GO:1903052111 | Skin | SCCIS | positive regulation of proteolysis involved in cellular protein catabolic process | 20/919 | 133/18723 | 7.61e-06 | 2.80e-04 | 20 |
| GO:0043161112 | Skin | SCCIS | proteasome-mediated ubiquitin-dependent protein catabolic process | 41/919 | 412/18723 | 1.44e-05 | 4.73e-04 | 41 |
| GO:005105616 | Skin | SCCIS | regulation of small GTPase mediated signal transduction | 33/919 | 302/18723 | 1.49e-05 | 4.86e-04 | 33 |
| GO:0071496112 | Skin | SCCIS | cellular response to external stimulus | 34/919 | 320/18723 | 2.01e-05 | 5.97e-04 | 34 |
| GO:000726517 | Skin | SCCIS | Ras protein signal transduction | 35/919 | 337/18723 | 2.48e-05 | 6.96e-04 | 35 |
| GO:0097191112 | Skin | SCCIS | extrinsic apoptotic signaling pathway | 26/919 | 219/18723 | 2.87e-05 | 7.82e-04 | 26 |
| GO:0032436112 | Skin | SCCIS | positive regulation of proteasomal ubiquitin-dependent protein catabolic process | 15/919 | 90/18723 | 3.00e-05 | 8.12e-04 | 15 |
| GO:0031331112 | Skin | SCCIS | positive regulation of cellular catabolic process | 41/919 | 427/18723 | 3.33e-05 | 8.88e-04 | 41 |
| GO:1901800111 | Skin | SCCIS | positive regulation of proteasomal protein catabolic process | 17/919 | 114/18723 | 4.02e-05 | 1.03e-03 | 17 |
| GO:0008625110 | Skin | SCCIS | extrinsic apoptotic signaling pathway via death domain receptors | 13/919 | 82/18723 | 1.69e-04 | 3.32e-03 | 13 |
| GO:0031668112 | Skin | SCCIS | cellular response to extracellular stimulus | 26/919 | 246/18723 | 2.00e-04 | 3.79e-03 | 26 |
| Page: 1 2 3 4 5 6 7 8 9 10 11 12 13 14 15 16 17 18 19 20 21 22 23 24 25 26 27 28 29 30 31 32 33 34 35 36 37 38 39 40 41 42 43 44 45 46 47 48 49 50 51 52 53 54 55 56 57 58 59 60 61 62 63 64 65 66 67 68 69 |
| Pathway ID | Tissue | Disease Stage | Description | Gene Ratio | Bg Ratio | pvalue | p.adjust | qvalue | Count |
| hsa0413718 | Cervix | CC | Mitophagy - animal | 22/1267 | 72/8465 | 5.77e-04 | 2.75e-03 | 1.63e-03 | 22 |
| hsa046213 | Cervix | CC | NOD-like receptor signaling pathway | 41/1267 | 186/8465 | 5.90e-03 | 1.95e-02 | 1.15e-02 | 41 |
| hsa0413719 | Cervix | CC | Mitophagy - animal | 22/1267 | 72/8465 | 5.77e-04 | 2.75e-03 | 1.63e-03 | 22 |
| hsa0462112 | Cervix | CC | NOD-like receptor signaling pathway | 41/1267 | 186/8465 | 5.90e-03 | 1.95e-02 | 1.15e-02 | 41 |
| hsa0413724 | Cervix | N_HPV | Mitophagy - animal | 10/349 | 72/8465 | 6.84e-04 | 5.03e-03 | 3.93e-03 | 10 |
| hsa0413734 | Cervix | N_HPV | Mitophagy - animal | 10/349 | 72/8465 | 6.84e-04 | 5.03e-03 | 3.93e-03 | 10 |
| hsa0413720 | Endometrium | AEH | Mitophagy - animal | 21/1197 | 72/8465 | 7.03e-04 | 4.86e-03 | 3.56e-03 | 21 |
| hsa04137110 | Endometrium | AEH | Mitophagy - animal | 21/1197 | 72/8465 | 7.03e-04 | 4.86e-03 | 3.56e-03 | 21 |
| hsa0413725 | Endometrium | EEC | Mitophagy - animal | 22/1237 | 72/8465 | 4.12e-04 | 3.30e-03 | 2.46e-03 | 22 |
| hsa0413735 | Endometrium | EEC | Mitophagy - animal | 22/1237 | 72/8465 | 4.12e-04 | 3.30e-03 | 2.46e-03 | 22 |
| hsa0413730 | Esophagus | HGIN | Mitophagy - animal | 23/1383 | 72/8465 | 7.69e-04 | 7.59e-03 | 6.03e-03 | 23 |
| hsa046219 | Esophagus | HGIN | NOD-like receptor signaling pathway | 45/1383 | 186/8465 | 3.40e-03 | 2.54e-02 | 2.02e-02 | 45 |
| hsa04137113 | Esophagus | HGIN | Mitophagy - animal | 23/1383 | 72/8465 | 7.69e-04 | 7.59e-03 | 6.03e-03 | 23 |
| hsa0462114 | Esophagus | HGIN | NOD-like receptor signaling pathway | 45/1383 | 186/8465 | 3.40e-03 | 2.54e-02 | 2.02e-02 | 45 |
| hsa0414010 | Esophagus | ESCC | Autophagy - animal | 101/4205 | 141/8465 | 7.60e-08 | 6.21e-07 | 3.18e-07 | 101 |
| hsa04137210 | Esophagus | ESCC | Mitophagy - animal | 54/4205 | 72/8465 | 9.33e-06 | 4.96e-05 | 2.54e-05 | 54 |
| hsa040689 | Esophagus | ESCC | FoxO signaling pathway | 89/4205 | 131/8465 | 1.56e-05 | 7.98e-05 | 4.09e-05 | 89 |
| hsa0462122 | Esophagus | ESCC | NOD-like receptor signaling pathway | 116/4205 | 186/8465 | 2.90e-04 | 1.03e-03 | 5.30e-04 | 116 |
| hsa041362 | Esophagus | ESCC | Autophagy - other | 23/4205 | 32/8465 | 8.99e-03 | 2.14e-02 | 1.09e-02 | 23 |
| hsa0414015 | Esophagus | ESCC | Autophagy - animal | 101/4205 | 141/8465 | 7.60e-08 | 6.21e-07 | 3.18e-07 | 101 |
| Page: 1 2 3 4 5 |
Top |
Cell-cell communication analysis |
| Identification of potential cell-cell interactions between two cell types and their ligand-receptor pairs for different disease states |
| Ligand | Receptor | LRpair | Pathway | Tissue | Disease Stage |
| Page: 1 |
Top |
Single-cell gene regulatory network inference analysis |
| Find out the significant the regulons (TFs) and the target genes of each regulon across cell types for different disease states |
| TF | Cell Type | Tissue | Disease Stage | Target Gene | RSS | Regulon Activity |
| ∗The dot plots of a searched regulon are shown for all cell subpopulations in each disease state of each tissue based on the regulon specific score inferred using pySCENIC and by calculating the average expression. |
| Page: 1 |
Top |
Somatic mutation of malignant transformation related genes |
| Annotation of somatic variants for genes involved in malignant transformation |
| Hugo Symbol | Variant Class | Variant Classification | dbSNP RS | HGVSc | HGVSp | HGVSp Short | SWISSPROT | BIOTYPE | SIFT | PolyPhen | Tumor Sample Barcode | Tissue | Histology | Sex | Age | Stage | Therapy Types | Drugs | Outcome |
| GABARAP | SNV | Missense_Mutation | c.80N>G | p.Asp27Gly | p.D27G | O95166 | protein_coding | deleterious(0.02) | benign(0.043) | TCGA-E2-A15G-01 | Breast | breast invasive carcinoma | Female | >=65 | I/II | Hormone Therapy | arimidex | SD | |
| GABARAP | SNV | Missense_Mutation | c.217N>A | p.Glu73Lys | p.E73K | O95166 | protein_coding | deleterious(0.01) | benign(0.369) | TCGA-IR-A3LA-01 | Cervix | cervical & endocervical cancer | Female | <65 | I/II | Chemotherapy | cisplatin | CR | |
| GABARAP | SNV | Missense_Mutation | novel | c.269N>T | p.Thr90Ile | p.T90I | O95166 | protein_coding | tolerated(0.35) | benign(0.158) | TCGA-A5-A0G1-01 | Endometrium | uterine corpus endometrioid carcinoma | Female | >=65 | I/II | Unknown | Unknown | SD |
| GABARAP | SNV | Missense_Mutation | novel | c.60N>T | p.Lys20Asn | p.K20N | O95166 | protein_coding | tolerated(0.08) | benign(0.214) | TCGA-A5-A1OF-01 | Endometrium | uterine corpus endometrioid carcinoma | Female | <65 | I/II | Unknown | Unknown | SD |
| GABARAP | SNV | Missense_Mutation | novel | c.69N>T | p.Lys23Asn | p.K23N | O95166 | protein_coding | tolerated(0.17) | benign(0.017) | TCGA-AX-A0J0-01 | Endometrium | uterine corpus endometrioid carcinoma | Female | <65 | I/II | Unknown | Unknown | SD |
| GABARAP | SNV | Missense_Mutation | c.300N>C | p.Glu100Asp | p.E100D | O95166 | protein_coding | tolerated(1) | benign(0.003) | TCGA-B5-A11E-01 | Endometrium | uterine corpus endometrioid carcinoma | Female | <65 | I/II | Unknown | Unknown | SD | |
| GABARAP | SNV | Missense_Mutation | rs781270795 | c.303A>C | p.Glu101Asp | p.E101D | O95166 | protein_coding | tolerated(0.14) | benign(0.003) | TCGA-B5-A3FC-01 | Endometrium | uterine corpus endometrioid carcinoma | Female | <65 | I/II | Unknown | Unknown | SD |
| GABARAP | SNV | Missense_Mutation | novel | c.271A>C | p.Met91Leu | p.M91L | O95166 | protein_coding | tolerated(0.07) | benign(0.05) | TCGA-EO-A22U-01 | Endometrium | uterine corpus endometrioid carcinoma | Female | >=65 | I/II | Unknown | Unknown | SD |
| GABARAP | SNV | Missense_Mutation | novel | c.122T>C | p.Ile41Thr | p.I41T | O95166 | protein_coding | deleterious(0.01) | benign(0.267) | TCGA-EO-A22U-01 | Endometrium | uterine corpus endometrioid carcinoma | Female | >=65 | I/II | Unknown | Unknown | SD |
| Page: 1 |
Top |
Related drugs of malignant transformation related genes |
| Identification of chemicals and drugs interact with genes involved in malignant transfromation |
| (DGIdb 4.0) |
| Entrez ID | Symbol | Category | Interaction Types | Drug Claim Name | Drug Name | PMIDs |
| Page: 1 |

Copyright 2023-Present -The University of Texas Health Science Center at Houston |