| Tissue | Expression Dynamics | Abbreviation |
| Breast | 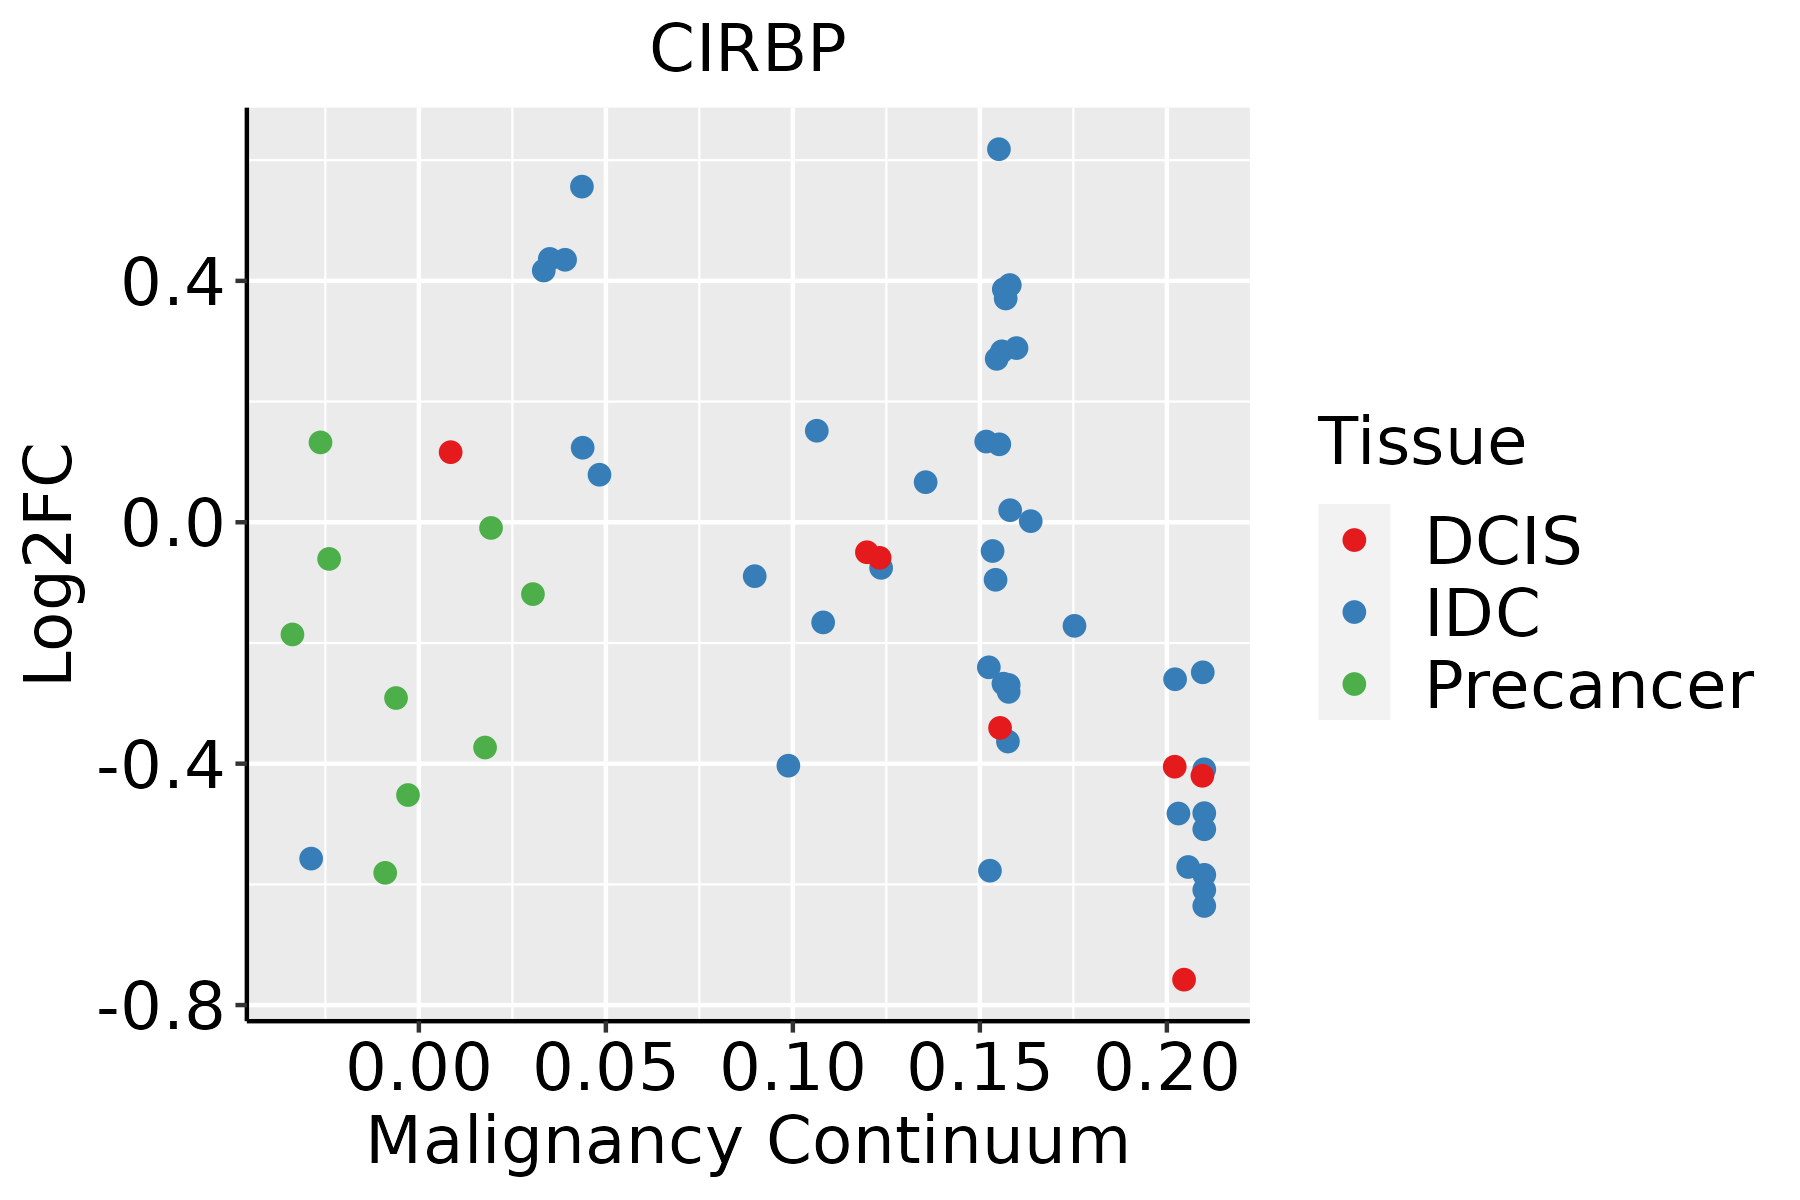 | IDC: Invasive ductal carcinoma |
| DCIS: Ductal carcinoma in situ |
| Precancer(BRCA1-mut): Precancerous lesion from BRCA1 mutation carriers |
| Cervix | 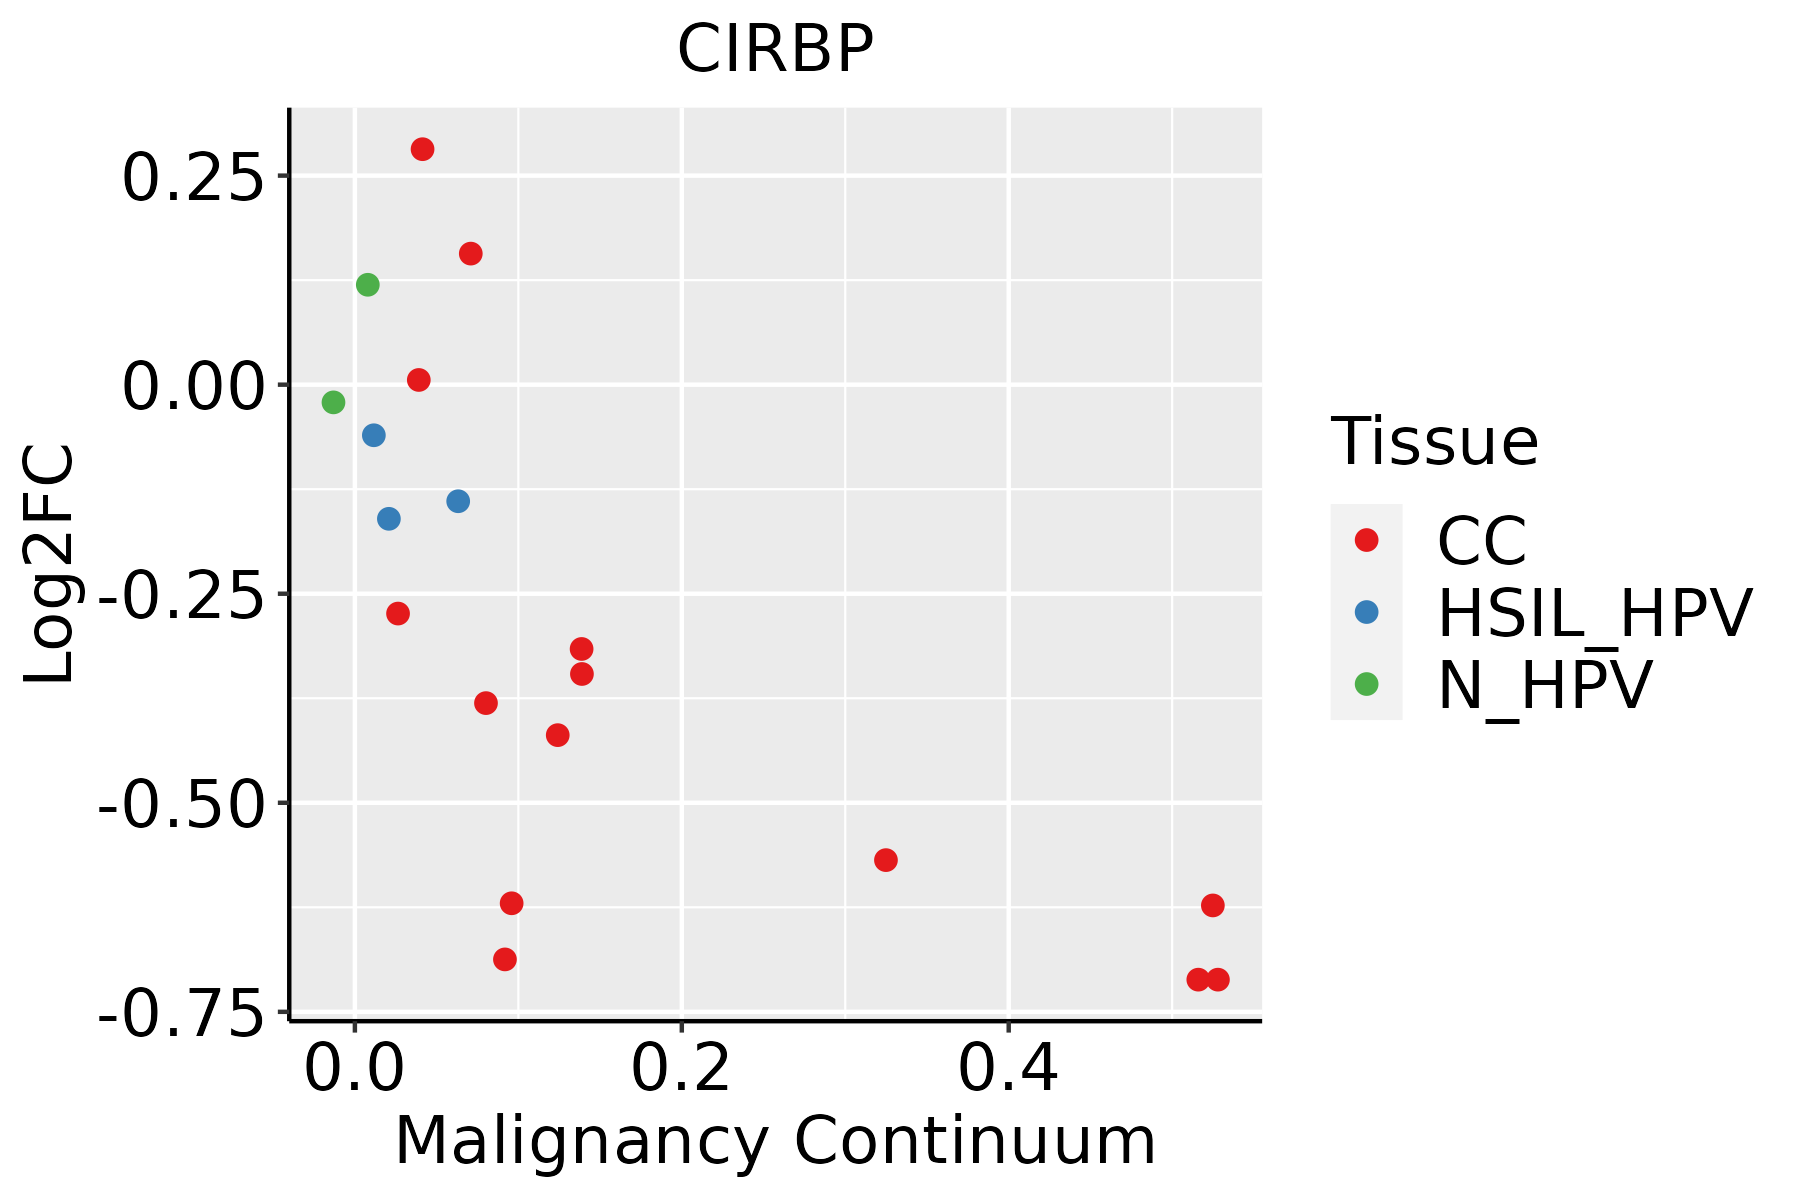 | CC: Cervix cancer |
| HSIL_HPV: HPV-infected high-grade squamous intraepithelial lesions |
| N_HPV: HPV-infected normal cervix |
| Colorectum (GSE201348) |  | FAP: Familial adenomatous polyposis |
| CRC: Colorectal cancer |
| Colorectum (HTA11) | 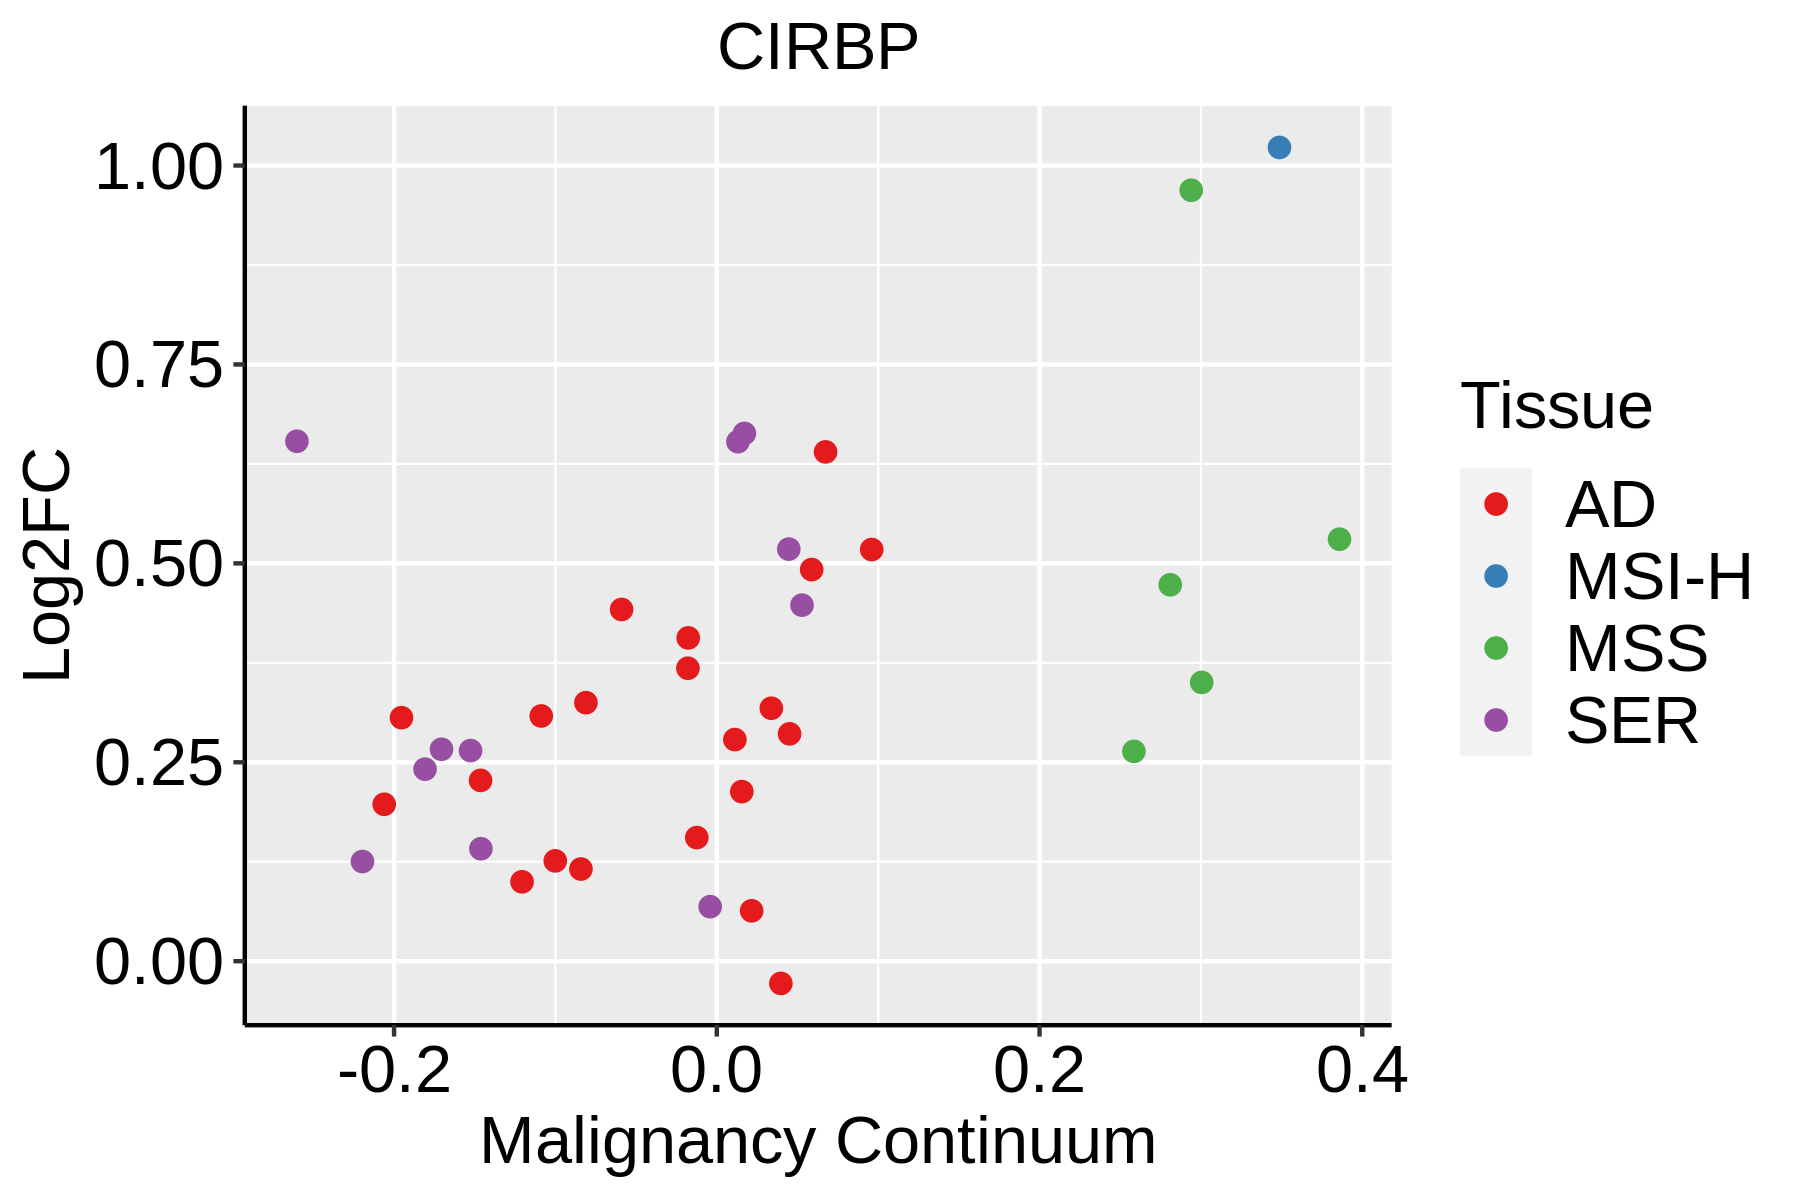 | AD: Adenomas |
| SER: Sessile serrated lesions |
| MSI-H: Microsatellite-high colorectal cancer |
| MSS: Microsatellite stable colorectal cancer |
| Endometrium | 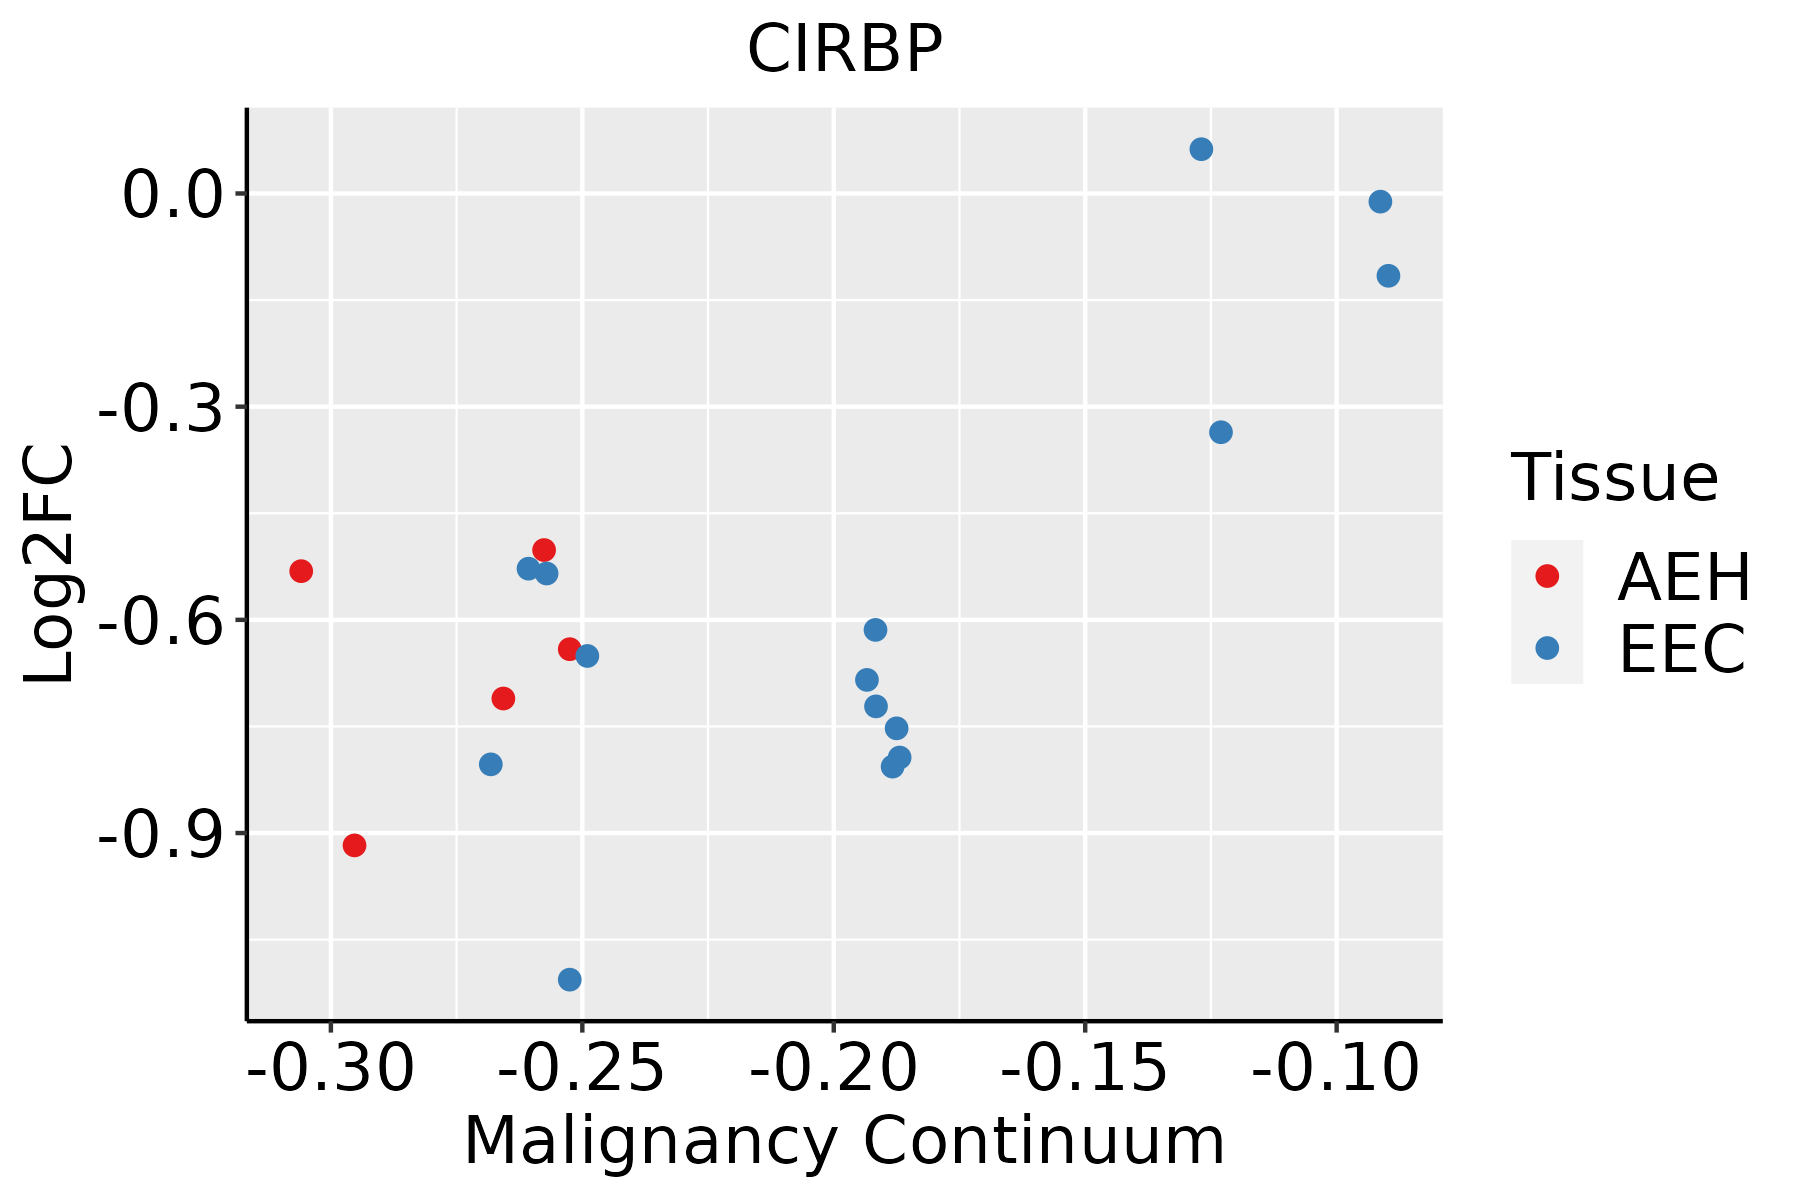 | AEH: Atypical endometrial hyperplasia |
| EEC: Endometrioid Cancer |
| Esophagus | 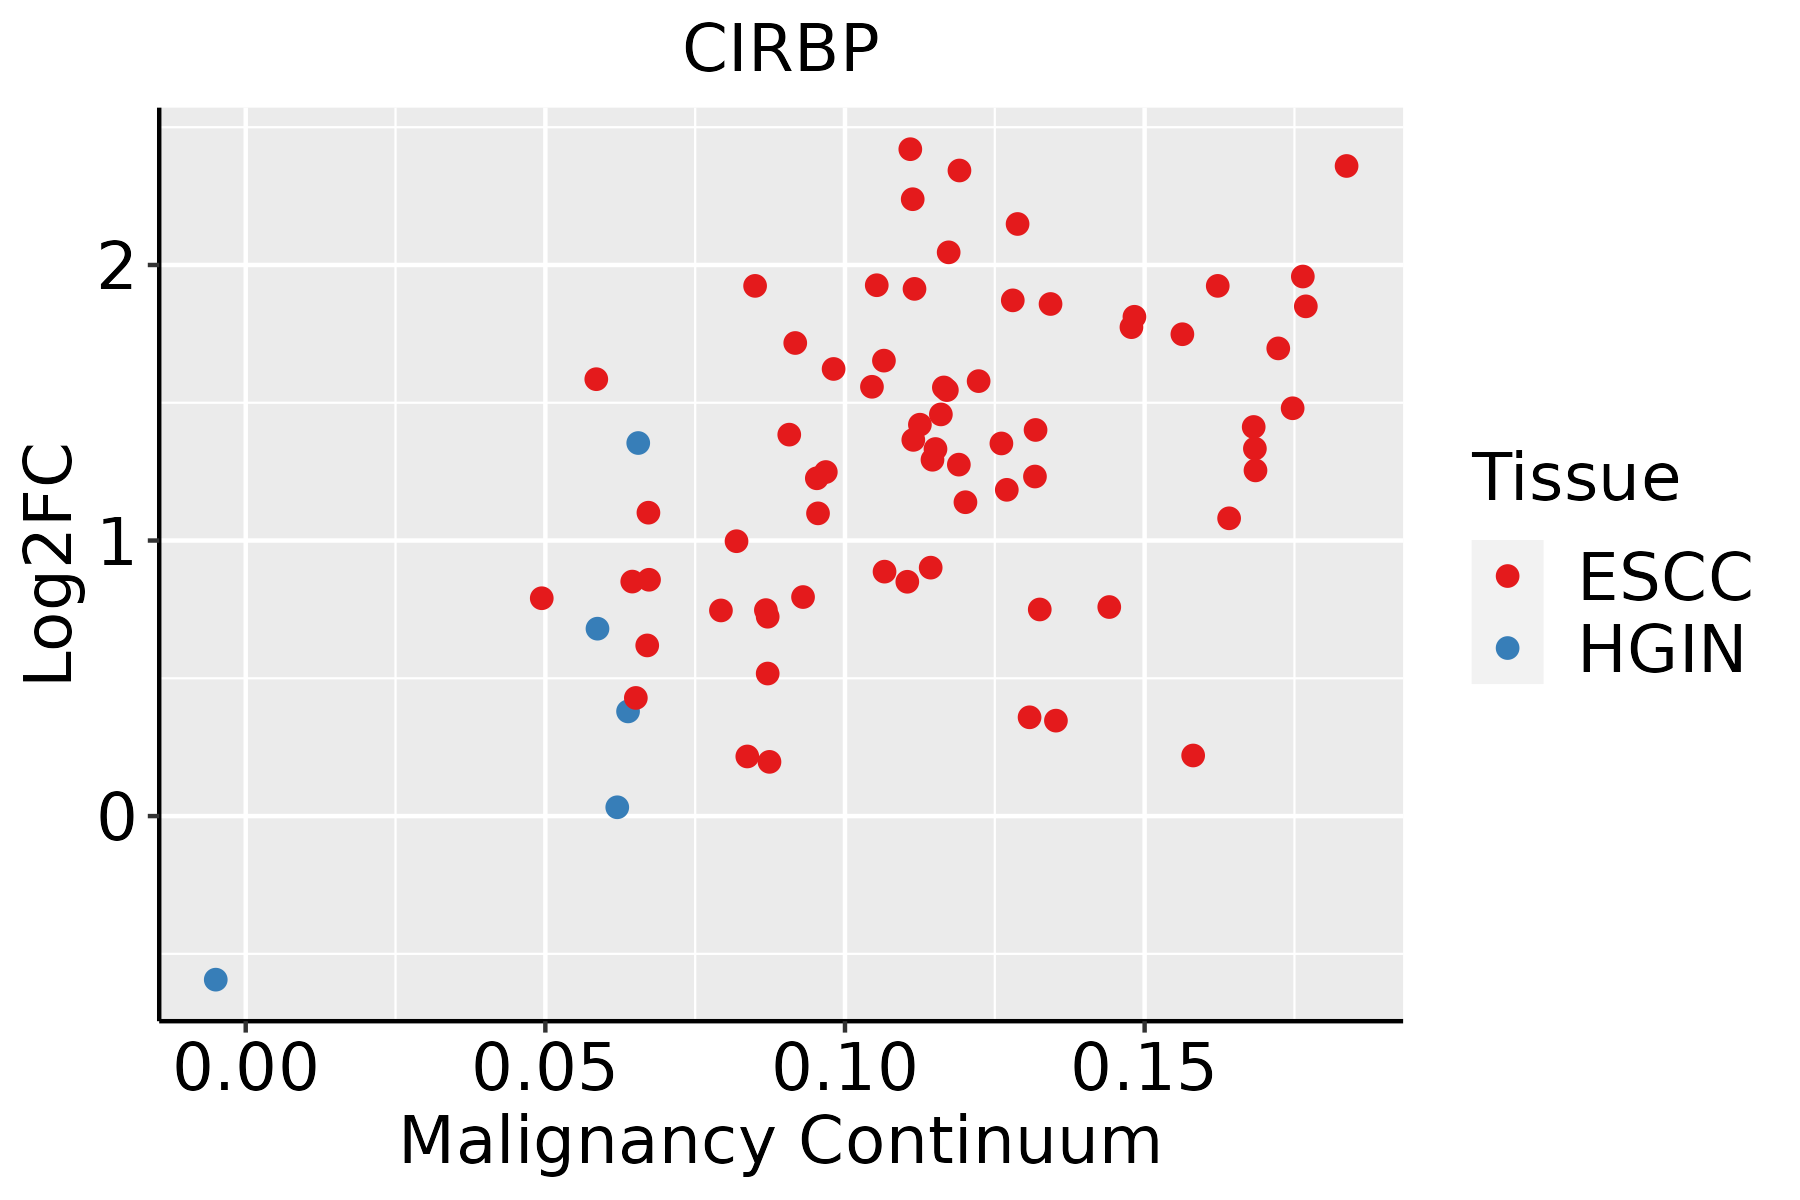 | ESCC: Esophageal squamous cell carcinoma |
| HGIN: High-grade intraepithelial neoplasias |
| LGIN: Low-grade intraepithelial neoplasias |
| GC | 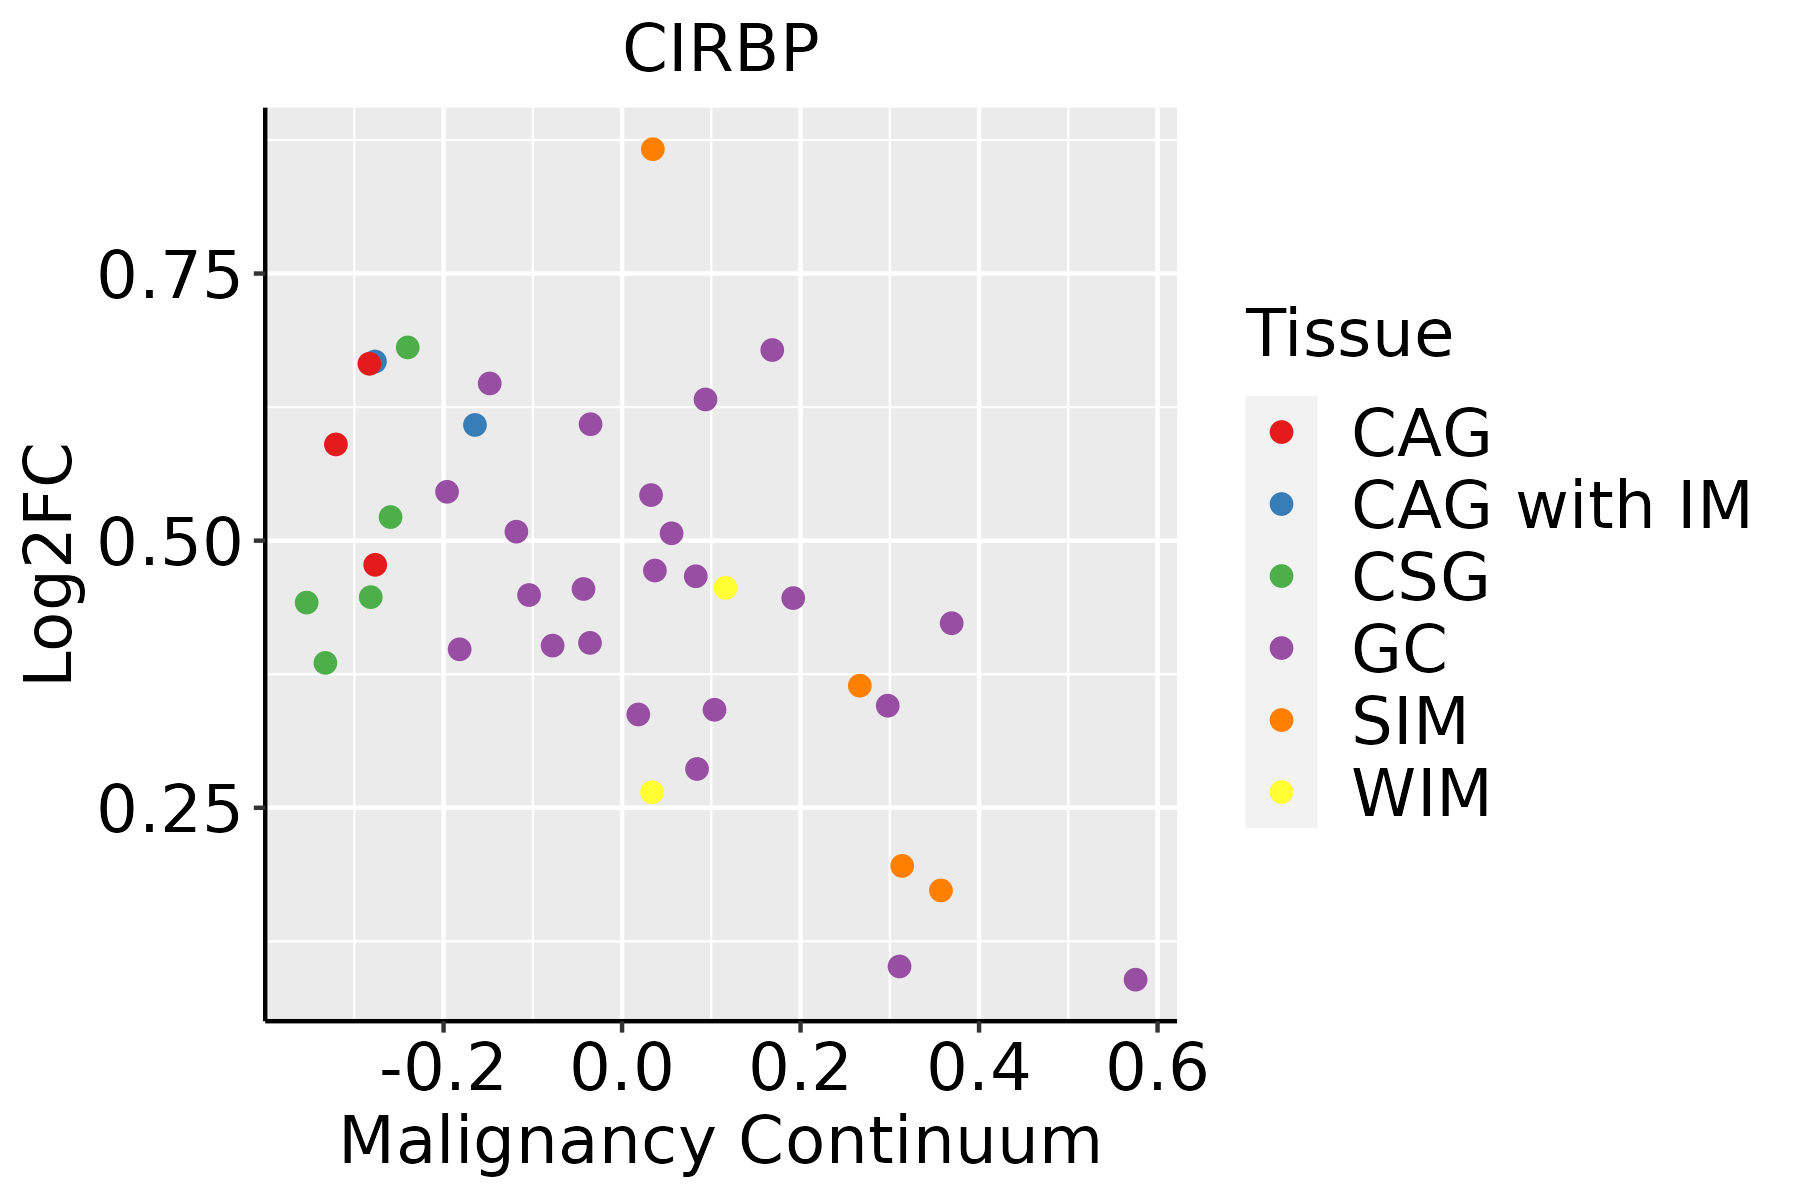 | CAG: Chronic atrophic gastritis |
| CAG with IM: Chronic atrophic gastritis with intestinal metaplasia |
| CSG: Chronic superficial gastritis |
| GC: Gastric cancer |
| SIM: Severe intestinal metaplasia |
| WIM: Wild intestinal metaplasia |
| Liver |  | HCC: Hepatocellular carcinoma |
| NAFLD: Non-alcoholic fatty liver disease |
| Lung |  | AAH: Atypical adenomatous hyperplasia |
| AIS: Adenocarcinoma in situ |
| IAC: Invasive lung adenocarcinoma |
| MIA: Minimally invasive adenocarcinoma |
| Oral Cavity | 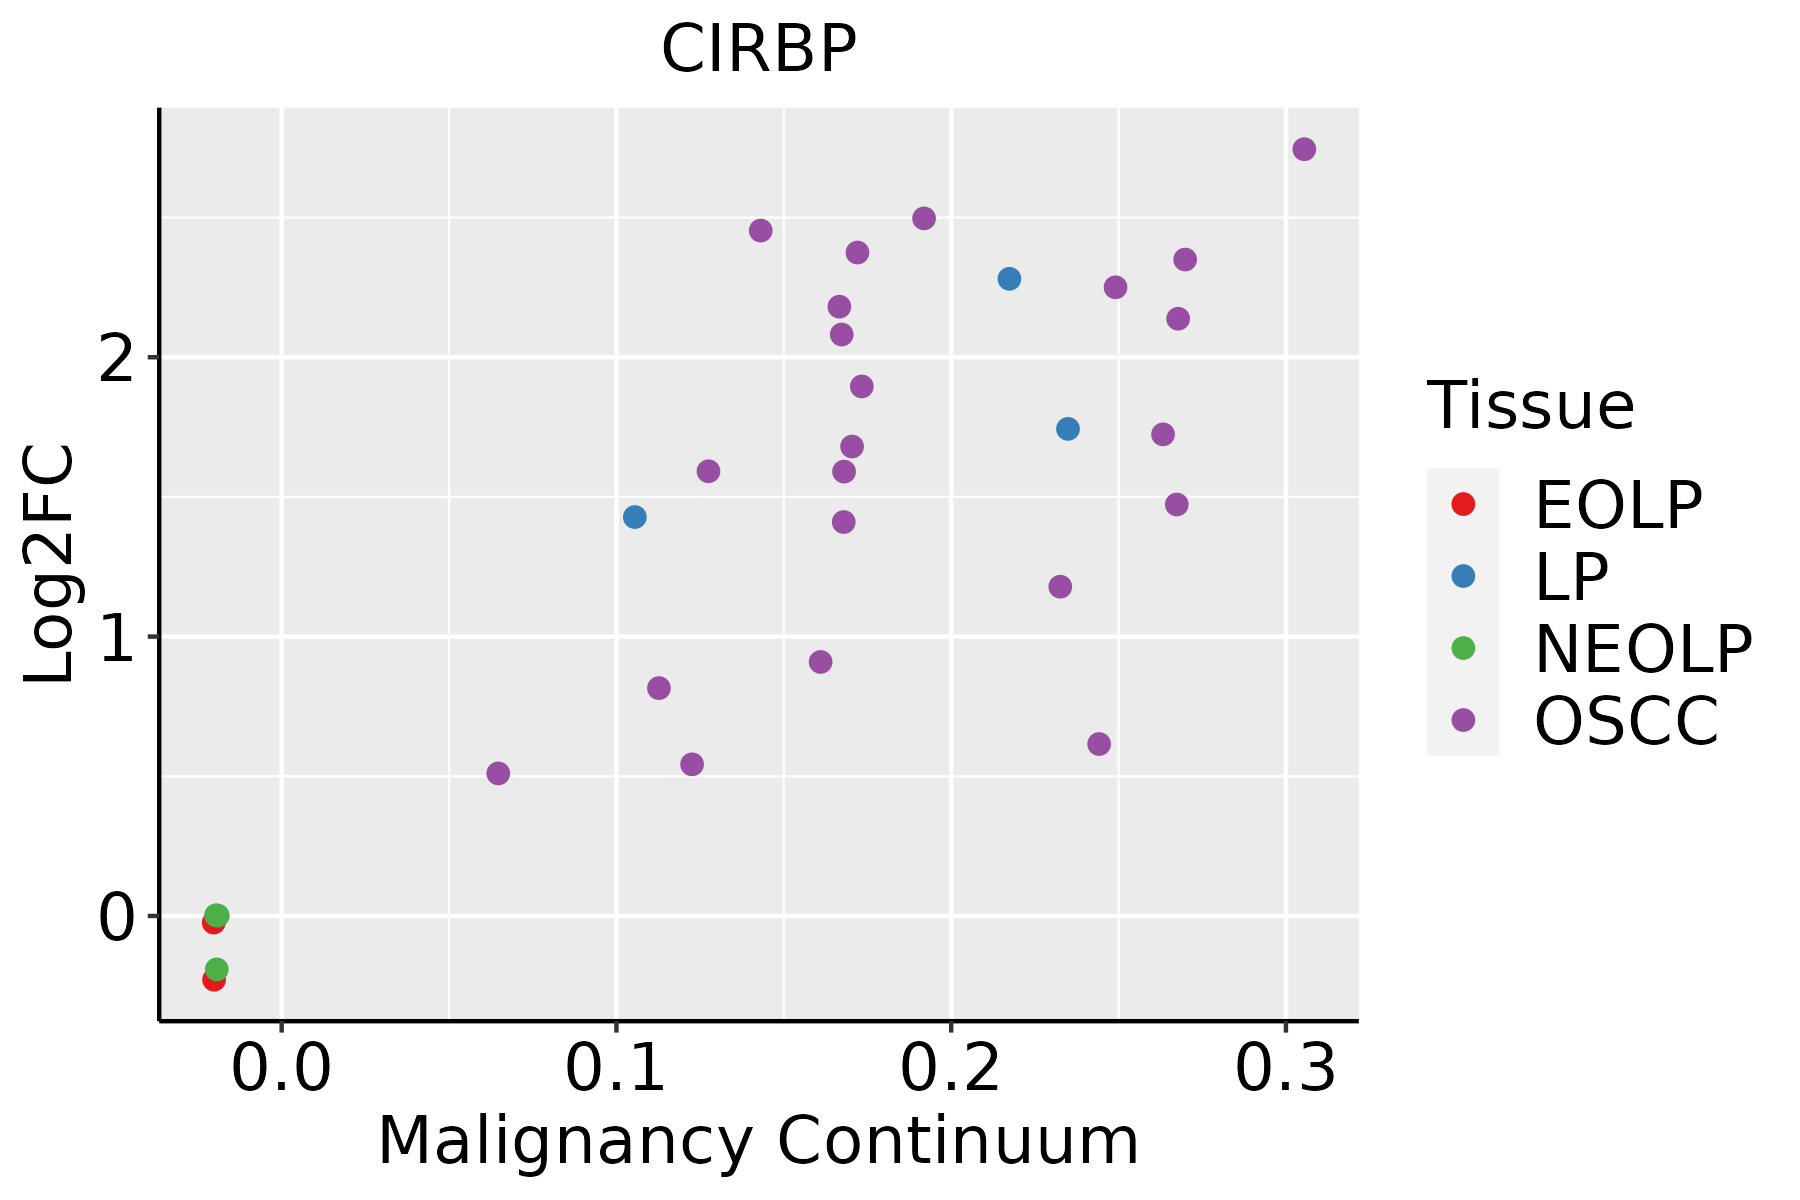 | EOLP: Erosive Oral lichen planus |
| LP: leukoplakia |
| NEOLP: Non-erosive oral lichen planus |
| OSCC: Oral squamous cell carcinoma |
| Prostate | 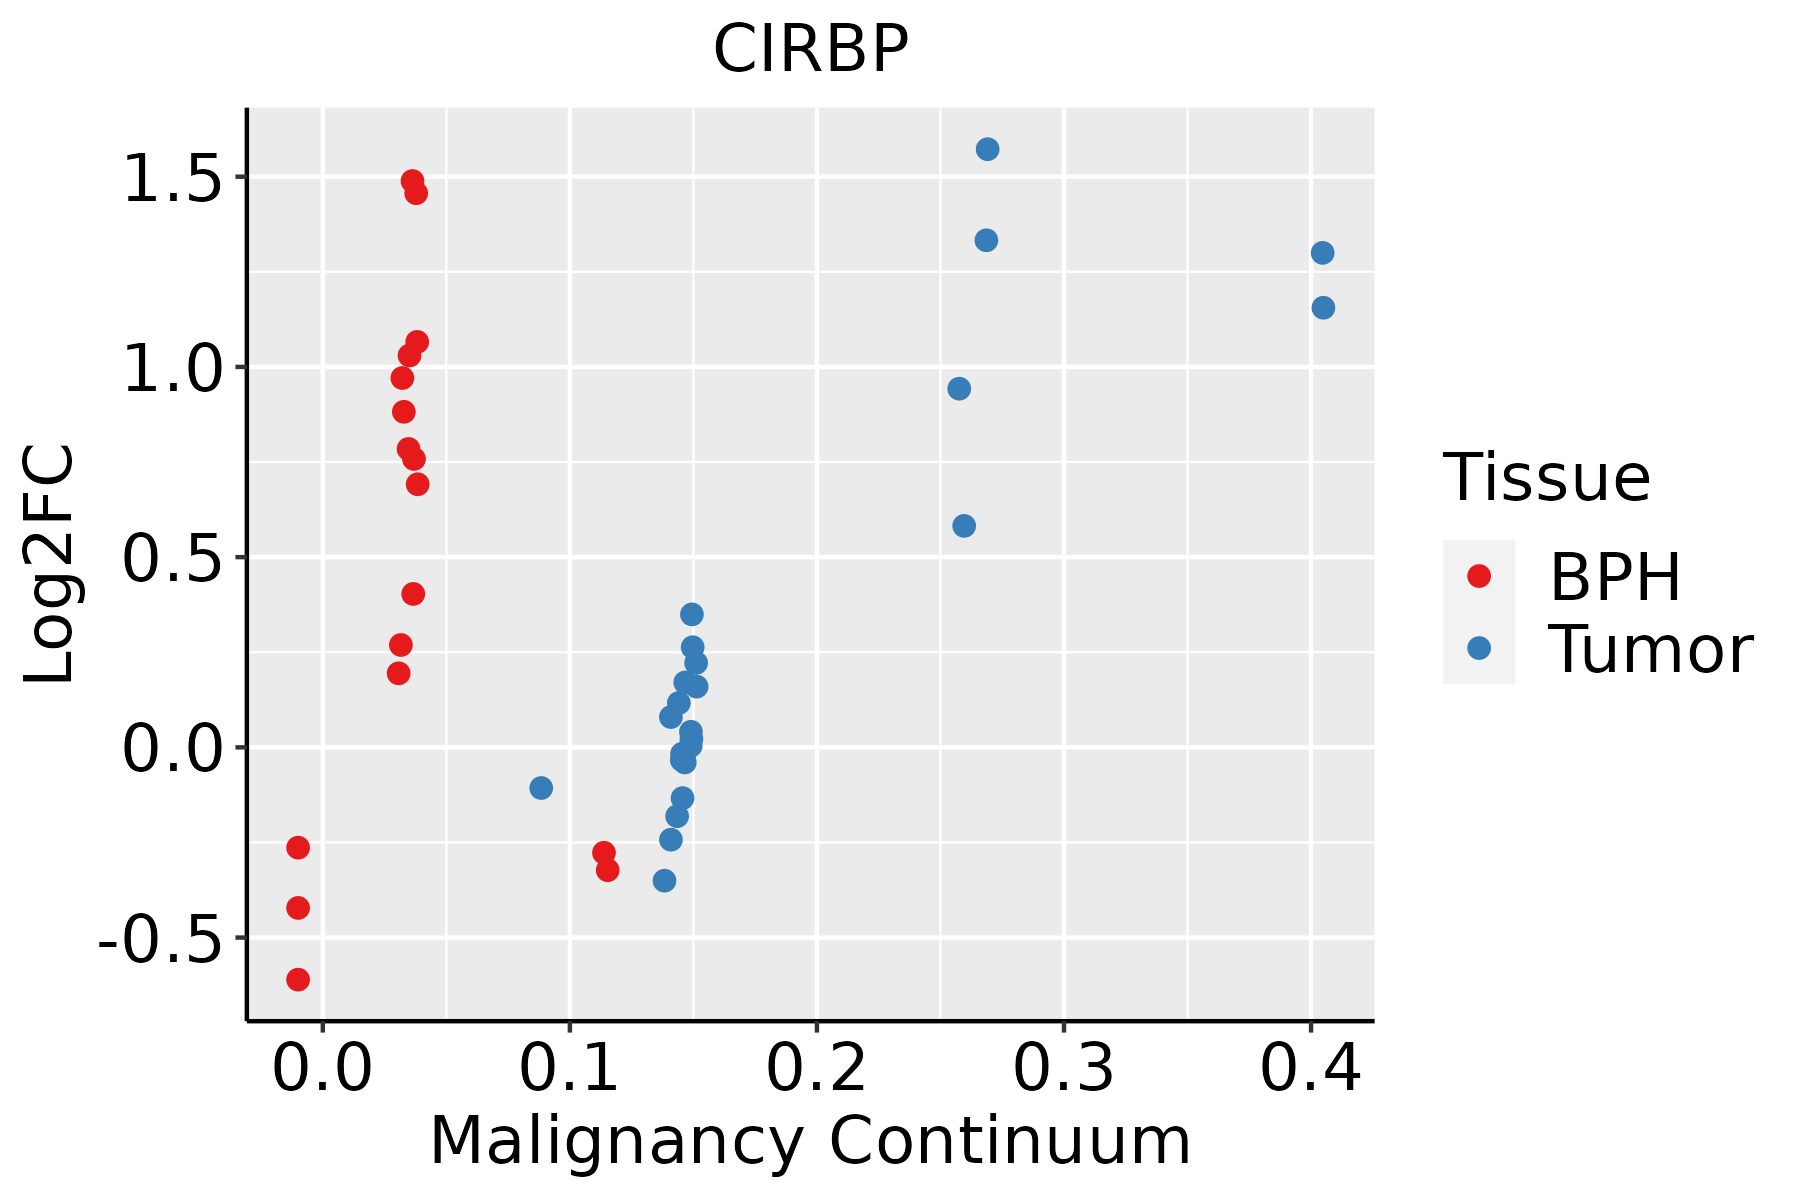 | BPH: Benign Prostatic Hyperplasia |
| Skin | 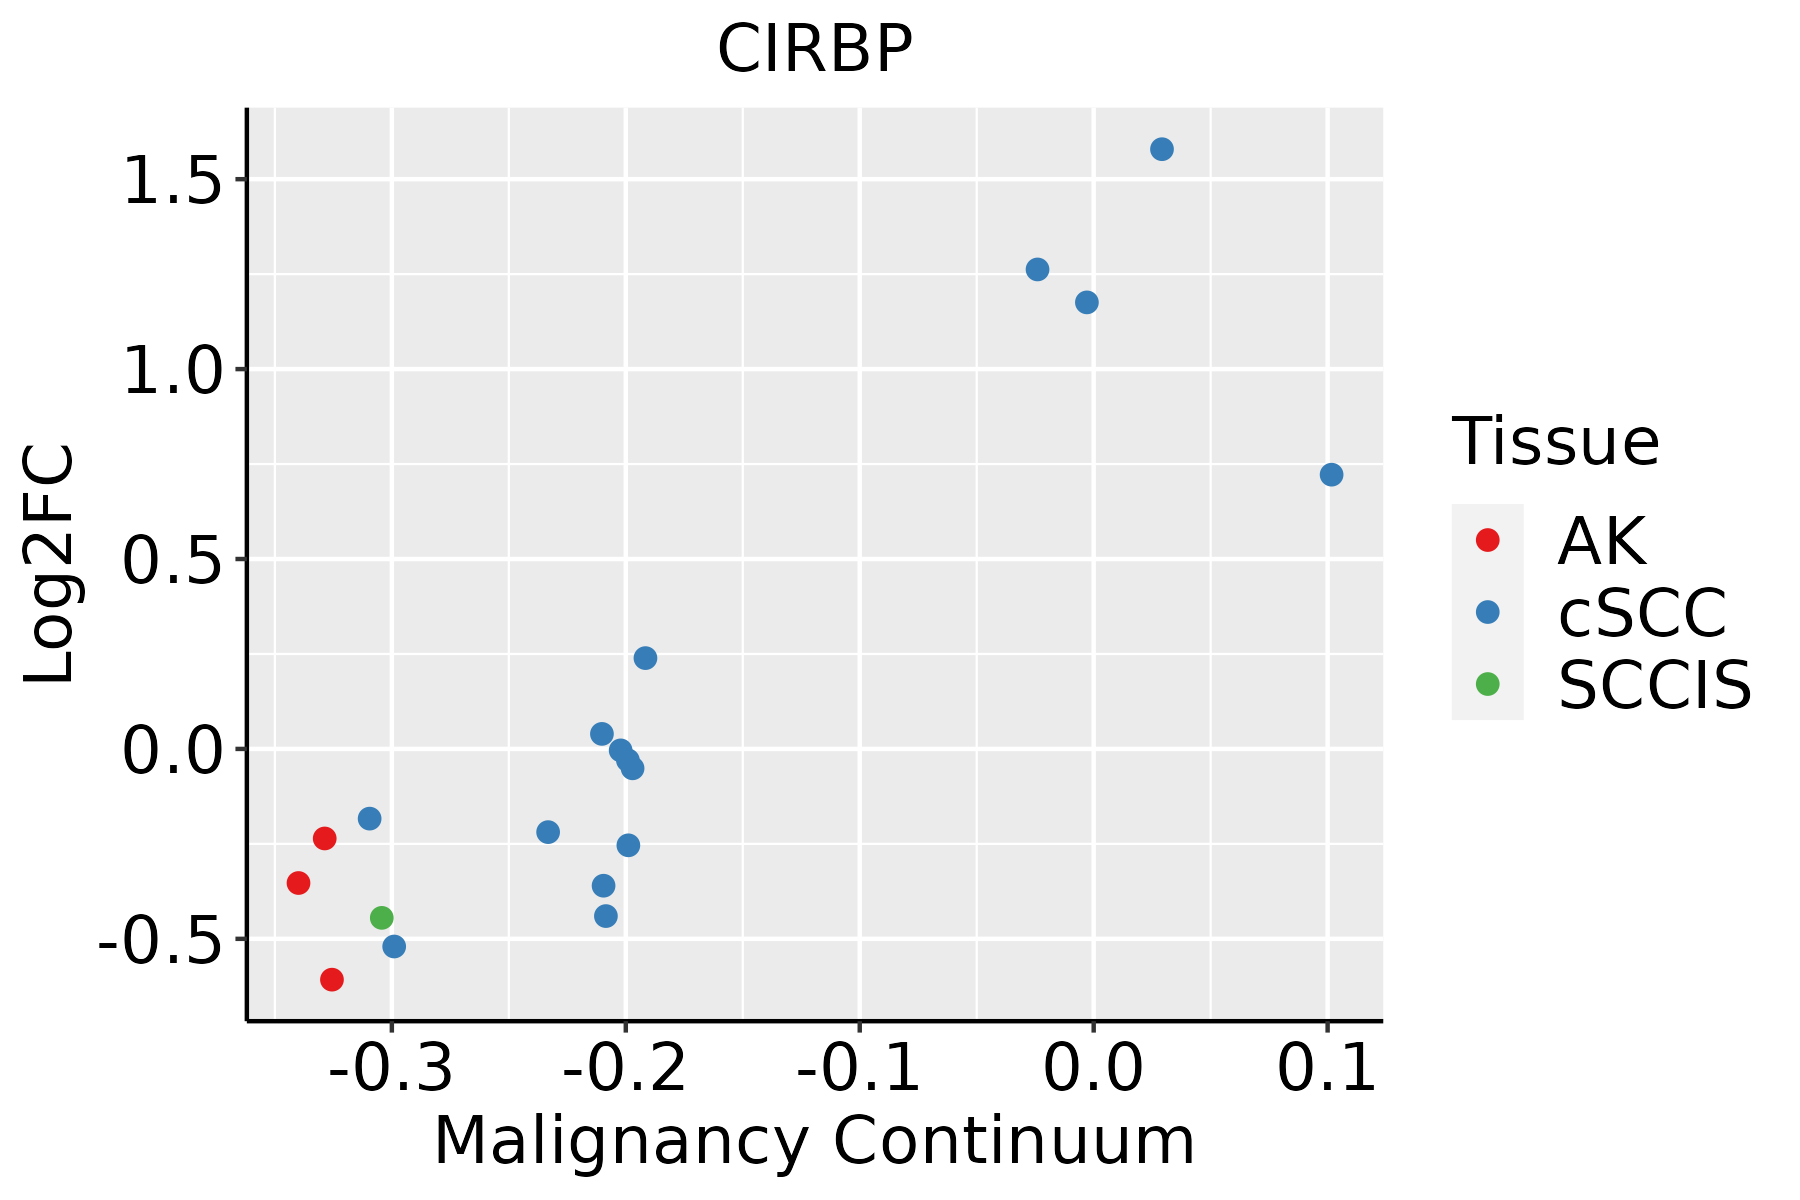 | AK: Actinic keratosis |
| cSCC: Cutaneous squamous cell carcinoma |
| SCCIS:squamous cell carcinoma in situ |
| Thyroid | 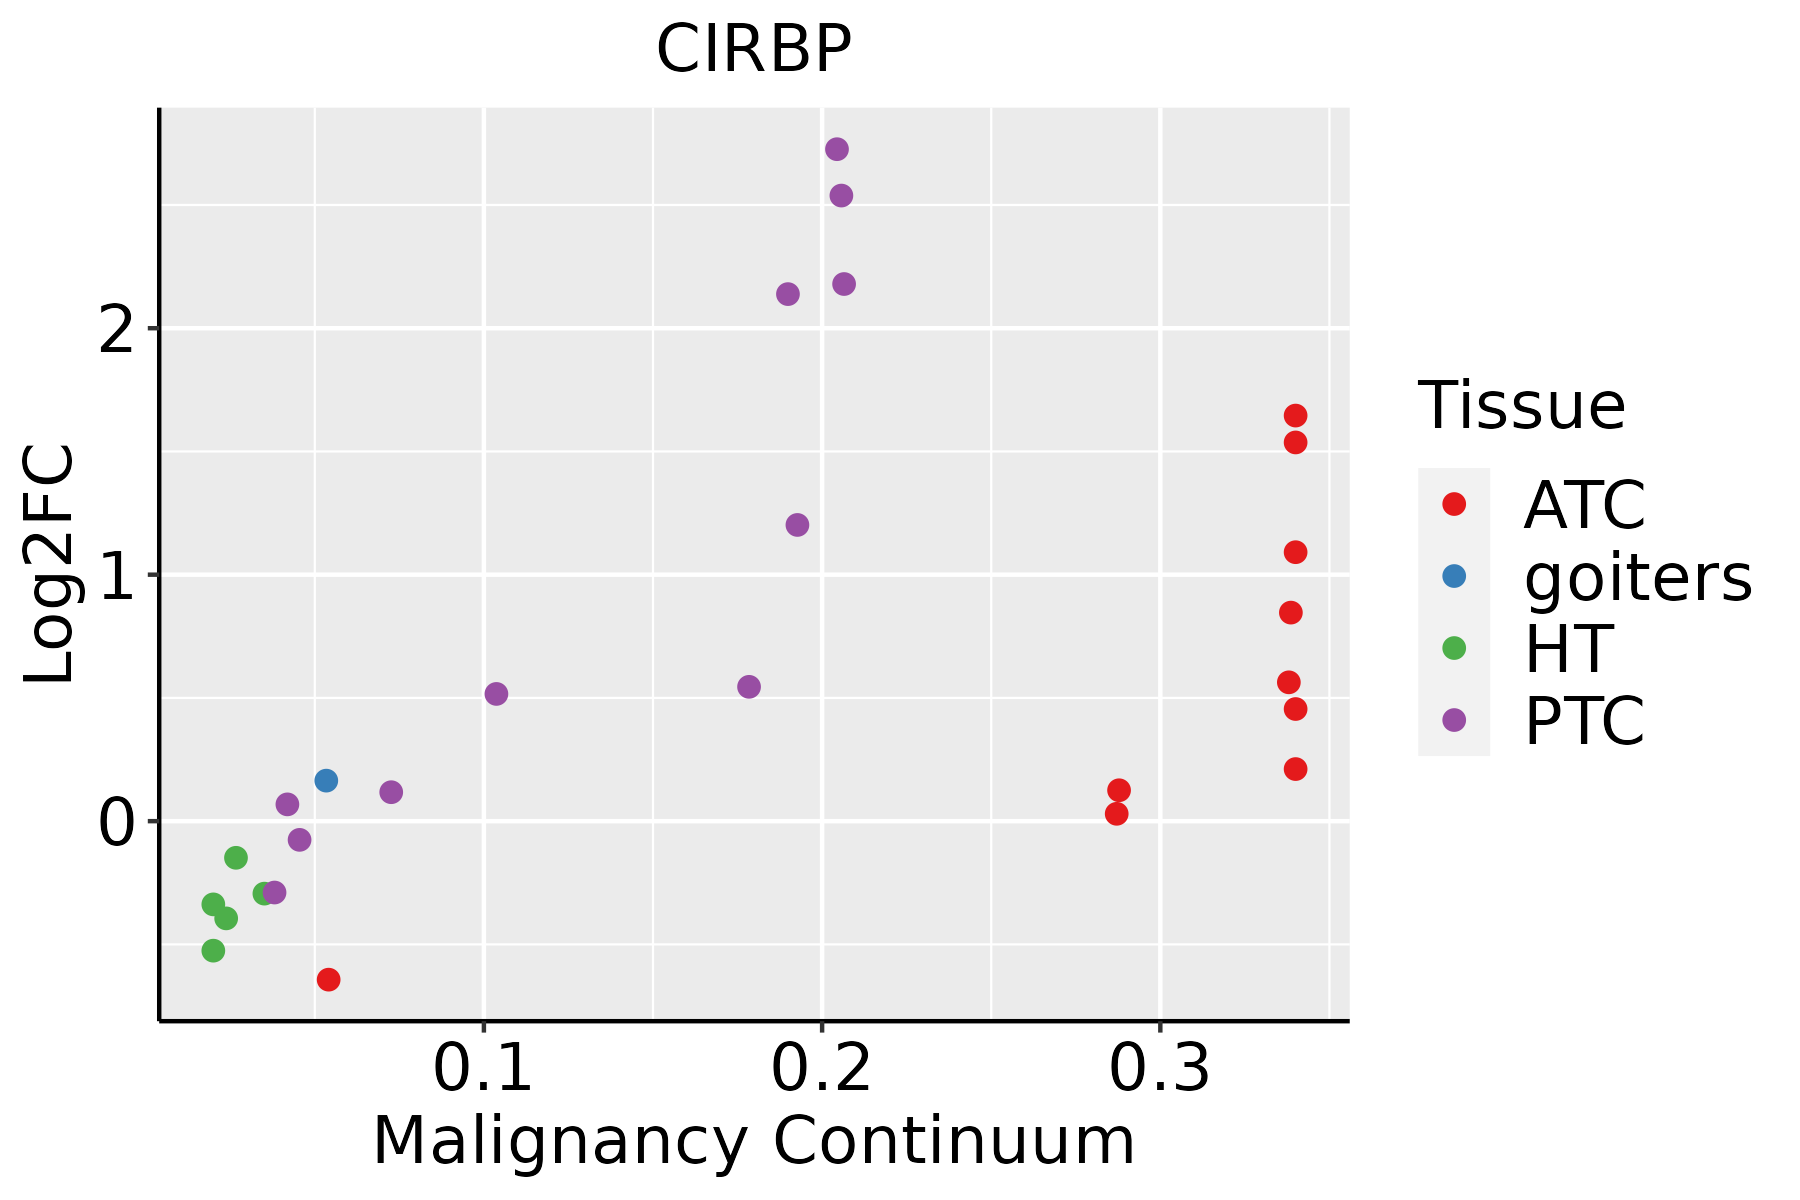 | ATC: Anaplastic thyroid cancer |
| HT: Hashimoto's thyroiditis |
| PTC: Papillary thyroid cancer |
| GO ID | Tissue | Disease Stage | Description | Gene Ratio | Bg Ratio | pvalue | p.adjust | Count |
| GO:000037541 | Stomach | SIM | RNA splicing, via transesterification reactions | 25/708 | 324/18723 | 6.24e-04 | 9.29e-03 | 25 |
| GO:000641751 | Stomach | SIM | regulation of translation | 32/708 | 468/18723 | 9.56e-04 | 1.27e-02 | 32 |
| GO:004802631 | Stomach | SIM | positive regulation of mRNA splicing, via spliceosome | 5/708 | 22/18723 | 1.17e-03 | 1.49e-02 | 5 |
| GO:000989551 | Stomach | SIM | negative regulation of catabolic process | 24/708 | 320/18723 | 1.18e-03 | 1.49e-02 | 24 |
| GO:003312031 | Stomach | SIM | positive regulation of RNA splicing | 6/708 | 37/18723 | 2.44e-03 | 2.47e-02 | 6 |
| GO:004802421 | Stomach | SIM | regulation of mRNA splicing, via spliceosome | 10/708 | 101/18723 | 4.88e-03 | 4.19e-02 | 10 |
| GO:004348430 | Thyroid | HT | regulation of RNA splicing | 46/1272 | 148/18723 | 4.82e-19 | 6.71e-16 | 46 |
| GO:000838028 | Thyroid | HT | RNA splicing | 84/1272 | 434/18723 | 1.23e-18 | 1.14e-15 | 84 |
| GO:000037527 | Thyroid | HT | RNA splicing, via transesterification reactions | 66/1272 | 324/18723 | 4.86e-16 | 2.08e-13 | 66 |
| GO:000037727 | Thyroid | HT | RNA splicing, via transesterification reactions with bulged adenosine as nucleophile | 65/1272 | 320/18723 | 9.43e-16 | 3.50e-13 | 65 |
| GO:000039827 | Thyroid | HT | mRNA splicing, via spliceosome | 65/1272 | 320/18723 | 9.43e-16 | 3.50e-13 | 65 |
| GO:004802429 | Thyroid | HT | regulation of mRNA splicing, via spliceosome | 34/1272 | 101/18723 | 1.32e-15 | 4.57e-13 | 34 |
| GO:005068426 | Thyroid | HT | regulation of mRNA processing | 39/1272 | 137/18723 | 6.30e-15 | 1.95e-12 | 39 |
| GO:000641730 | Thyroid | HT | regulation of translation | 78/1272 | 468/18723 | 1.12e-13 | 2.83e-11 | 78 |
| GO:190331127 | Thyroid | HT | regulation of mRNA metabolic process | 56/1272 | 288/18723 | 6.33e-13 | 1.47e-10 | 56 |
| GO:003425027 | Thyroid | HT | positive regulation of cellular amide metabolic process | 35/1272 | 162/18723 | 7.30e-10 | 8.12e-08 | 35 |
| GO:004572727 | Thyroid | HT | positive regulation of translation | 31/1272 | 136/18723 | 1.71e-09 | 1.78e-07 | 31 |
| GO:190331229 | Thyroid | HT | negative regulation of mRNA metabolic process | 24/1272 | 92/18723 | 6.91e-09 | 6.10e-07 | 24 |
| GO:000989528 | Thyroid | HT | negative regulation of catabolic process | 50/1272 | 320/18723 | 2.72e-08 | 2.02e-06 | 50 |
| GO:000640226 | Thyroid | HT | mRNA catabolic process | 40/1272 | 232/18723 | 4.42e-08 | 2.89e-06 | 40 |
| Hugo Symbol | Variant Class | Variant Classification | dbSNP RS | HGVSc | HGVSp | HGVSp Short | SWISSPROT | BIOTYPE | SIFT | PolyPhen | Tumor Sample Barcode | Tissue | Histology | Sex | Age | Stage | Therapy Types | Drugs | Outcome |
| CIRBP | SNV | Missense_Mutation | | c.820N>A | p.Val274Met | p.V274M | | protein_coding | tolerated_low_confidence(0.09) | benign(0.017) | TCGA-A8-A09I-01 | Breast | breast invasive carcinoma | Female | >=65 | I/II | Hormone Therapy | anastrozole | SD |
| CIRBP | SNV | Missense_Mutation | rs749046630 | c.493N>A | p.Asp165Asn | p.D165N | | protein_coding | deleterious(0) | possibly_damaging(0.632) | TCGA-A8-A0AD-01 | Breast | breast invasive carcinoma | Female | >=65 | I/II | Hormone Therapy | tamoxiphen | SD |
| CIRBP | SNV | Missense_Mutation | rs148277498 | c.791N>A | p.Arg264His | p.R264H | | protein_coding | deleterious_low_confidence(0.03) | benign(0) | TCGA-E2-A14Z-01 | Breast | breast invasive carcinoma | Female | <65 | I/II | Hormone Therapy | arimidex | PD |
| CIRBP | SNV | Missense_Mutation | | c.758C>G | p.Ser253Cys | p.S253C | | protein_coding | tolerated_low_confidence(0.06) | benign(0.146) | TCGA-E2-A1IN-01 | Breast | breast invasive carcinoma | Female | <65 | I/II | Hormone Therapy | arimidex | SD |
| CIRBP | SNV | Missense_Mutation | | c.80C>T | p.Ser27Leu | p.S27L | | protein_coding | deleterious(0) | probably_damaging(0.975) | TCGA-C5-A7UH-01 | Cervix | cervical & endocervical cancer | Female | <65 | III/IV | Chemotherapy | cisplatin | SD |
| CIRBP | SNV | Missense_Mutation | novel | c.643C>G | p.Gln215Glu | p.Q215E | | protein_coding | tolerated_low_confidence(0.06) | benign(0) | TCGA-DS-A0VN-01 | Cervix | cervical & endocervical cancer | Female | <65 | I/II | Chemotherapy | cisplatin | SD |
| CIRBP | SNV | Missense_Mutation | | c.98N>T | p.Ser33Phe | p.S33F | | protein_coding | deleterious(0.04) | probably_damaging(0.986) | TCGA-EA-A3HQ-01 | Cervix | cervical & endocervical cancer | Female | <65 | I/II | Unknown | Unknown | SD |
| CIRBP | SNV | Missense_Mutation | | c.731N>A | p.Arg244Lys | p.R244K | | protein_coding | tolerated_low_confidence(0.06) | benign(0) | TCGA-AA-A01D-01 | Colorectum | colon adenocarcinoma | Female | <65 | III/IV | Chemotherapy | capecitabine | PD |
| CIRBP | SNV | Missense_Mutation | rs11555031 | c.49N>G | p.Thr17Ala | p.T17A | | protein_coding | deleterious(0) | probably_damaging(0.988) | TCGA-AA-A02R-01 | Colorectum | colon adenocarcinoma | Female | >=65 | I/II | Unknown | Unknown | PD |
| CIRBP | SNV | Missense_Mutation | | c.5N>T | p.Ala2Val | p.A2V | | protein_coding | deleterious(0) | possibly_damaging(0.526) | TCGA-AG-A02N-01 | Colorectum | rectum adenocarcinoma | Male | >=65 | I/II | Chemotherapy | folinic | CR |


