| Tissue | Expression Dynamics | Abbreviation |
| Breast | 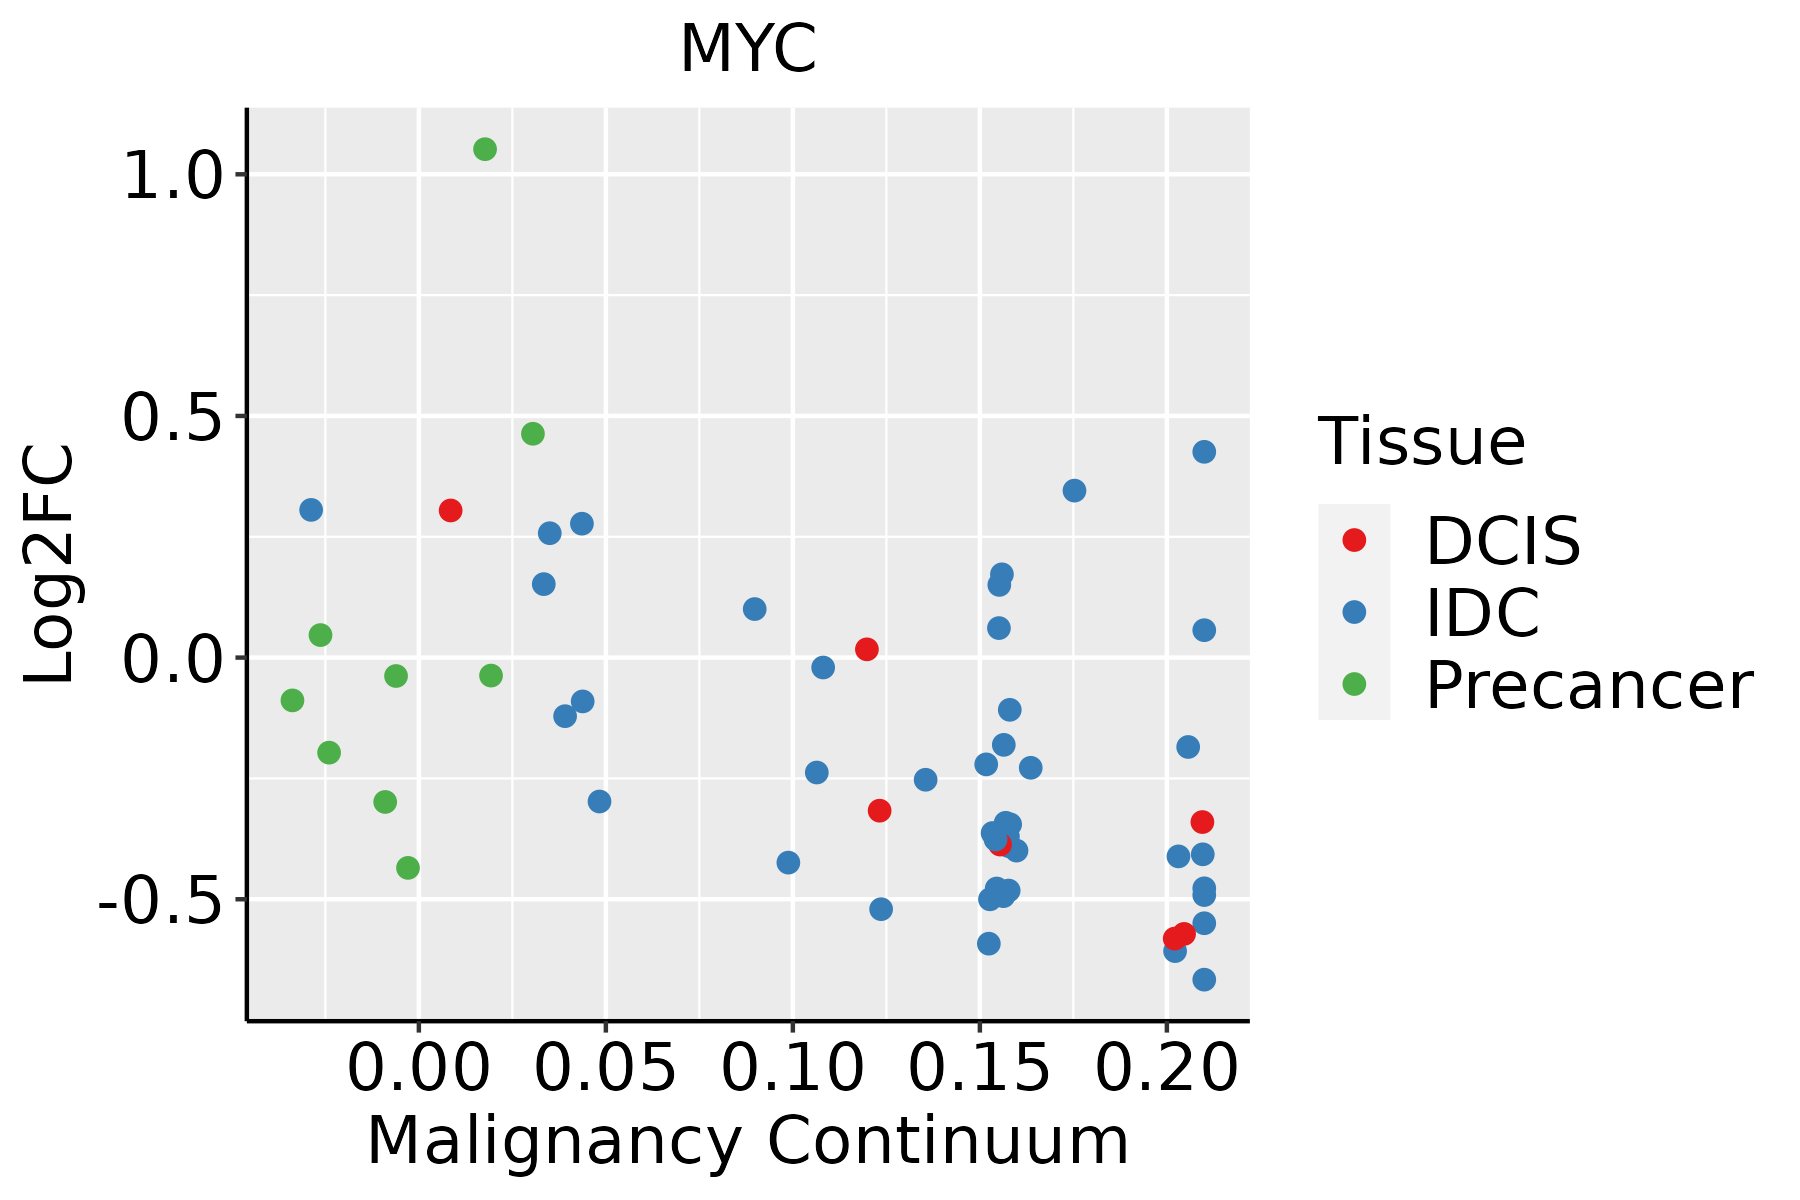 | IDC: Invasive ductal carcinoma |
| DCIS: Ductal carcinoma in situ |
| Precancer(BRCA1-mut): Precancerous lesion from BRCA1 mutation carriers |
| Cervix | 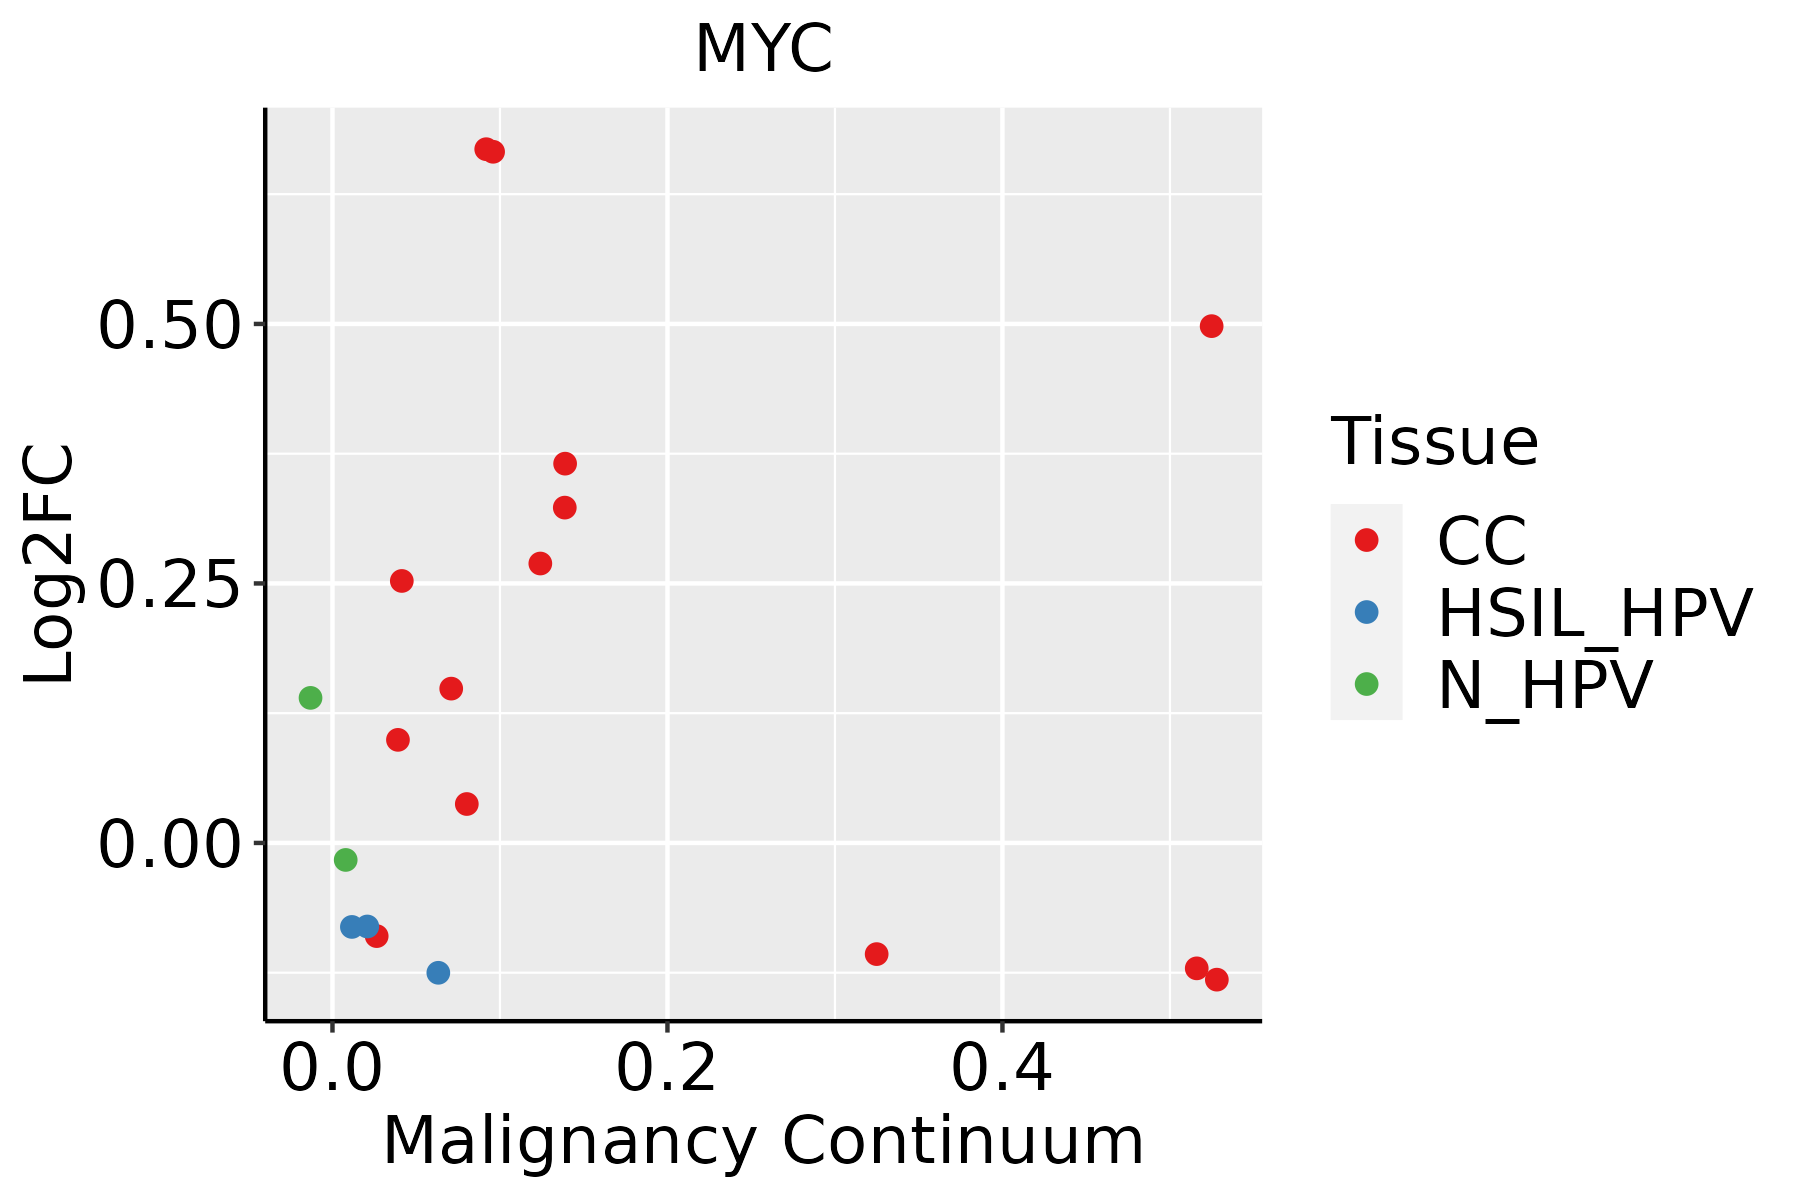 | CC: Cervix cancer |
| HSIL_HPV: HPV-infected high-grade squamous intraepithelial lesions |
| N_HPV: HPV-infected normal cervix |
| Colorectum (GSE201348) |  | FAP: Familial adenomatous polyposis |
| CRC: Colorectal cancer |
| Colorectum (HTA11) |  | AD: Adenomas |
| SER: Sessile serrated lesions |
| MSI-H: Microsatellite-high colorectal cancer |
| MSS: Microsatellite stable colorectal cancer |
| Esophagus | 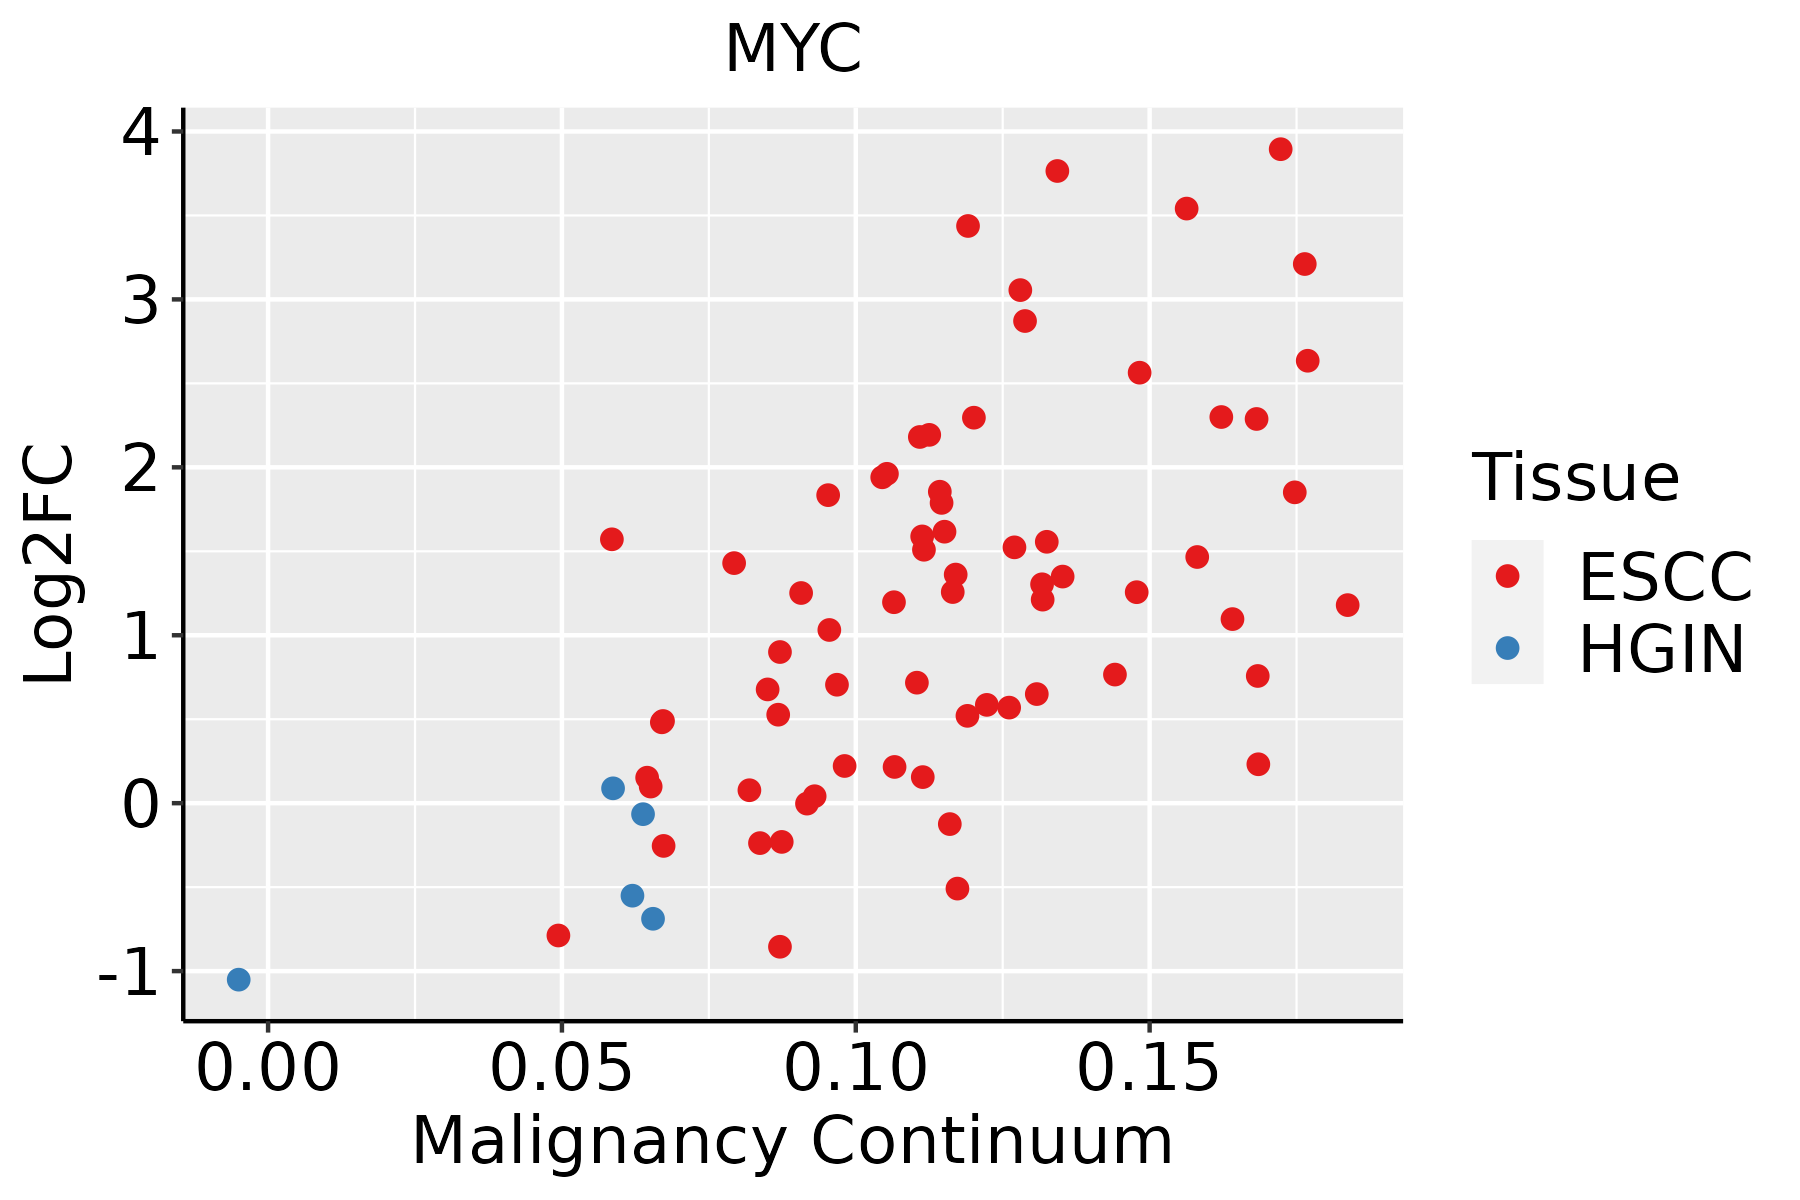 | ESCC: Esophageal squamous cell carcinoma |
| HGIN: High-grade intraepithelial neoplasias |
| LGIN: Low-grade intraepithelial neoplasias |
| Liver |  | HCC: Hepatocellular carcinoma |
| NAFLD: Non-alcoholic fatty liver disease |
| Oral Cavity |  | EOLP: Erosive Oral lichen planus |
| LP: leukoplakia |
| NEOLP: Non-erosive oral lichen planus |
| OSCC: Oral squamous cell carcinoma |
| Prostate | 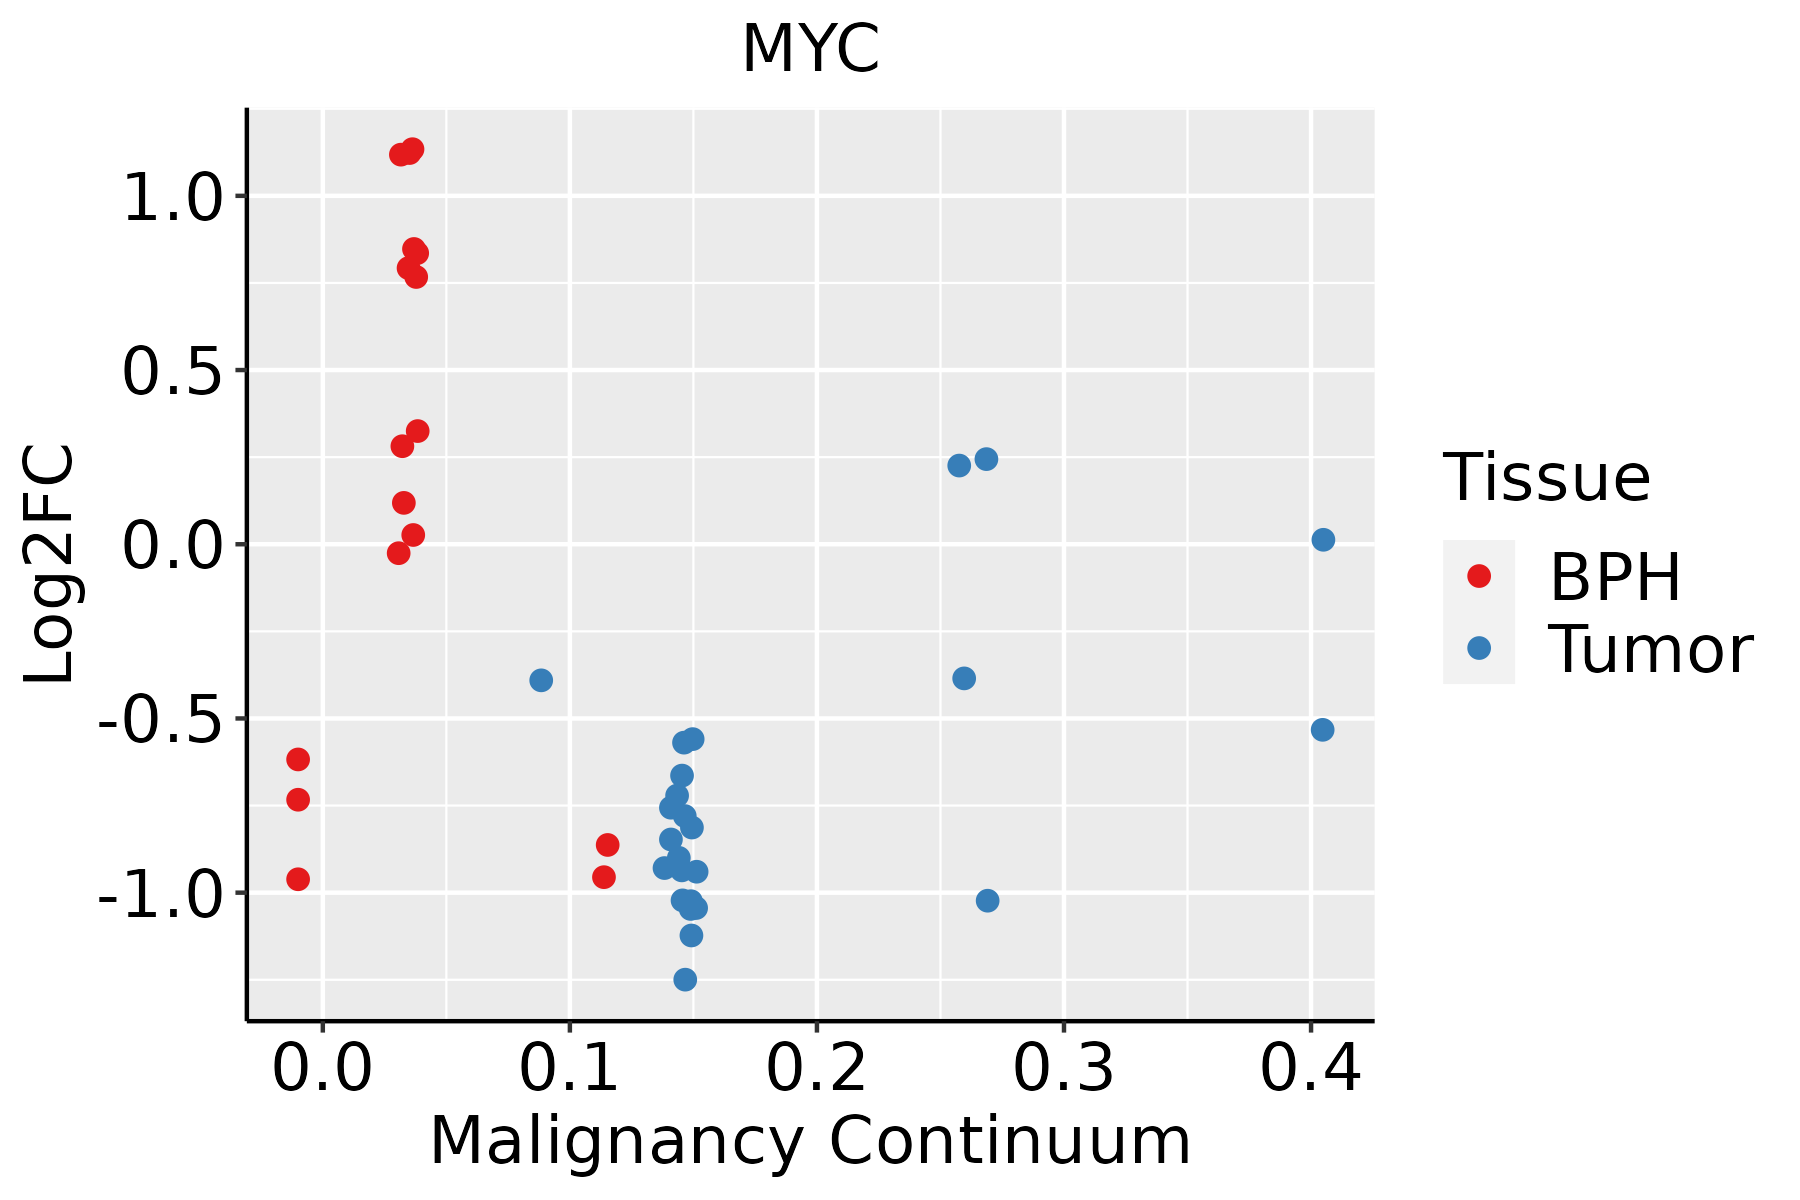 | BPH: Benign Prostatic Hyperplasia |
| Skin | 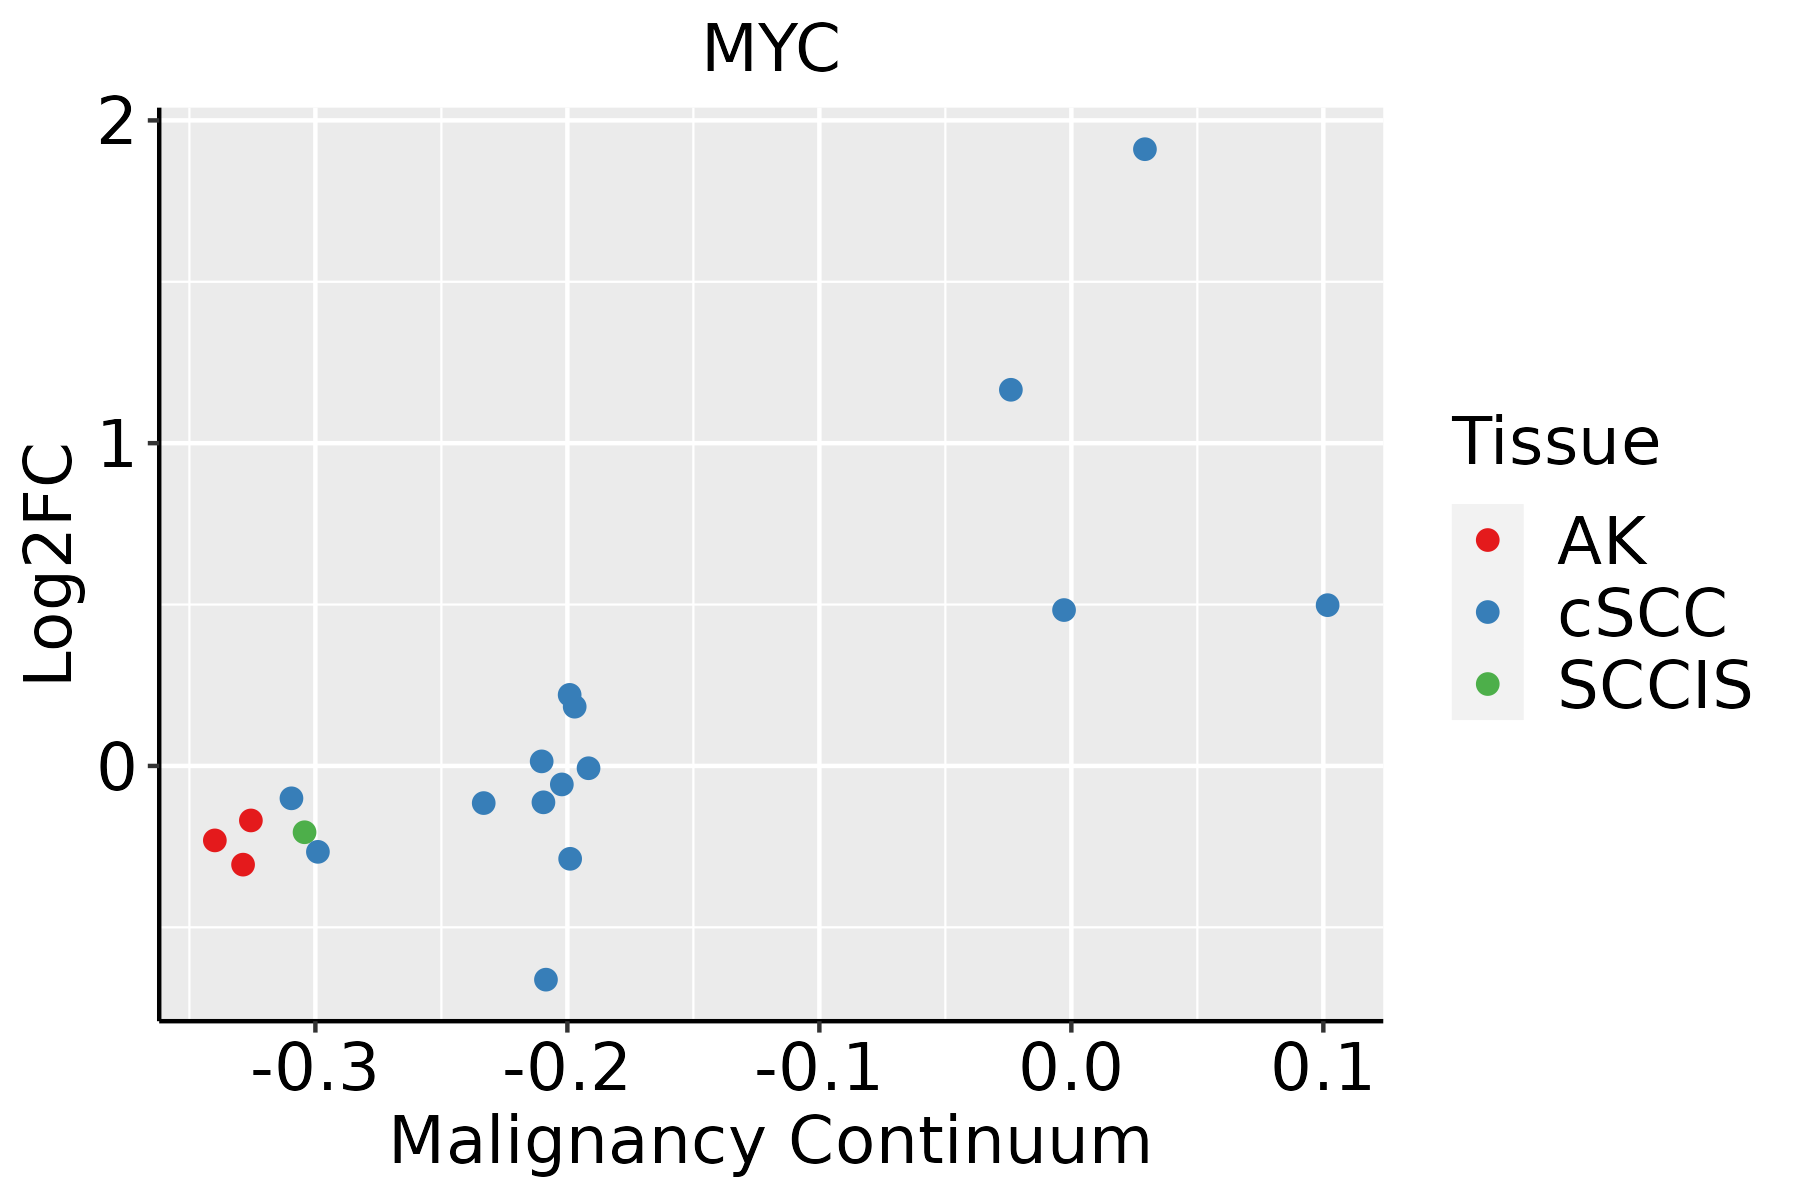 | AK: Actinic keratosis |
| cSCC: Cutaneous squamous cell carcinoma |
| SCCIS:squamous cell carcinoma in situ |
| Thyroid | 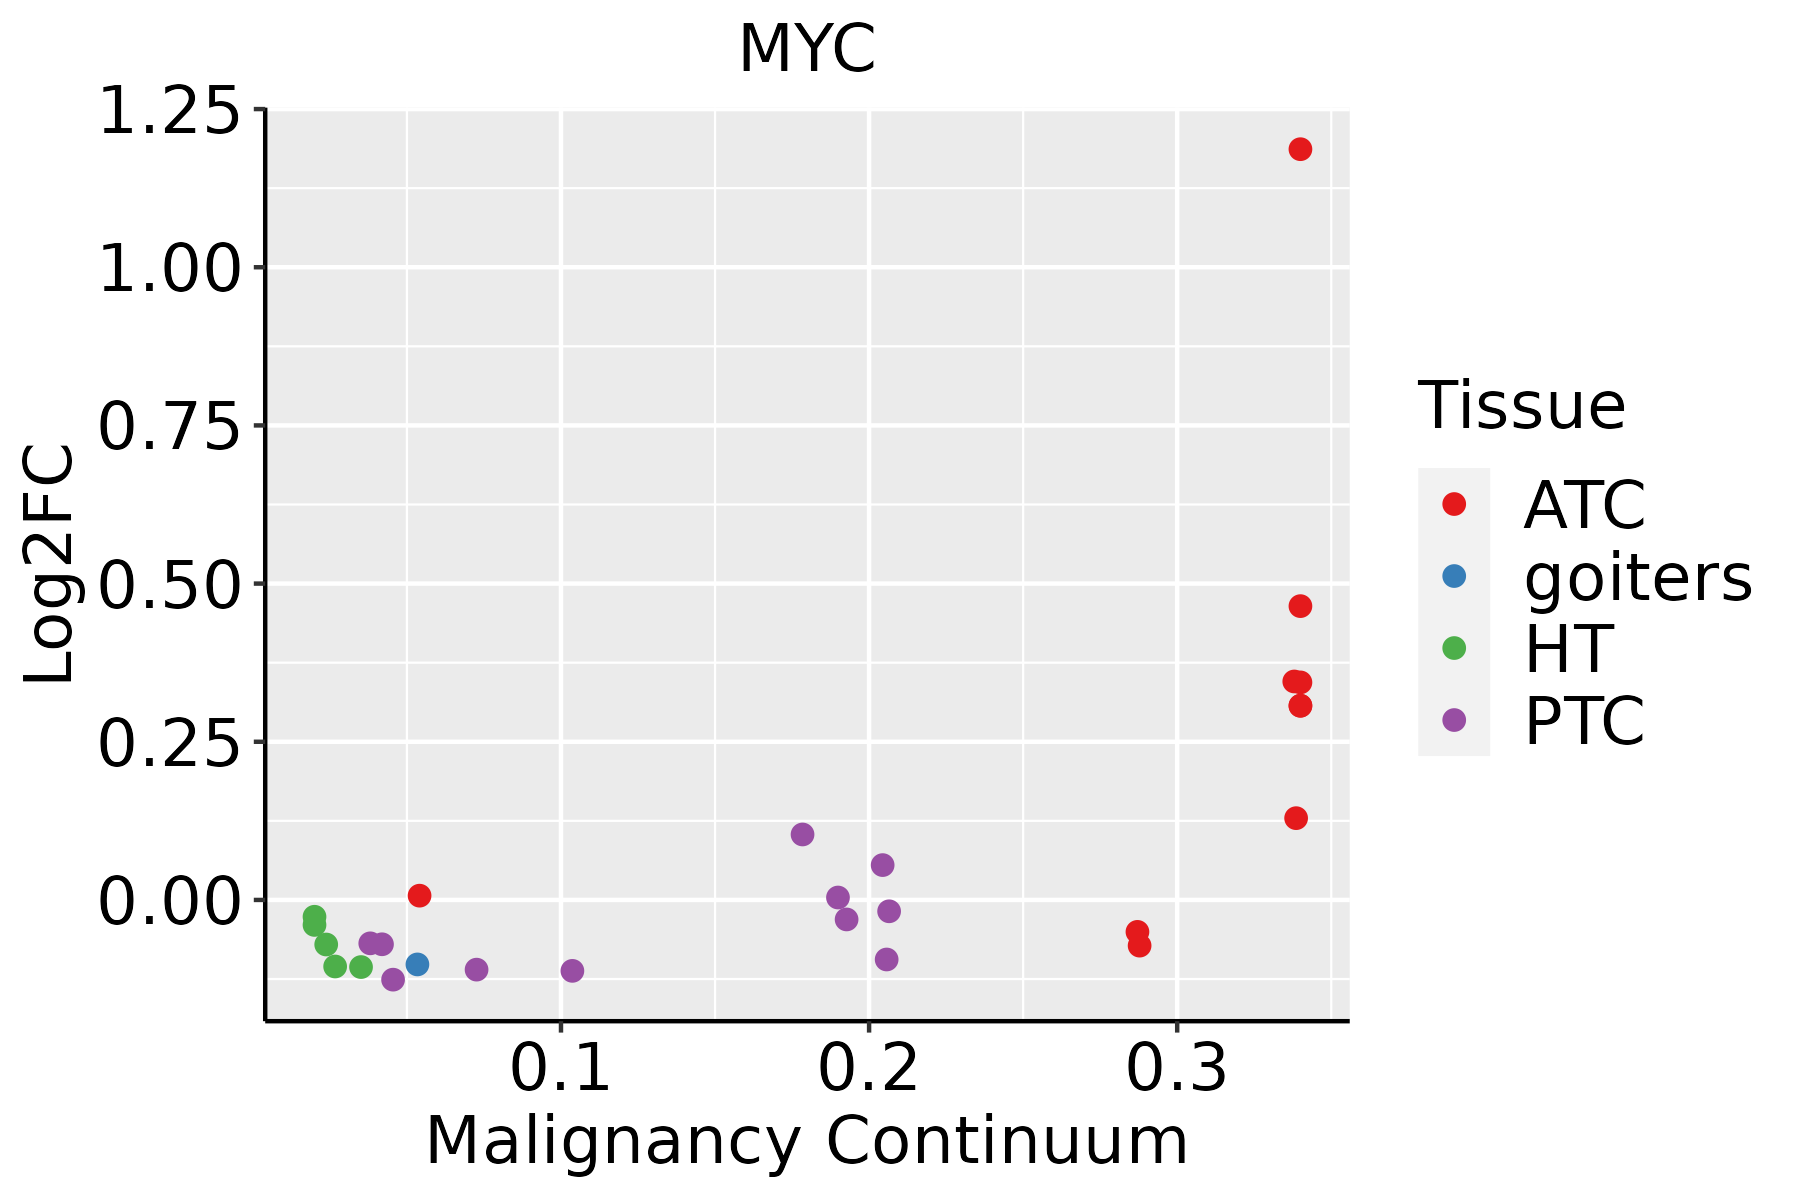 | ATC: Anaplastic thyroid cancer |
| HT: Hashimoto's thyroiditis |
| PTC: Papillary thyroid cancer |
| GO ID | Tissue | Disease Stage | Description | Gene Ratio | Bg Ratio | pvalue | p.adjust | Count |
| GO:001982713 | Oral cavity | EOLP | stem cell population maintenance | 38/2218 | 131/18723 | 9.10e-08 | 3.15e-06 | 38 |
| GO:190313114 | Oral cavity | EOLP | mononuclear cell differentiation | 88/2218 | 426/18723 | 1.07e-07 | 3.61e-06 | 88 |
| GO:009872713 | Oral cavity | EOLP | maintenance of cell number | 38/2218 | 134/18723 | 1.74e-07 | 5.61e-06 | 38 |
| GO:001095024 | Oral cavity | EOLP | positive regulation of endopeptidase activity | 46/2218 | 179/18723 | 2.35e-07 | 7.37e-06 | 46 |
| GO:000632515 | Oral cavity | EOLP | chromatin organization | 84/2218 | 409/18723 | 2.68e-07 | 8.16e-06 | 84 |
| GO:0045637110 | Oral cavity | EOLP | regulation of myeloid cell differentiation | 51/2218 | 210/18723 | 3.63e-07 | 1.05e-05 | 51 |
| GO:005105222 | Oral cavity | EOLP | regulation of DNA metabolic process | 75/2218 | 359/18723 | 5.81e-07 | 1.53e-05 | 75 |
| GO:190210514 | Oral cavity | EOLP | regulation of leukocyte differentiation | 62/2218 | 279/18723 | 6.18e-07 | 1.60e-05 | 62 |
| GO:000072322 | Oral cavity | EOLP | telomere maintenance | 36/2218 | 131/18723 | 8.39e-07 | 2.10e-05 | 36 |
| GO:200105623 | Oral cavity | EOLP | positive regulation of cysteine-type endopeptidase activity | 39/2218 | 148/18723 | 9.60e-07 | 2.38e-05 | 39 |
| GO:000166624 | Oral cavity | EOLP | response to hypoxia | 65/2218 | 307/18723 | 2.00e-06 | 4.55e-05 | 65 |
| GO:000257323 | Oral cavity | EOLP | myeloid leukocyte differentiation | 48/2218 | 208/18723 | 3.71e-06 | 7.88e-05 | 48 |
| GO:007048224 | Oral cavity | EOLP | response to oxygen levels | 70/2218 | 347/18723 | 5.00e-06 | 1.02e-04 | 70 |
| GO:003629324 | Oral cavity | EOLP | response to decreased oxygen levels | 66/2218 | 322/18723 | 5.31e-06 | 1.07e-04 | 66 |
| GO:003220422 | Oral cavity | EOLP | regulation of telomere maintenance | 24/2218 | 80/18723 | 1.09e-05 | 1.93e-04 | 24 |
| GO:004328023 | Oral cavity | EOLP | positive regulation of cysteine-type endopeptidase activity involved in apoptotic process | 33/2218 | 129/18723 | 1.26e-05 | 2.15e-04 | 33 |
| GO:005105421 | Oral cavity | EOLP | positive regulation of DNA metabolic process | 45/2218 | 201/18723 | 1.68e-05 | 2.77e-04 | 45 |
| GO:003298421 | Oral cavity | EOLP | protein-containing complex disassembly | 48/2218 | 224/18723 | 3.01e-05 | 4.30e-04 | 48 |
| GO:200102024 | Oral cavity | EOLP | regulation of response to DNA damage stimulus | 47/2218 | 219/18723 | 3.47e-05 | 4.85e-04 | 47 |
| GO:000762317 | Oral cavity | EOLP | circadian rhythm | 45/2218 | 210/18723 | 5.24e-05 | 6.79e-04 | 45 |
| Pathway ID | Tissue | Disease Stage | Description | Gene Ratio | Bg Ratio | pvalue | p.adjust | qvalue | Count |
| hsa0513218 | Breast | Precancer | Salmonella infection | 49/684 | 249/8465 | 2.92e-09 | 6.15e-08 | 4.71e-08 | 49 |
| hsa0516718 | Breast | Precancer | Kaposi sarcoma-associated herpesvirus infection | 36/684 | 194/8465 | 1.68e-06 | 2.53e-05 | 1.94e-05 | 36 |
| hsa0516918 | Breast | Precancer | Epstein-Barr virus infection | 35/684 | 202/8465 | 1.15e-05 | 1.26e-04 | 9.64e-05 | 35 |
| hsa0516618 | Breast | Precancer | Human T-cell leukemia virus 1 infection | 33/684 | 222/8465 | 4.29e-04 | 3.31e-03 | 2.53e-03 | 33 |
| hsa0520514 | Breast | Precancer | Proteoglycans in cancer | 30/684 | 205/8465 | 1.00e-03 | 7.18e-03 | 5.50e-03 | 30 |
| hsa0516316 | Breast | Precancer | Human cytomegalovirus infection | 32/684 | 225/8465 | 1.13e-03 | 7.57e-03 | 5.80e-03 | 32 |
| hsa0513219 | Breast | Precancer | Salmonella infection | 49/684 | 249/8465 | 2.92e-09 | 6.15e-08 | 4.71e-08 | 49 |
| hsa0516719 | Breast | Precancer | Kaposi sarcoma-associated herpesvirus infection | 36/684 | 194/8465 | 1.68e-06 | 2.53e-05 | 1.94e-05 | 36 |
| hsa0516919 | Breast | Precancer | Epstein-Barr virus infection | 35/684 | 202/8465 | 1.15e-05 | 1.26e-04 | 9.64e-05 | 35 |
| hsa0516619 | Breast | Precancer | Human T-cell leukemia virus 1 infection | 33/684 | 222/8465 | 4.29e-04 | 3.31e-03 | 2.53e-03 | 33 |
| hsa0520515 | Breast | Precancer | Proteoglycans in cancer | 30/684 | 205/8465 | 1.00e-03 | 7.18e-03 | 5.50e-03 | 30 |
| hsa0516317 | Breast | Precancer | Human cytomegalovirus infection | 32/684 | 225/8465 | 1.13e-03 | 7.57e-03 | 5.80e-03 | 32 |
| hsa0513224 | Breast | IDC | Salmonella infection | 55/867 | 249/8465 | 2.07e-08 | 4.49e-07 | 3.36e-07 | 55 |
| hsa0516922 | Breast | IDC | Epstein-Barr virus infection | 45/867 | 202/8465 | 3.16e-07 | 6.05e-06 | 4.52e-06 | 45 |
| hsa0421824 | Breast | IDC | Cellular senescence | 35/867 | 156/8465 | 5.49e-06 | 7.43e-05 | 5.56e-05 | 35 |
| hsa0520523 | Breast | IDC | Proteoglycans in cancer | 42/867 | 205/8465 | 7.69e-06 | 9.99e-05 | 7.48e-05 | 42 |
| hsa0516723 | Breast | IDC | Kaposi sarcoma-associated herpesvirus infection | 38/867 | 194/8465 | 5.87e-05 | 5.96e-04 | 4.46e-04 | 38 |
| hsa0516624 | Breast | IDC | Human T-cell leukemia virus 1 infection | 40/867 | 222/8465 | 2.52e-04 | 2.21e-03 | 1.66e-03 | 40 |
| hsa0516324 | Breast | IDC | Human cytomegalovirus infection | 39/867 | 225/8465 | 6.66e-04 | 5.41e-03 | 4.05e-03 | 39 |
| hsa0491916 | Breast | IDC | Thyroid hormone signaling pathway | 23/867 | 121/8465 | 2.45e-03 | 1.69e-02 | 1.27e-02 | 23 |
| Hugo Symbol | Variant Class | Variant Classification | dbSNP RS | HGVSc | HGVSp | HGVSp Short | SWISSPROT | BIOTYPE | SIFT | PolyPhen | Tumor Sample Barcode | Tissue | Histology | Sex | Age | Stage | Therapy Types | Drugs | Outcome |
| MYC | SNV | Missense_Mutation | rs147506213 | c.697C>A | p.Pro233Thr | p.P233T | | protein_coding | tolerated(0.22) | benign(0.003) | TCGA-B6-A0I1-01 | Breast | breast invasive carcinoma | Female | >=65 | I/II | Unknown | Unknown | PD |
| MYC | SNV | Missense_Mutation | | c.1291N>A | p.Glu431Lys | p.E431K | | protein_coding | tolerated(0.3) | benign(0.096) | TCGA-D8-A147-01 | Breast | breast invasive carcinoma | Female | <65 | I/II | Chemotherapy | doxorubicine | SD |
| MYC | SNV | Missense_Mutation | | c.517G>C | p.Asp173His | p.D173H | | protein_coding | deleterious(0.03) | probably_damaging(0.999) | TCGA-D8-A1JK-01 | Breast | breast invasive carcinoma | Female | >=65 | I/II | Unknown | Unknown | SD |
| MYC | insertion | Frame_Shift_Ins | novel | c.528_529insTATGA | p.Pro177TyrfsTer22 | p.P177Yfs*22 | | protein_coding | | | TCGA-AO-A0J5-01 | Breast | breast invasive carcinoma | Female | <65 | III/IV | Other, specify in notesBisphosphonate | zoledronic | PD |
| MYC | insertion | Frame_Shift_Ins | novel | c.530_531insTCGACTACGACTCGGTGCA | p.Asn178ArgfsTer86 | p.N178Rfs*86 | | protein_coding | | | TCGA-AO-A0J5-01 | Breast | breast invasive carcinoma | Female | <65 | III/IV | Other, specify in notesBisphosphonate | zoledronic | PD |
| MYC | SNV | Missense_Mutation | | c.482N>T | p.Ser161Leu | p.S161L | | protein_coding | deleterious(0) | probably_damaging(0.981) | TCGA-DS-A1OB-01 | Cervix | cervical & endocervical cancer | Female | <65 | I/II | Chemotherapy | carboplatin | PD |
| MYC | SNV | Missense_Mutation | | c.986N>T | p.Ser329Phe | p.S329F | | protein_coding | tolerated(0.48) | possibly_damaging(0.622) | TCGA-JW-A5VL-01 | Cervix | cervical & endocervical cancer | Female | <65 | I/II | Unknown | Unknown | SD |
| MYC | SNV | Missense_Mutation | | c.875N>T | p.Ser292Leu | p.S292L | | protein_coding | deleterious(0.04) | possibly_damaging(0.835) | TCGA-LP-A7HU-01 | Cervix | cervical & endocervical cancer | Female | <65 | I/II | Unknown | Unknown | SD |
| MYC | SNV | Missense_Mutation | | c.482C>T | p.Ser161Leu | p.S161L | | protein_coding | deleterious(0) | probably_damaging(0.981) | TCGA-A6-5659-01 | Colorectum | colon adenocarcinoma | Male | >=65 | I/II | Unknown | Unknown | SD |
| MYC | SNV | Missense_Mutation | | c.470C>T | p.Ala157Val | p.A157V | | protein_coding | deleterious(0.03) | probably_damaging(0.99) | TCGA-A6-5661-01 | Colorectum | colon adenocarcinoma | Female | >=65 | I/II | Unknown | Unknown | SD |
| Entrez ID | Symbol | Category | Interaction Types | Drug Claim Name | Drug Name | PMIDs |
| 4609 | MYC | TRANSCRIPTION FACTOR, CLINICALLY ACTIONABLE | | BAY1000394 | | |
| 4609 | MYC | TRANSCRIPTION FACTOR, CLINICALLY ACTIONABLE | | ORNITHINE DECARBOXYLASE INHIBITOR | | 11876528 |
| 4609 | MYC | TRANSCRIPTION FACTOR, CLINICALLY ACTIONABLE | | PROTEASOME INHIBITOR | | 16186809 |
| 4609 | MYC | TRANSCRIPTION FACTOR, CLINICALLY ACTIONABLE | | HISTONE DEACETYLASE INHIBITOR | | 15474507 |
| 4609 | MYC | TRANSCRIPTION FACTOR, CLINICALLY ACTIONABLE | | FOLIC ACID | | 3479800 |
| 4609 | MYC | TRANSCRIPTION FACTOR, CLINICALLY ACTIONABLE | | GLN | GLUTAMINE | 16898871 |
| 4609 | MYC | TRANSCRIPTION FACTOR, CLINICALLY ACTIONABLE | | AN-9 | AN-9 | 8348968 |
| 4609 | MYC | TRANSCRIPTION FACTOR, CLINICALLY ACTIONABLE | | PROTOPORPHYRIN | PROTOPORPHYRIN | 9868803 |
| 4609 | MYC | TRANSCRIPTION FACTOR, CLINICALLY ACTIONABLE | | POH | | 16439861 |
| 4609 | MYC | TRANSCRIPTION FACTOR, CLINICALLY ACTIONABLE | | HYPOXANTHINE | HYPOXANTHINE | 3528863 |


