| Tissue | Expression Dynamics | Abbreviation |
| Cervix | 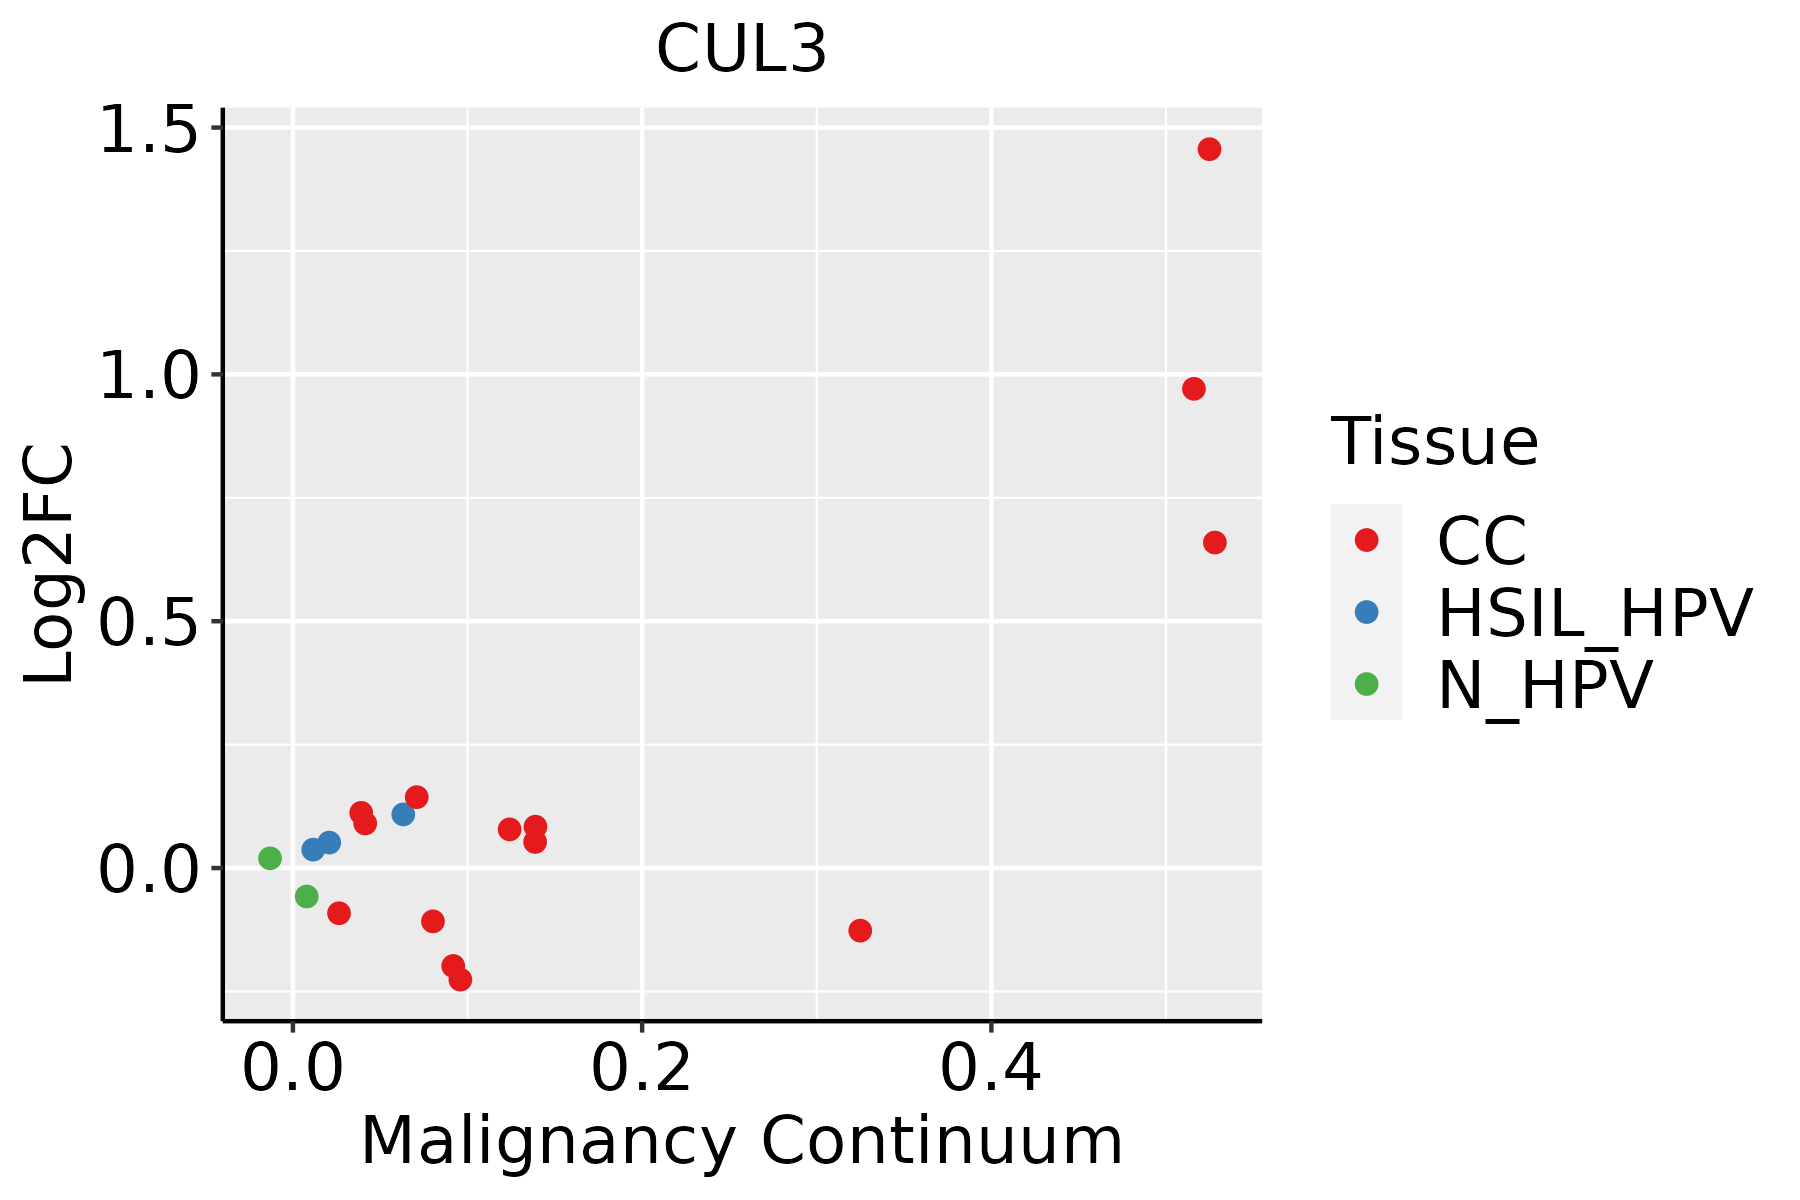 | CC: Cervix cancer |
| HSIL_HPV: HPV-infected high-grade squamous intraepithelial lesions |
| N_HPV: HPV-infected normal cervix |
| Colorectum (GSE201348) | 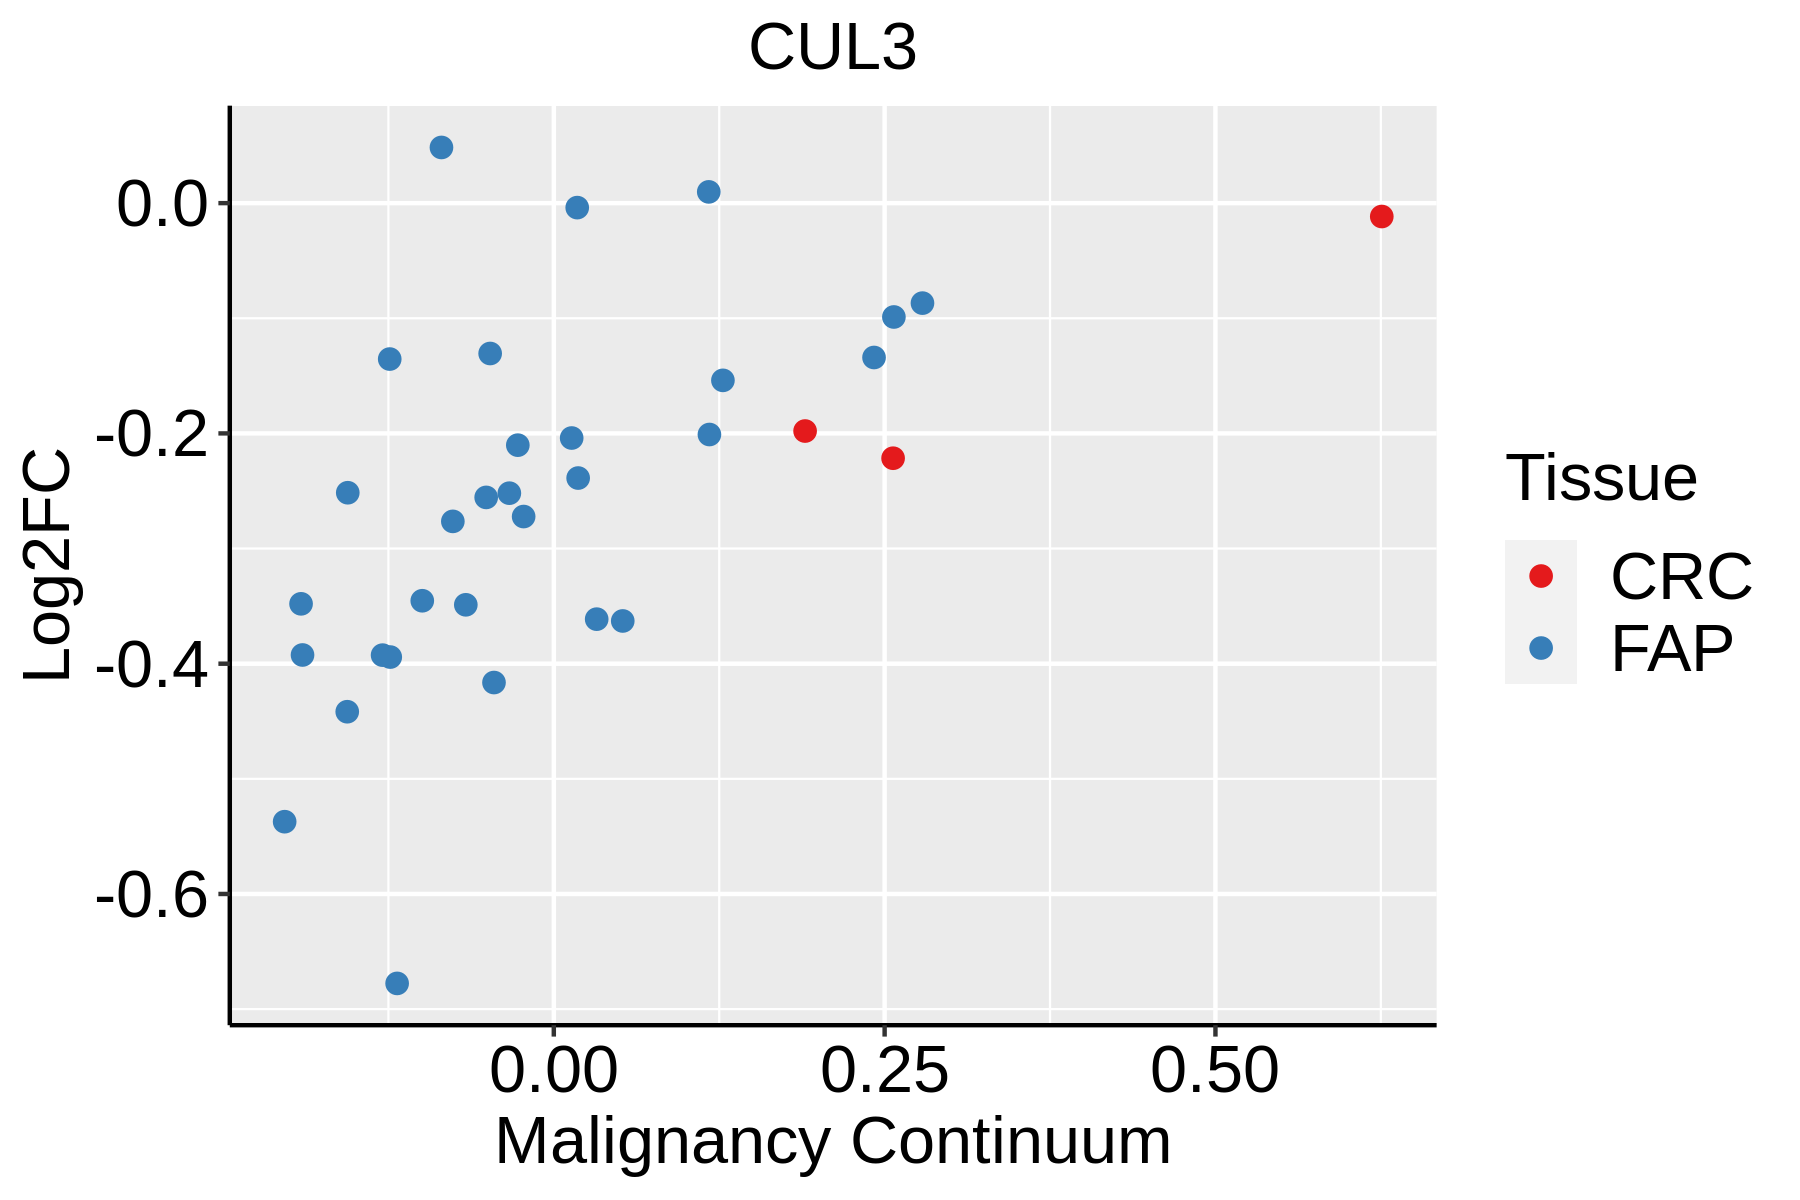 | FAP: Familial adenomatous polyposis |
| CRC: Colorectal cancer |
| Colorectum (HTA11) |  | AD: Adenomas |
| SER: Sessile serrated lesions |
| MSI-H: Microsatellite-high colorectal cancer |
| MSS: Microsatellite stable colorectal cancer |
| Endometrium | 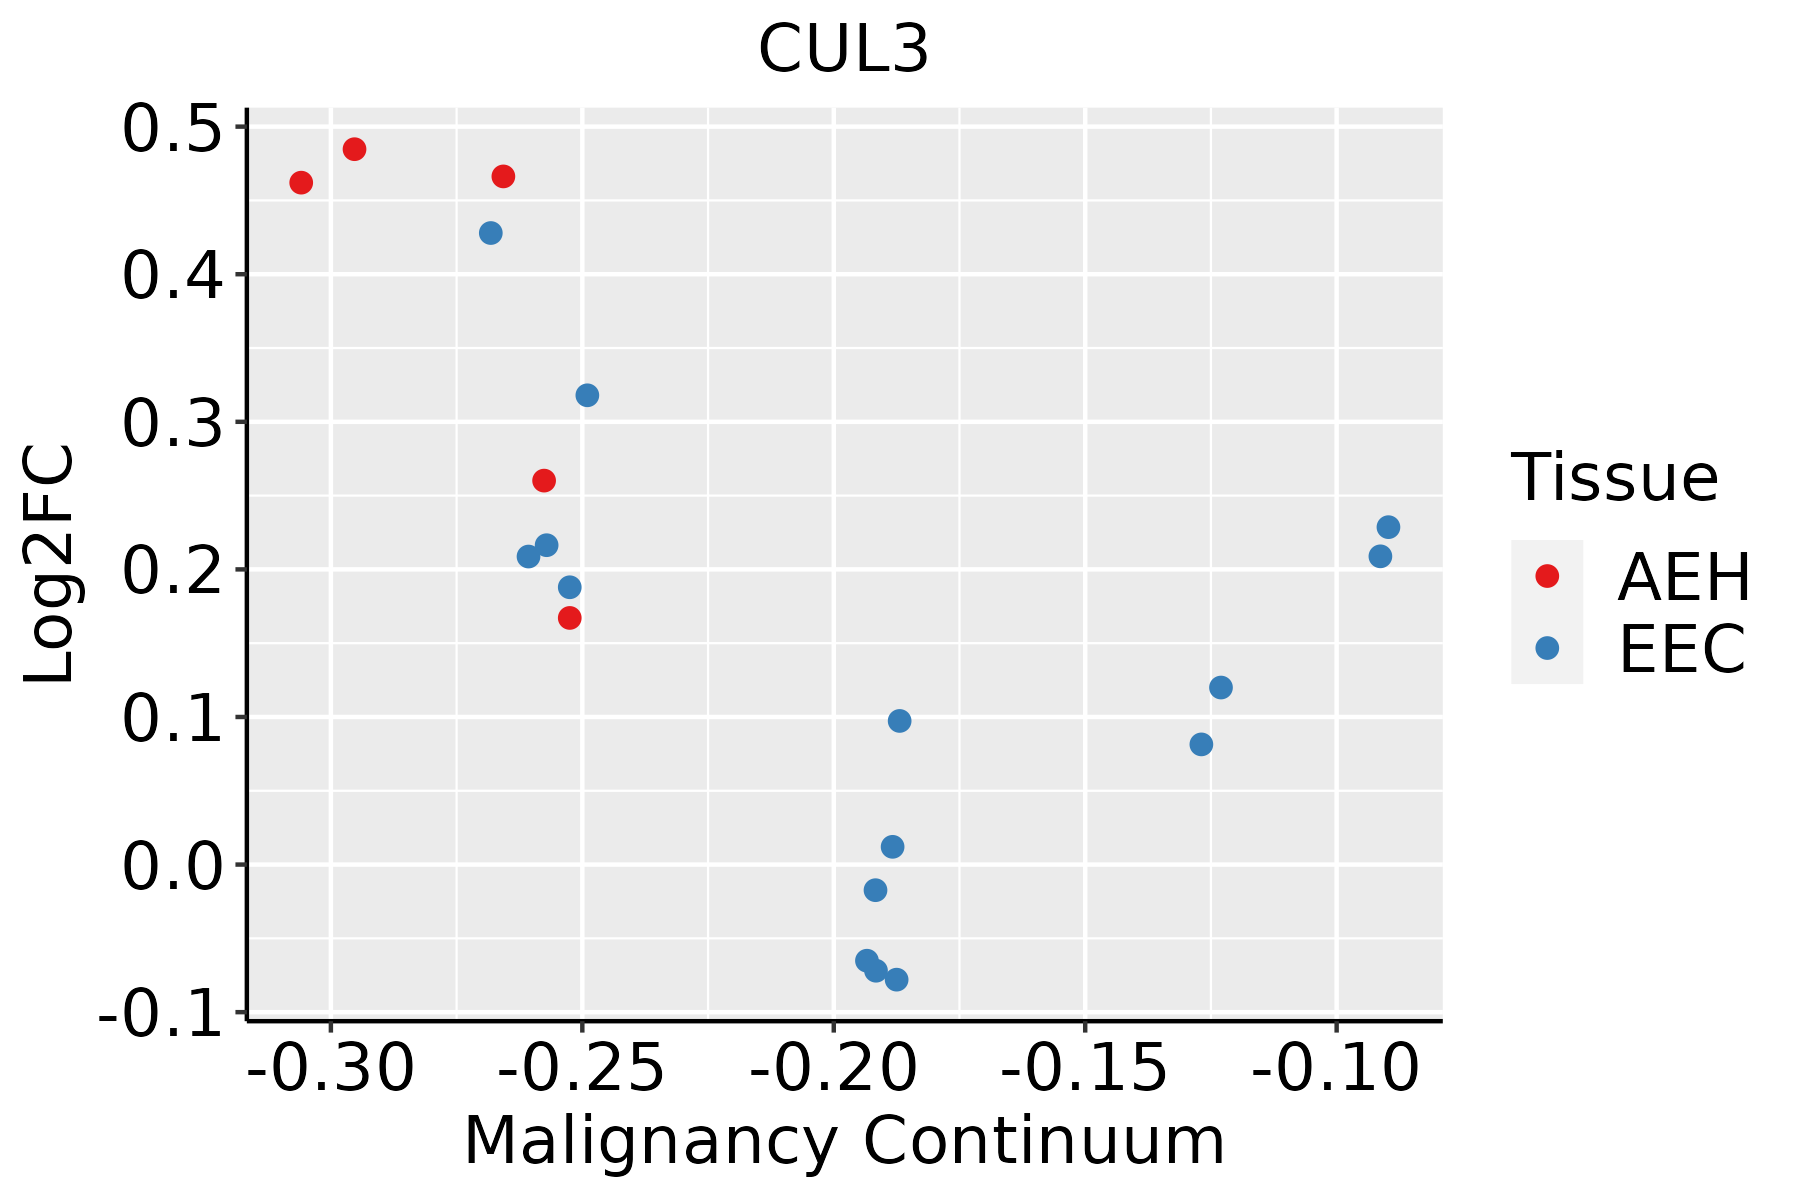 | AEH: Atypical endometrial hyperplasia |
| EEC: Endometrioid Cancer |
| Esophagus |  | ESCC: Esophageal squamous cell carcinoma |
| HGIN: High-grade intraepithelial neoplasias |
| LGIN: Low-grade intraepithelial neoplasias |
| Liver | 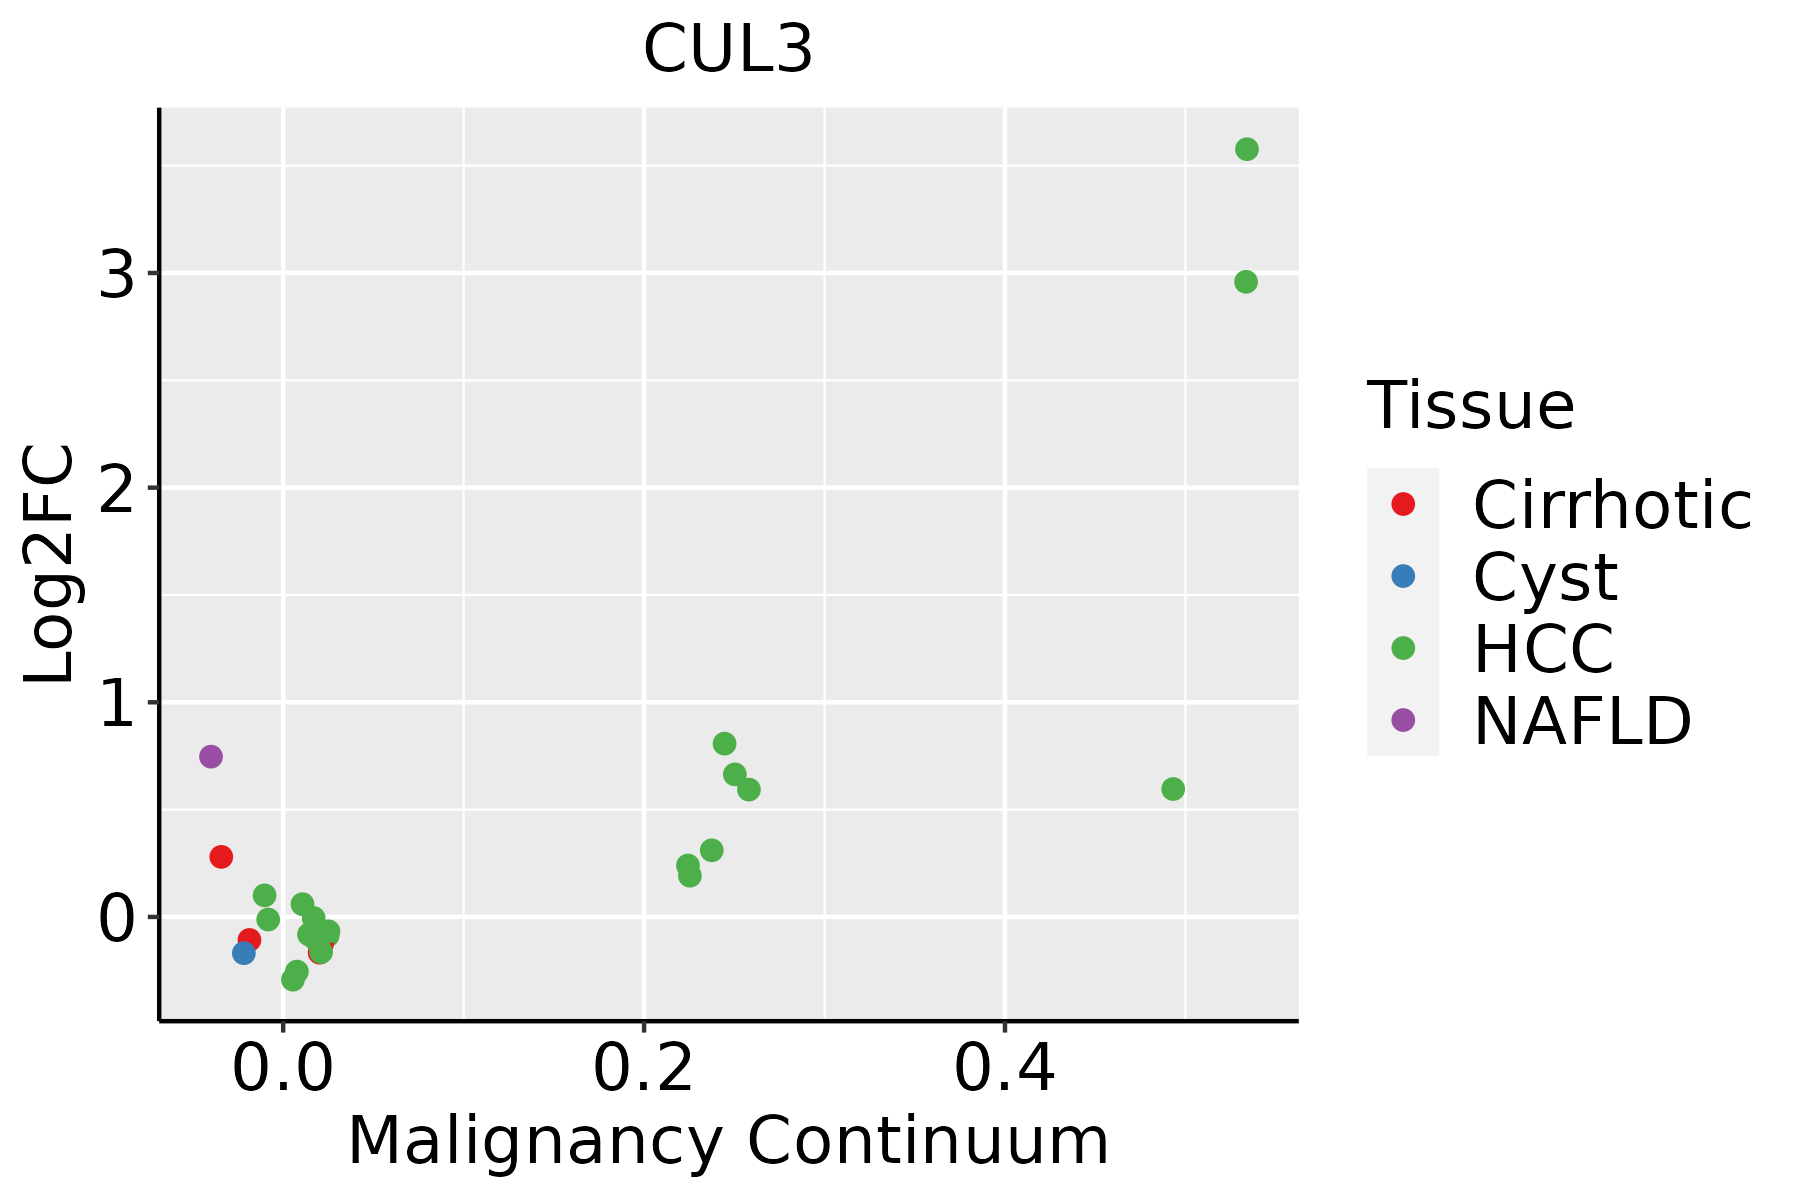 | HCC: Hepatocellular carcinoma |
| NAFLD: Non-alcoholic fatty liver disease |
| Lung | 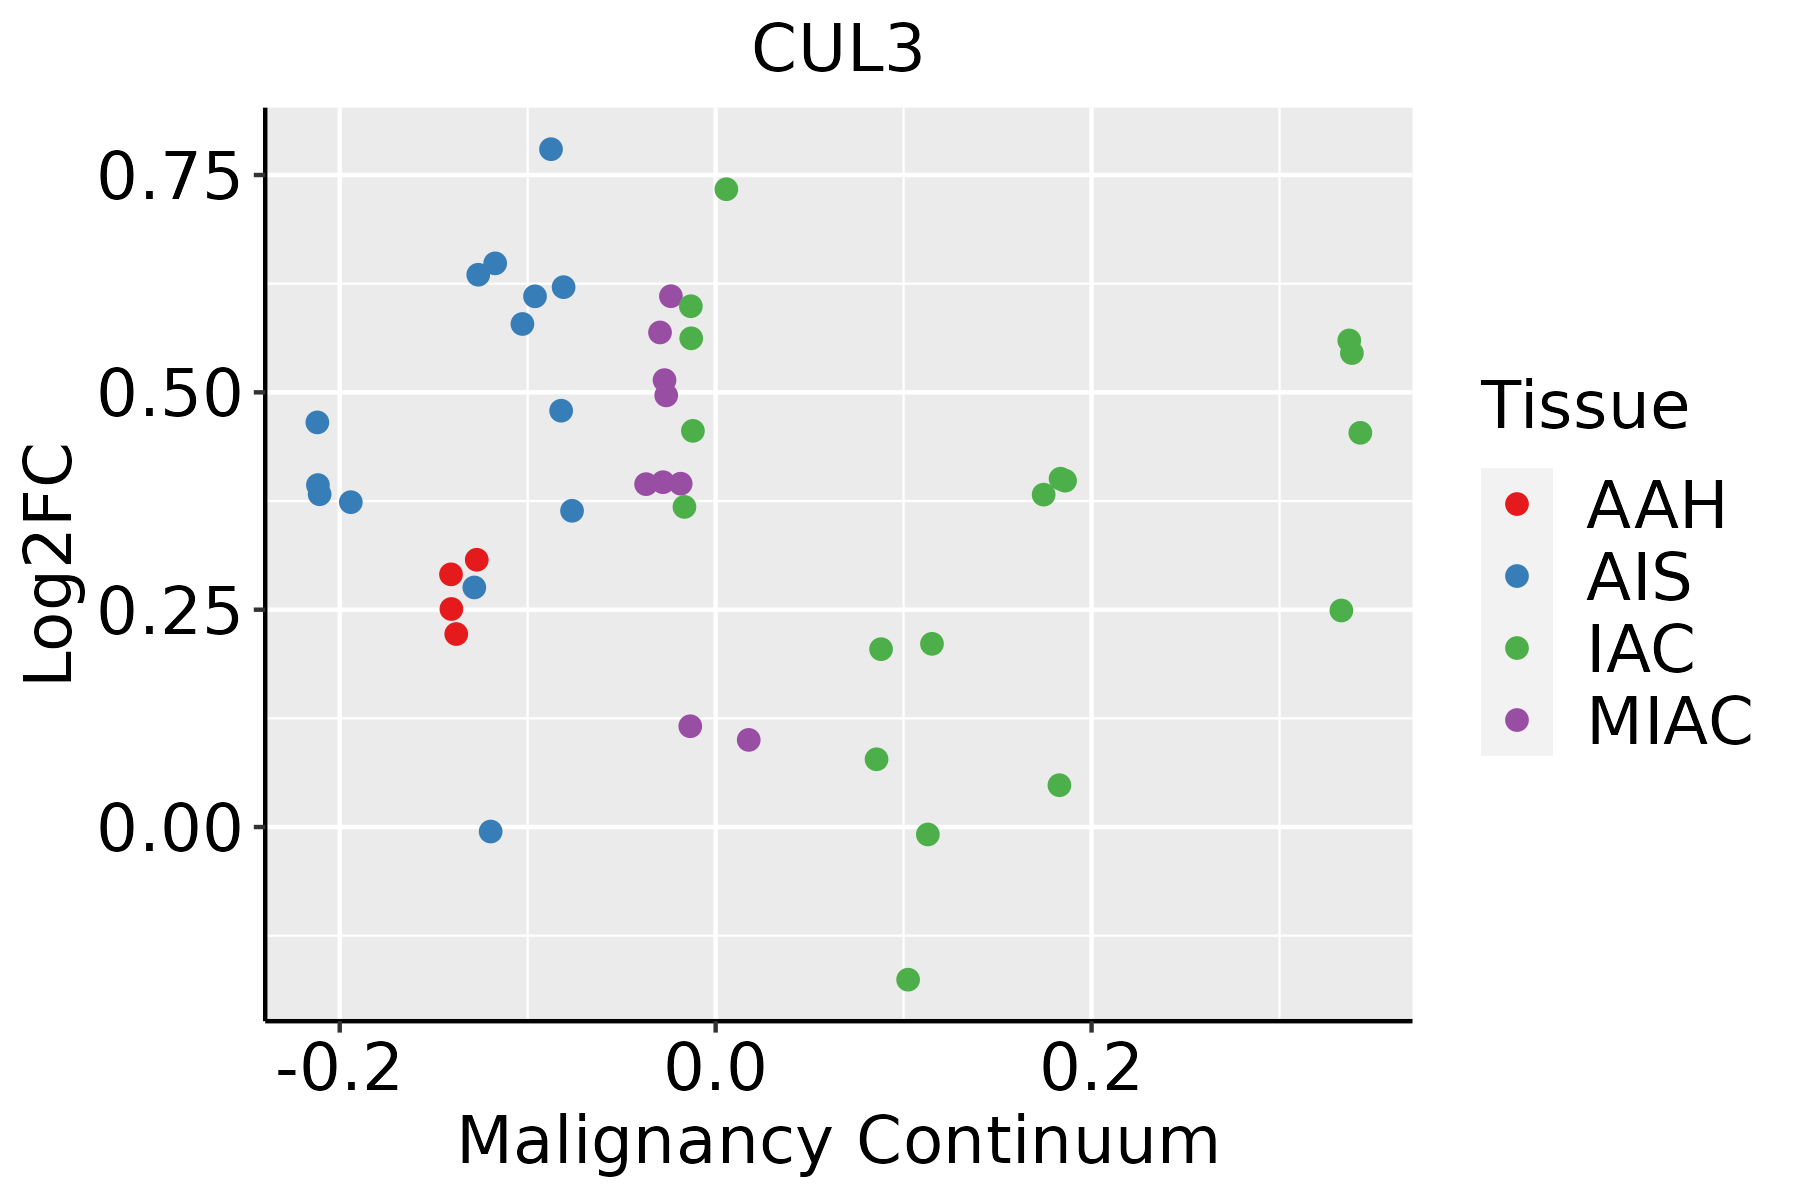 | AAH: Atypical adenomatous hyperplasia |
| AIS: Adenocarcinoma in situ |
| IAC: Invasive lung adenocarcinoma |
| MIA: Minimally invasive adenocarcinoma |
| Oral Cavity | 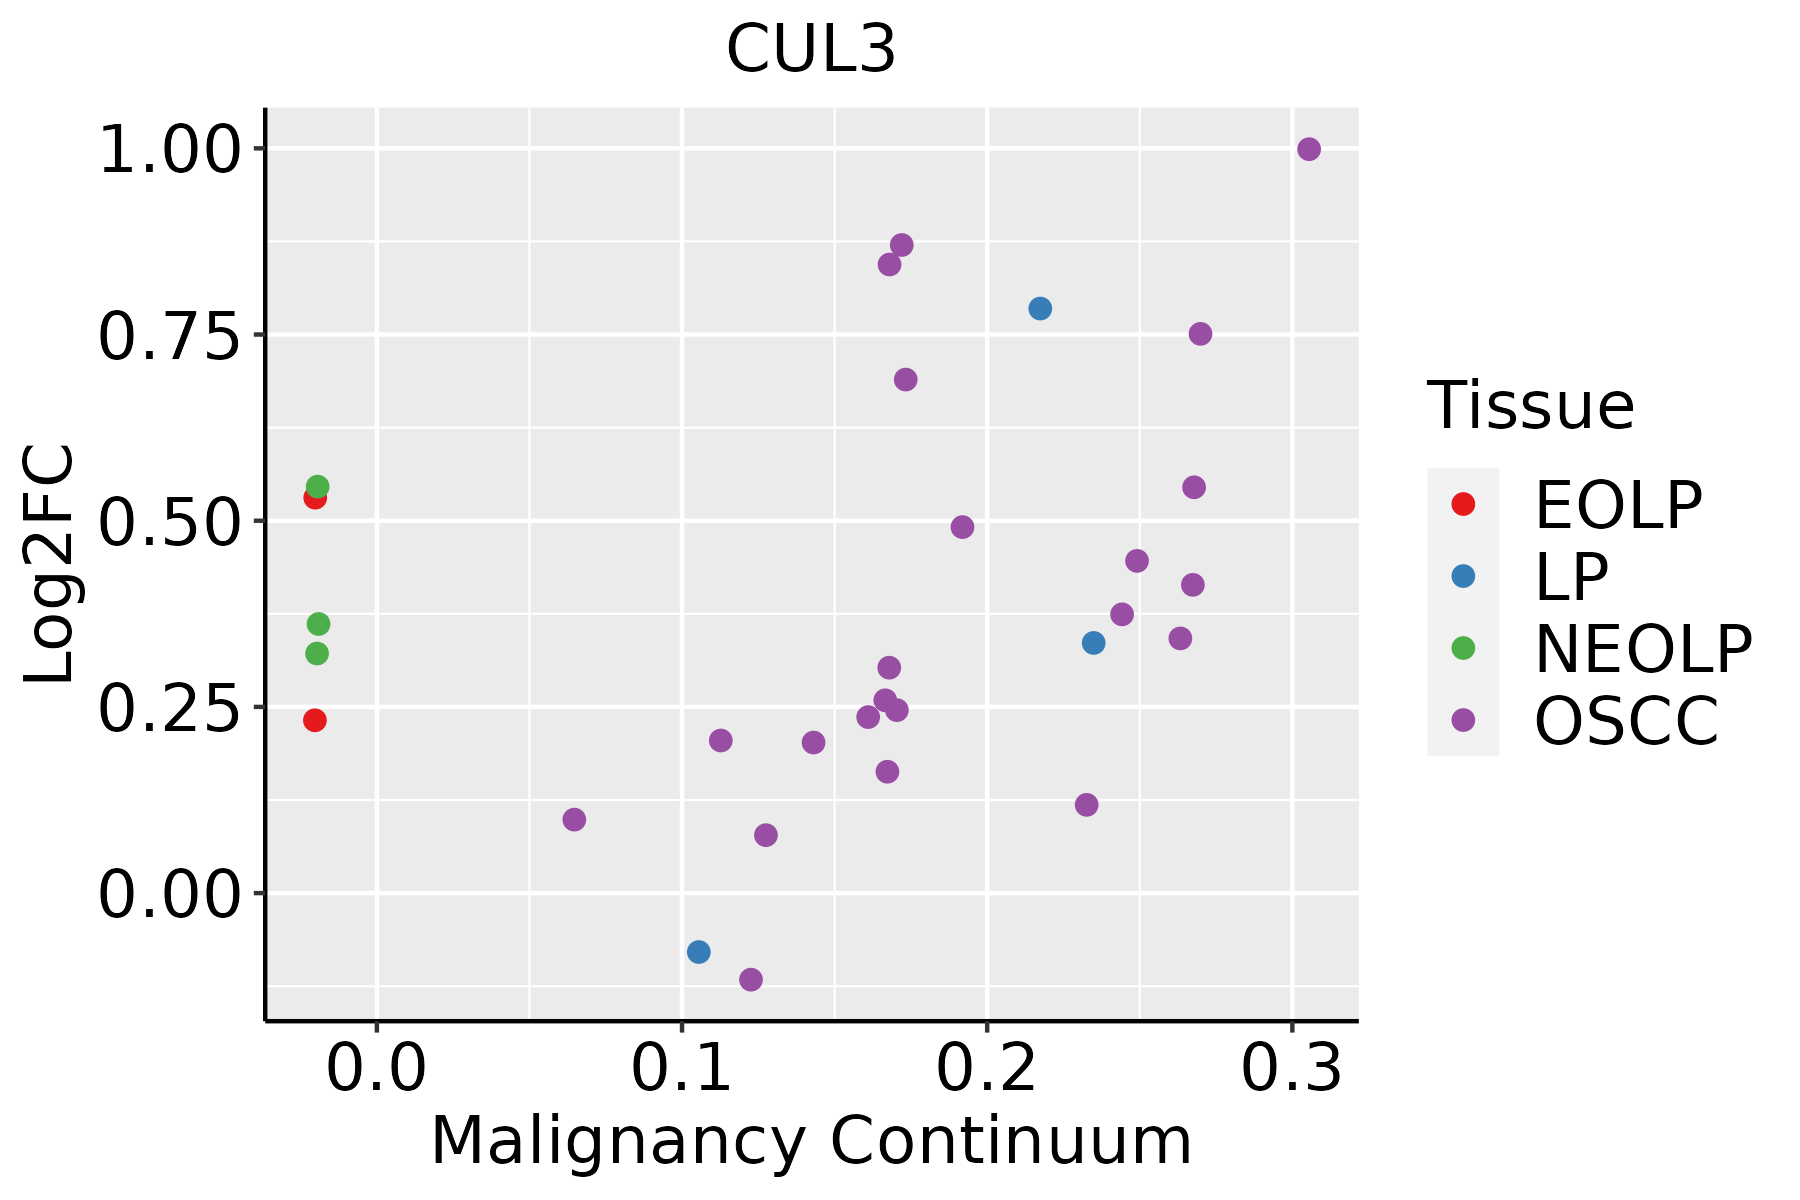 | EOLP: Erosive Oral lichen planus |
| LP: leukoplakia |
| NEOLP: Non-erosive oral lichen planus |
| OSCC: Oral squamous cell carcinoma |
| Prostate |  | BPH: Benign Prostatic Hyperplasia |
| Skin | 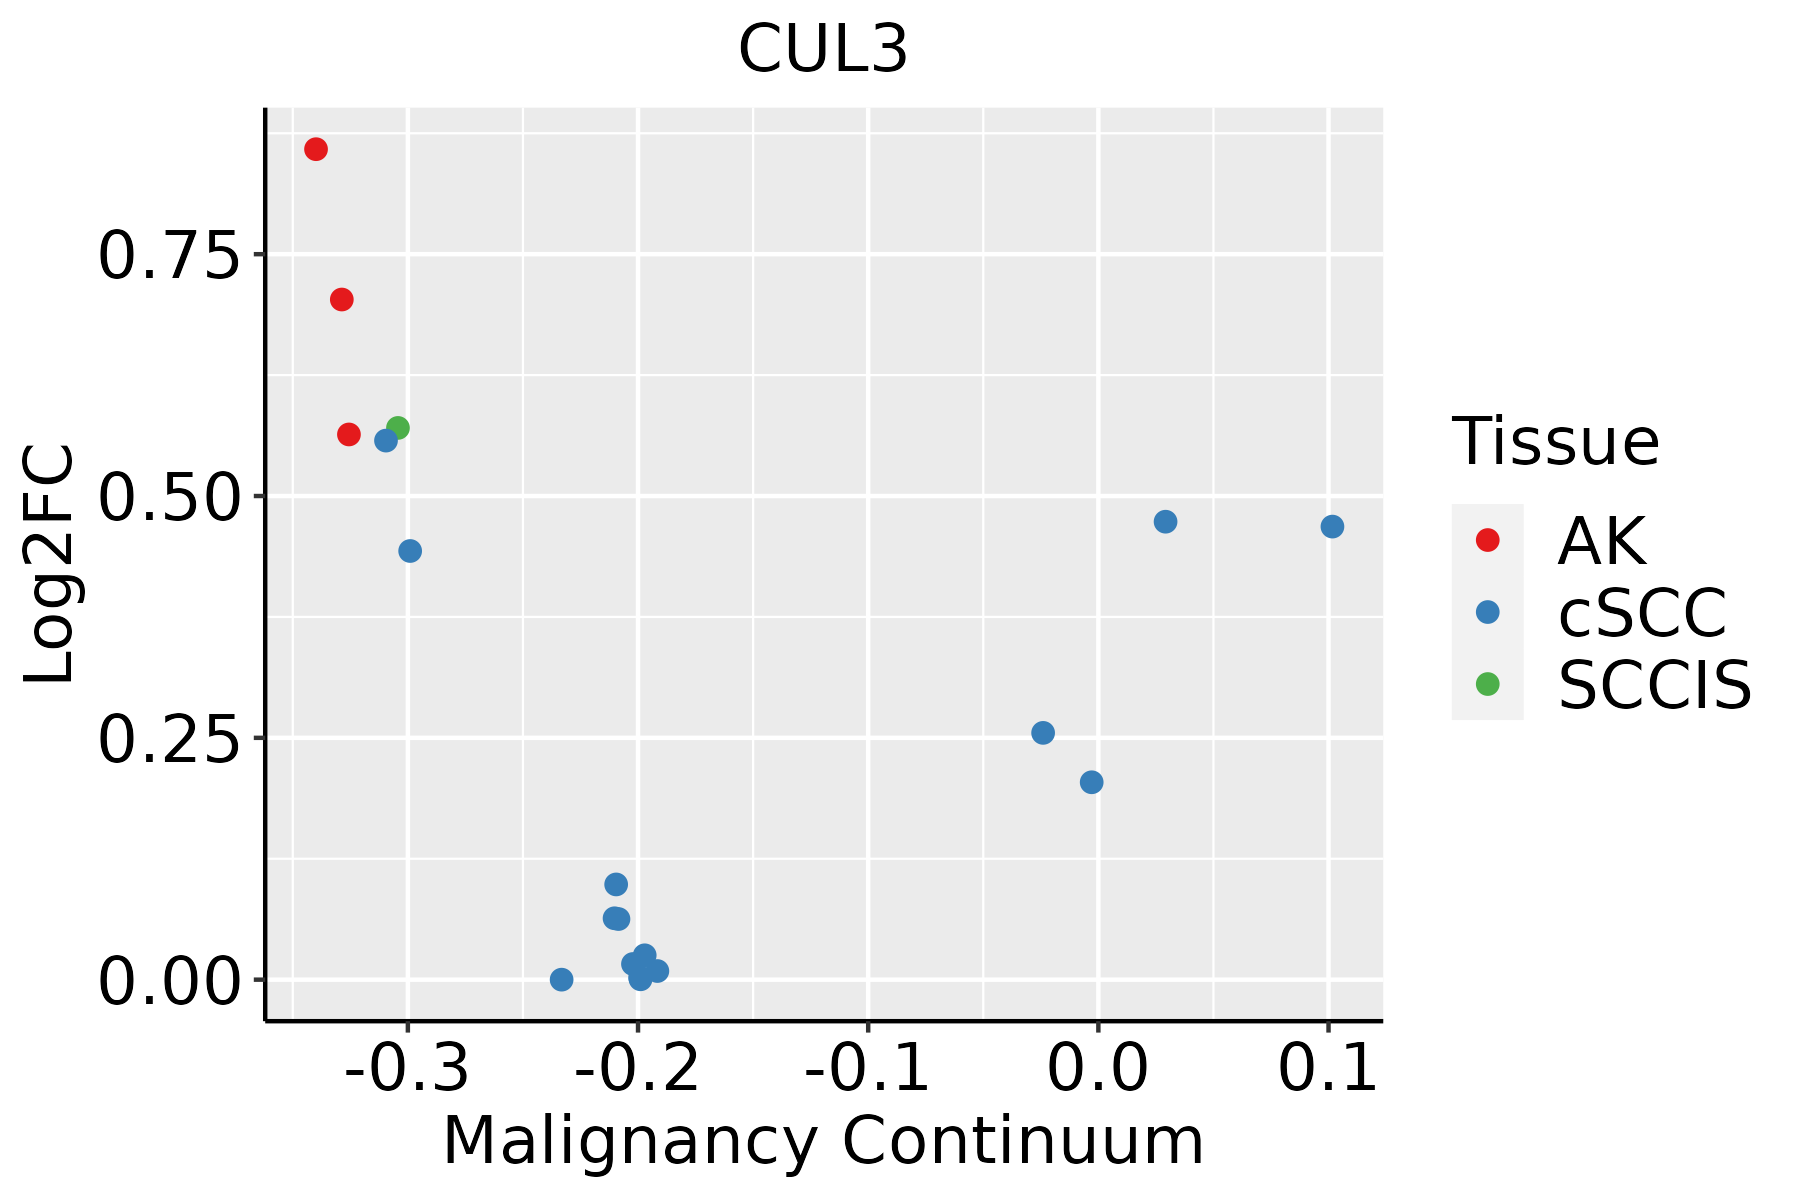 | AK: Actinic keratosis |
| cSCC: Cutaneous squamous cell carcinoma |
| SCCIS:squamous cell carcinoma in situ |
| Thyroid |  | ATC: Anaplastic thyroid cancer |
| HT: Hashimoto's thyroiditis |
| PTC: Papillary thyroid cancer |
| GO ID | Tissue | Disease Stage | Description | Gene Ratio | Bg Ratio | pvalue | p.adjust | Count |
| GO:000722931 | Oral cavity | NEOLP | integrin-mediated signaling pathway | 29/2005 | 107/18723 | 1.72e-06 | 4.19e-05 | 29 |
| GO:000726622 | Oral cavity | NEOLP | Rho protein signal transduction | 34/2005 | 137/18723 | 2.08e-06 | 4.87e-05 | 34 |
| GO:005101733 | Oral cavity | NEOLP | actin filament bundle assembly | 36/2005 | 157/18723 | 7.50e-06 | 1.48e-04 | 36 |
| GO:004593131 | Oral cavity | NEOLP | positive regulation of mitotic cell cycle | 30/2005 | 121/18723 | 8.28e-06 | 1.60e-04 | 30 |
| GO:000690031 | Oral cavity | NEOLP | vesicle budding from membrane | 19/2005 | 61/18723 | 1.19e-05 | 2.17e-04 | 19 |
| GO:004873232 | Oral cavity | NEOLP | gland development | 76/2005 | 436/18723 | 1.25e-05 | 2.25e-04 | 76 |
| GO:006157226 | Oral cavity | NEOLP | actin filament bundle organization | 36/2005 | 161/18723 | 1.36e-05 | 2.41e-04 | 36 |
| GO:005165631 | Oral cavity | NEOLP | establishment of organelle localization | 69/2005 | 390/18723 | 1.89e-05 | 3.16e-04 | 69 |
| GO:003003825 | Oral cavity | NEOLP | contractile actin filament bundle assembly | 26/2005 | 106/18723 | 3.95e-05 | 5.62e-04 | 26 |
| GO:004314925 | Oral cavity | NEOLP | stress fiber assembly | 26/2005 | 106/18723 | 3.95e-05 | 5.62e-04 | 26 |
| GO:190332231 | Oral cavity | NEOLP | positive regulation of protein modification by small protein conjugation or removal | 31/2005 | 138/18723 | 4.77e-05 | 6.58e-04 | 31 |
| GO:000736921 | Oral cavity | NEOLP | gastrulation | 38/2005 | 185/18723 | 5.90e-05 | 7.93e-04 | 38 |
| GO:003304431 | Oral cavity | NEOLP | regulation of chromosome organization | 38/2005 | 187/18723 | 7.52e-05 | 9.71e-04 | 38 |
| GO:004578731 | Oral cavity | NEOLP | positive regulation of cell cycle | 55/2005 | 313/18723 | 1.53e-04 | 1.74e-03 | 55 |
| GO:000651331 | Oral cavity | NEOLP | protein monoubiquitination | 18/2005 | 67/18723 | 1.73e-04 | 1.91e-03 | 18 |
| GO:005165031 | Oral cavity | NEOLP | establishment of vesicle localization | 33/2005 | 161/18723 | 1.83e-04 | 1.99e-03 | 33 |
| GO:003596732 | Oral cavity | NEOLP | cellular response to topologically incorrect protein | 26/2005 | 116/18723 | 1.95e-04 | 2.12e-03 | 26 |
| GO:00350238 | Oral cavity | NEOLP | regulation of Rho protein signal transduction | 21/2005 | 86/18723 | 2.26e-04 | 2.37e-03 | 21 |
| GO:003139831 | Oral cavity | NEOLP | positive regulation of protein ubiquitination | 26/2005 | 119/18723 | 3.00e-04 | 2.97e-03 | 26 |
| GO:001605031 | Oral cavity | NEOLP | vesicle organization | 52/2005 | 300/18723 | 3.20e-04 | 3.11e-03 | 52 |
| Pathway ID | Tissue | Disease Stage | Description | Gene Ratio | Bg Ratio | pvalue | p.adjust | qvalue | Count |
| hsa0412014 | Cervix | CC | Ubiquitin mediated proteolysis | 49/1267 | 142/8465 | 4.26e-09 | 7.68e-08 | 4.54e-08 | 49 |
| hsa0412015 | Cervix | CC | Ubiquitin mediated proteolysis | 49/1267 | 142/8465 | 4.26e-09 | 7.68e-08 | 4.54e-08 | 49 |
| hsa04120 | Colorectum | AD | Ubiquitin mediated proteolysis | 58/2092 | 142/8465 | 1.46e-05 | 1.53e-04 | 9.76e-05 | 58 |
| hsa041201 | Colorectum | AD | Ubiquitin mediated proteolysis | 58/2092 | 142/8465 | 1.46e-05 | 1.53e-04 | 9.76e-05 | 58 |
| hsa041202 | Colorectum | SER | Ubiquitin mediated proteolysis | 39/1580 | 142/8465 | 6.18e-03 | 3.66e-02 | 2.66e-02 | 39 |
| hsa041203 | Colorectum | SER | Ubiquitin mediated proteolysis | 39/1580 | 142/8465 | 6.18e-03 | 3.66e-02 | 2.66e-02 | 39 |
| hsa041204 | Colorectum | MSS | Ubiquitin mediated proteolysis | 55/1875 | 142/8465 | 5.02e-06 | 6.00e-05 | 3.68e-05 | 55 |
| hsa041205 | Colorectum | MSS | Ubiquitin mediated proteolysis | 55/1875 | 142/8465 | 5.02e-06 | 6.00e-05 | 3.68e-05 | 55 |
| hsa041206 | Colorectum | FAP | Ubiquitin mediated proteolysis | 51/1404 | 142/8465 | 1.55e-08 | 5.84e-07 | 3.55e-07 | 51 |
| hsa041207 | Colorectum | FAP | Ubiquitin mediated proteolysis | 51/1404 | 142/8465 | 1.55e-08 | 5.84e-07 | 3.55e-07 | 51 |
| hsa041208 | Colorectum | CRC | Ubiquitin mediated proteolysis | 42/1091 | 142/8465 | 9.98e-08 | 6.67e-06 | 4.52e-06 | 42 |
| hsa041209 | Colorectum | CRC | Ubiquitin mediated proteolysis | 42/1091 | 142/8465 | 9.98e-08 | 6.67e-06 | 4.52e-06 | 42 |
| hsa0412016 | Endometrium | AEH | Ubiquitin mediated proteolysis | 41/1197 | 142/8465 | 3.42e-06 | 4.27e-05 | 3.13e-05 | 41 |
| hsa0412017 | Endometrium | AEH | Ubiquitin mediated proteolysis | 41/1197 | 142/8465 | 3.42e-06 | 4.27e-05 | 3.13e-05 | 41 |
| hsa0412023 | Endometrium | EEC | Ubiquitin mediated proteolysis | 41/1237 | 142/8465 | 7.86e-06 | 9.58e-05 | 7.14e-05 | 41 |
| hsa0412033 | Endometrium | EEC | Ubiquitin mediated proteolysis | 41/1237 | 142/8465 | 7.86e-06 | 9.58e-05 | 7.14e-05 | 41 |
| hsa0412027 | Esophagus | ESCC | Ubiquitin mediated proteolysis | 122/4205 | 142/8465 | 6.53e-20 | 7.29e-18 | 3.74e-18 | 122 |
| hsa0412036 | Esophagus | ESCC | Ubiquitin mediated proteolysis | 122/4205 | 142/8465 | 6.53e-20 | 7.29e-18 | 3.74e-18 | 122 |
| hsa0412010 | Liver | NAFLD | Ubiquitin mediated proteolysis | 44/1043 | 142/8465 | 2.59e-09 | 1.70e-07 | 1.37e-07 | 44 |
| hsa0412011 | Liver | NAFLD | Ubiquitin mediated proteolysis | 44/1043 | 142/8465 | 2.59e-09 | 1.70e-07 | 1.37e-07 | 44 |
| Hugo Symbol | Variant Class | Variant Classification | dbSNP RS | HGVSc | HGVSp | HGVSp Short | SWISSPROT | BIOTYPE | SIFT | PolyPhen | Tumor Sample Barcode | Tissue | Histology | Sex | Age | Stage | Therapy Types | Drugs | Outcome |
| CUL3 | SNV | Missense_Mutation | | c.274G>A | p.Asp92Asn | p.D92N | Q13618 | protein_coding | tolerated(0.13) | possibly_damaging(0.816) | TCGA-5L-AAT1-01 | Breast | breast invasive carcinoma | Female | <65 | III/IV | Hormone Therapy | letrozol | SD |
| CUL3 | SNV | Missense_Mutation | | c.2059N>A | p.Glu687Lys | p.E687K | Q13618 | protein_coding | deleterious(0) | possibly_damaging(0.785) | TCGA-A2-A0YK-01 | Breast | breast invasive carcinoma | Female | <65 | I/II | Chemotherapy | cytoxan | SD |
| CUL3 | SNV | Missense_Mutation | | c.464N>A | p.Gly155Glu | p.G155E | Q13618 | protein_coding | tolerated(1) | benign(0.438) | TCGA-A8-A09Z-01 | Breast | breast invasive carcinoma | Female | >=65 | I/II | Unknown | Unknown | SD |
| CUL3 | SNV | Missense_Mutation | novel | c.1855N>C | p.Glu619Gln | p.E619Q | Q13618 | protein_coding | tolerated(0.18) | possibly_damaging(0.541) | TCGA-BH-A0B6-01 | Breast | breast invasive carcinoma | Female | <65 | I/II | Unknown | Unknown | SD |
| CUL3 | SNV | Missense_Mutation | | c.1285N>A | p.Glu429Lys | p.E429K | Q13618 | protein_coding | deleterious(0) | probably_damaging(1) | TCGA-BH-A0EE-01 | Breast | breast invasive carcinoma | Female | >=65 | I/II | Chemotherapy | docetaxel | SD |
| CUL3 | insertion | Frame_Shift_Ins | novel | c.700_701insCACCTTTTATCTTCTGGATTAAATGTAAAATGAGACT | p.Ile234ThrfsTer19 | p.I234Tfs*19 | Q13618 | protein_coding | | | TCGA-AR-A0TU-01 | Breast | breast invasive carcinoma | Female | <65 | I/II | Unspecific | Doxorubicin | SD |
| CUL3 | insertion | Frame_Shift_Ins | novel | c.1358dupA | p.Asn453LysfsTer5 | p.N453Kfs*5 | Q13618 | protein_coding | | | TCGA-AR-A0U0-01 | Breast | breast invasive carcinoma | Female | >=65 | I/II | Unknown | Unknown | SD |
| CUL3 | SNV | Missense_Mutation | | c.124N>G | p.Gln42Glu | p.Q42E | Q13618 | protein_coding | tolerated(0.13) | possibly_damaging(0.803) | TCGA-C5-A7X5-01 | Cervix | cervical & endocervical cancer | Female | >=65 | I/II | Chemotherapy | carboplatin | PD |
| CUL3 | SNV | Missense_Mutation | novel | c.1880T>G | p.Leu627Arg | p.L627R | Q13618 | protein_coding | deleterious(0) | probably_damaging(0.997) | TCGA-ZJ-AAXT-01 | Cervix | cervical & endocervical cancer | Female | <65 | III/IV | Unknown | Unknown | SD |
| CUL3 | insertion | Frame_Shift_Ins | novel | c.892_893insACACA | p.Cys298TyrfsTer15 | p.C298Yfs*15 | Q13618 | protein_coding | | | TCGA-DS-A1OB-01 | Cervix | cervical & endocervical cancer | Female | <65 | I/II | Chemotherapy | carboplatin | PD |


