
|
|||||
|
 | |
| |
| |
| |
| |
| |
|
Gene: BAIAP2 |
Gene summary for BAIAP2 |
| Gene information | Species | Human | Gene symbol | BAIAP2 | Gene ID | 10458 |
| Gene name | BAR/IMD domain containing adaptor protein 2 | |
| Gene Alias | BAP2 | |
| Cytomap | 17q25.3 | |
| Gene Type | protein-coding | GO ID | GO:0000902 | UniProtAcc | Q9UQB8 |
Top |
Malignant transformation analysis |
| Identification of the aberrant gene expression in precancerous and cancerous lesions by comparing the gene expression of stem-like cells in diseased tissues with normal stem cells |
| Entrez ID | Symbol | Replicates | Species | Organ | Tissue | Adj P-value | Log2FC | Malignancy |
| 10458 | BAIAP2 | LZE4T | Human | Esophagus | ESCC | 2.19e-03 | 9.01e-02 | 0.0811 |
| 10458 | BAIAP2 | LZE5T | Human | Esophagus | ESCC | 2.29e-06 | 2.65e-01 | 0.0514 |
| 10458 | BAIAP2 | LZE7T | Human | Esophagus | ESCC | 1.80e-02 | 4.83e-01 | 0.0667 |
| 10458 | BAIAP2 | LZE8T | Human | Esophagus | ESCC | 5.61e-08 | 5.85e-01 | 0.067 |
| 10458 | BAIAP2 | LZE22T | Human | Esophagus | ESCC | 1.98e-06 | 9.14e-01 | 0.068 |
| 10458 | BAIAP2 | LZE24T | Human | Esophagus | ESCC | 1.83e-08 | 6.31e-01 | 0.0596 |
| 10458 | BAIAP2 | LZE21T | Human | Esophagus | ESCC | 9.38e-08 | 1.22e+00 | 0.0655 |
| 10458 | BAIAP2 | P1T-E | Human | Esophagus | ESCC | 1.78e-06 | 8.14e-01 | 0.0875 |
| 10458 | BAIAP2 | P2T-E | Human | Esophagus | ESCC | 1.86e-14 | 1.30e-01 | 0.1177 |
| 10458 | BAIAP2 | P4T-E | Human | Esophagus | ESCC | 1.19e-08 | 2.83e-01 | 0.1323 |
| 10458 | BAIAP2 | P5T-E | Human | Esophagus | ESCC | 2.48e-19 | 5.97e-01 | 0.1327 |
| 10458 | BAIAP2 | P8T-E | Human | Esophagus | ESCC | 3.13e-20 | 1.88e-01 | 0.0889 |
| 10458 | BAIAP2 | P9T-E | Human | Esophagus | ESCC | 3.91e-15 | 5.99e-01 | 0.1131 |
| 10458 | BAIAP2 | P10T-E | Human | Esophagus | ESCC | 2.61e-35 | 7.09e-01 | 0.116 |
| 10458 | BAIAP2 | P11T-E | Human | Esophagus | ESCC | 5.07e-26 | 1.99e+00 | 0.1426 |
| 10458 | BAIAP2 | P12T-E | Human | Esophagus | ESCC | 3.83e-46 | 1.38e+00 | 0.1122 |
| 10458 | BAIAP2 | P15T-E | Human | Esophagus | ESCC | 8.32e-28 | 7.52e-01 | 0.1149 |
| 10458 | BAIAP2 | P16T-E | Human | Esophagus | ESCC | 2.69e-24 | -1.14e-02 | 0.1153 |
| 10458 | BAIAP2 | P17T-E | Human | Esophagus | ESCC | 1.44e-05 | 5.54e-01 | 0.1278 |
| 10458 | BAIAP2 | P20T-E | Human | Esophagus | ESCC | 1.46e-68 | 2.54e+00 | 0.1124 |
| Page: 1 2 3 4 5 6 |
| Tissue | Expression Dynamics | Abbreviation |
| Esophagus |  | ESCC: Esophageal squamous cell carcinoma |
| HGIN: High-grade intraepithelial neoplasias | ||
| LGIN: Low-grade intraepithelial neoplasias | ||
| Liver | 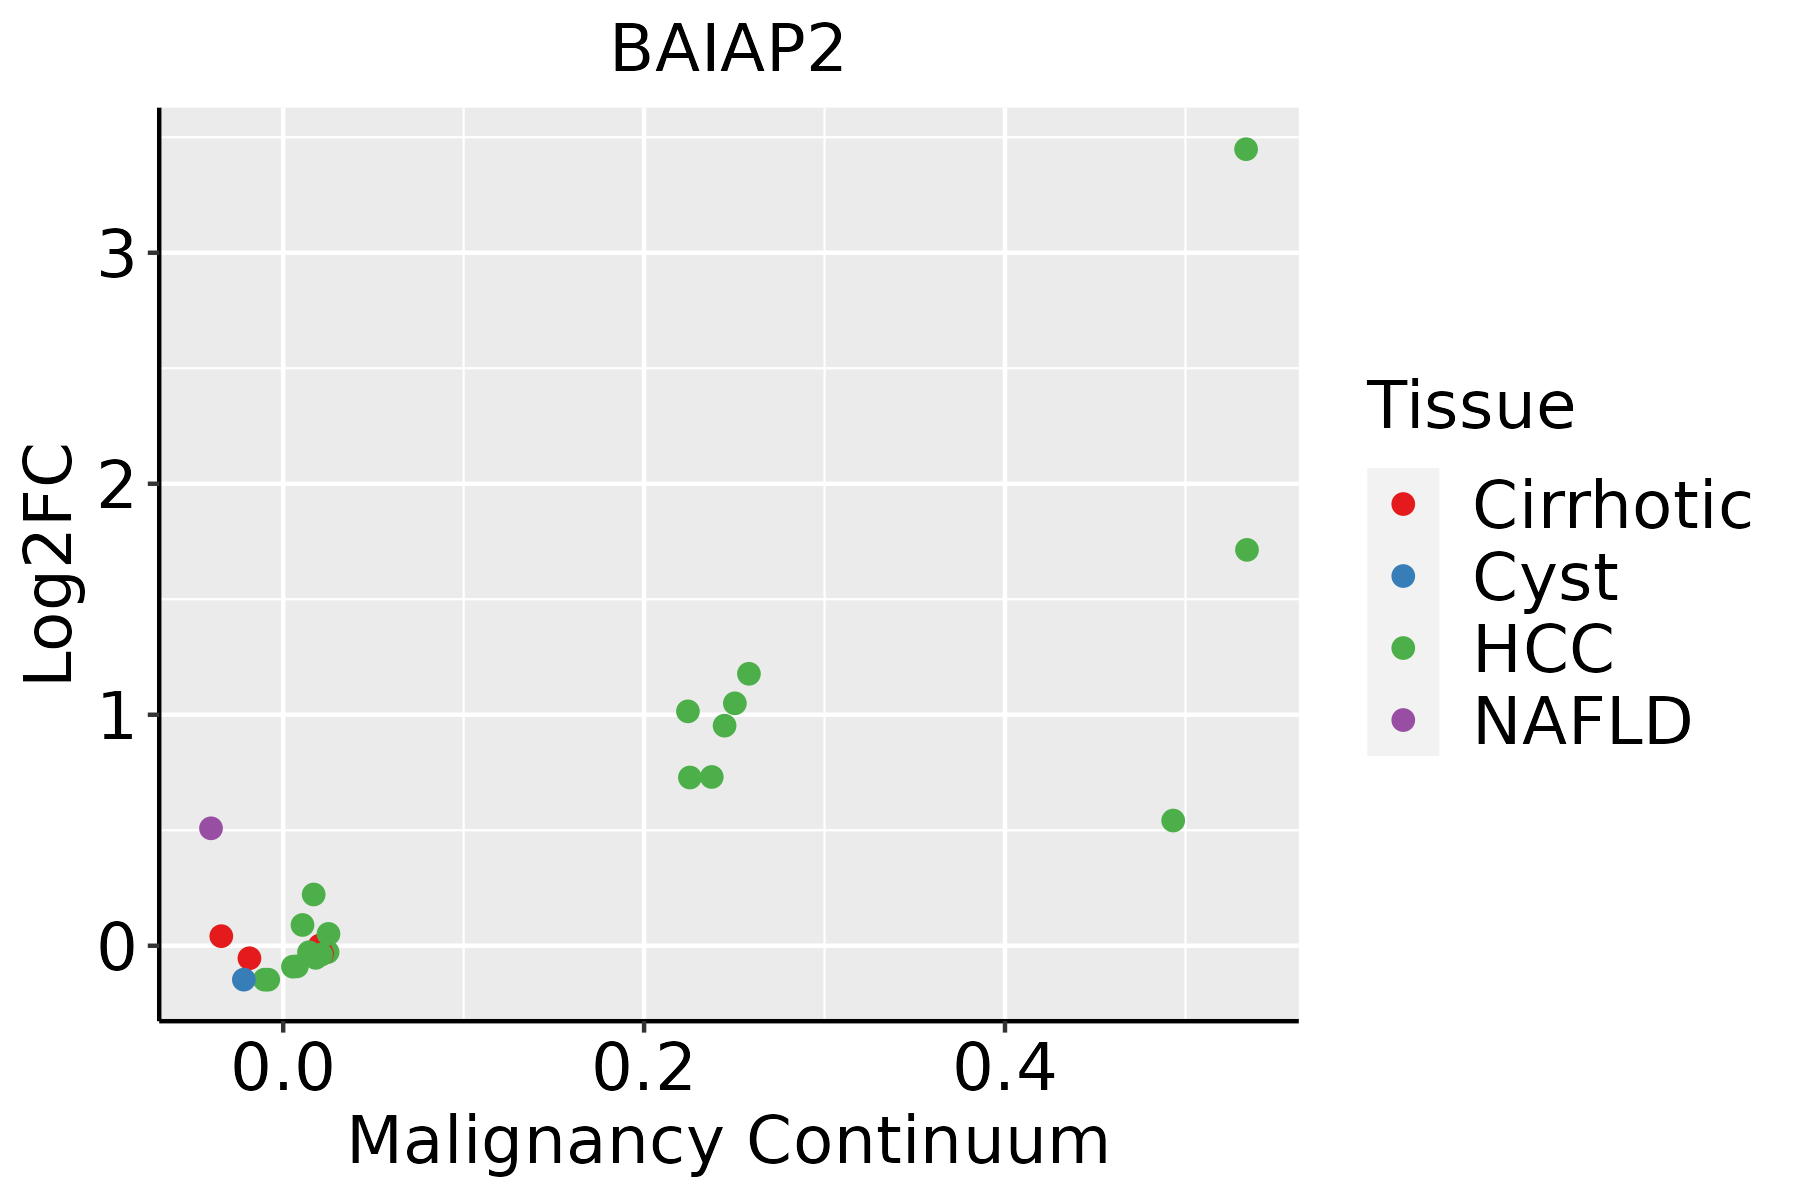 | HCC: Hepatocellular carcinoma |
| NAFLD: Non-alcoholic fatty liver disease | ||
| Oral Cavity |  | EOLP: Erosive Oral lichen planus |
| LP: leukoplakia | ||
| NEOLP: Non-erosive oral lichen planus | ||
| OSCC: Oral squamous cell carcinoma | ||
| Prostate | 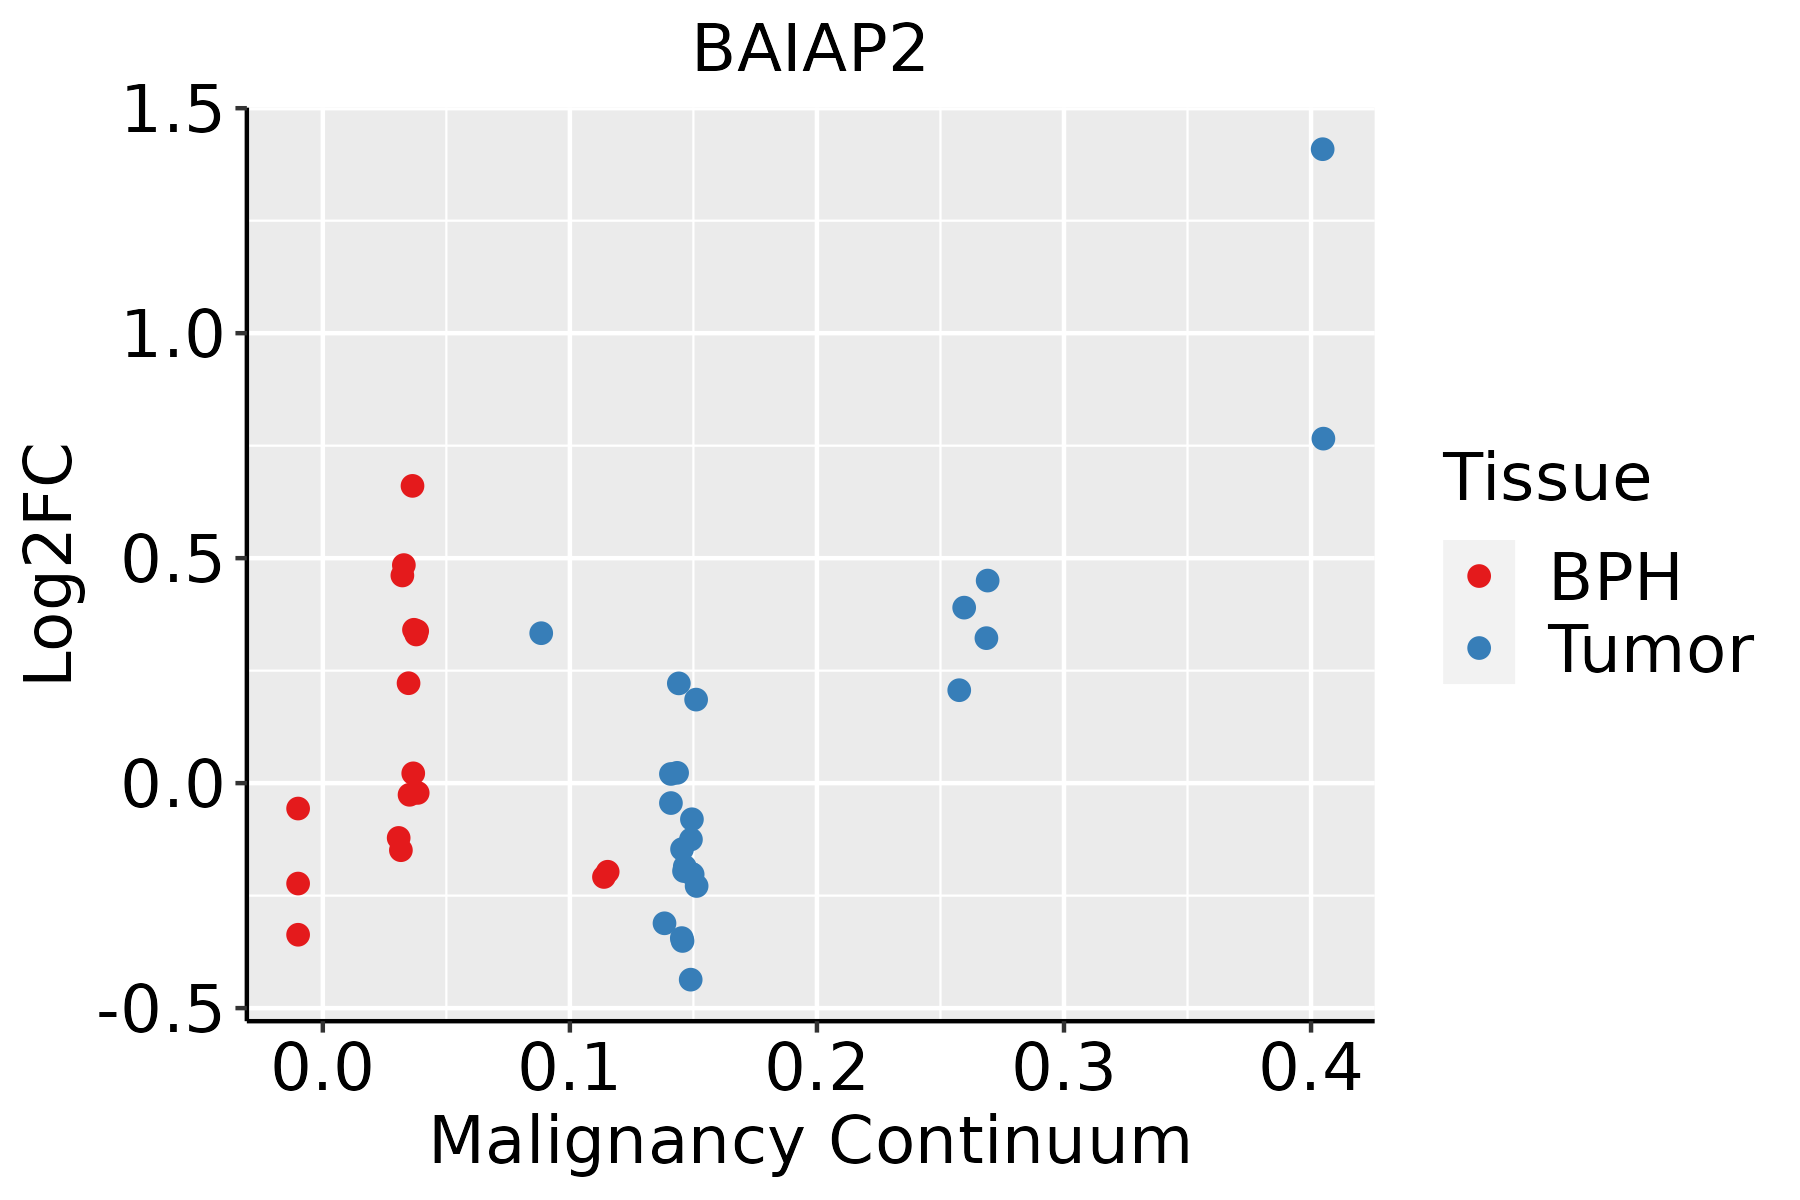 | BPH: Benign Prostatic Hyperplasia |
| Skin |  | AK: Actinic keratosis |
| cSCC: Cutaneous squamous cell carcinoma | ||
| SCCIS:squamous cell carcinoma in situ | ||
| Thyroid | 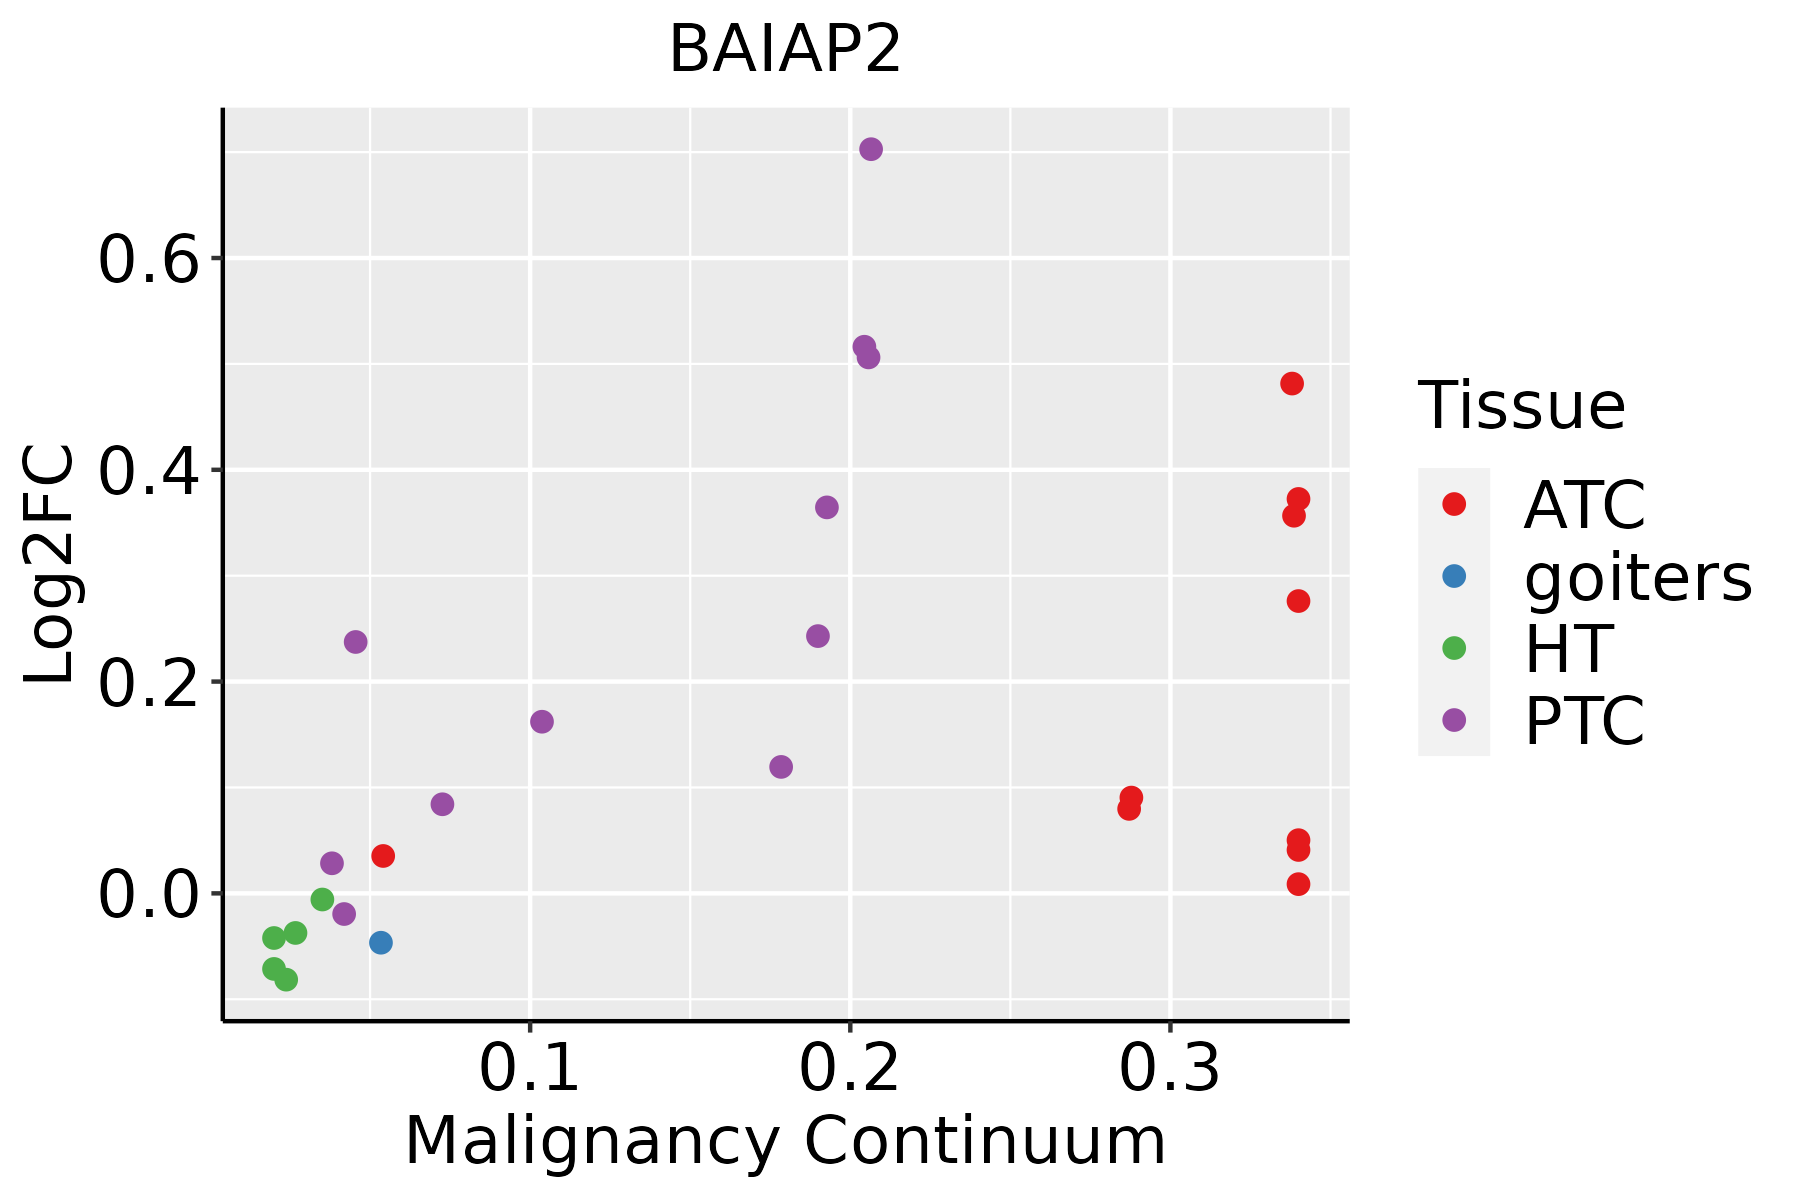 | ATC: Anaplastic thyroid cancer |
| HT: Hashimoto's thyroiditis | ||
| PTC: Papillary thyroid cancer |
| ∗log2FC in expression of this searched gene in stem-like cells from each diseased tissue sample relative to stem-like cells in normal samples in each tissue plotted against the malignancy continuum. Samples are colored based on if they are from different disease stage. |
Top |
Malignant transformation related pathway analysis |
| Find out the enriched GO biological processes and KEGG pathways involved in transition from healthy to precancer to cancer |
| Tissue | Disease Stage | Enriched GO biological Processes |
| Colorectum | AD |  |
| Colorectum | SER |  |
| Colorectum | MSS |  |
| Colorectum | MSI-H |  |
| Colorectum | FAP |  |
| ∗Top 15 enriched GO BP terms are showed in the bar plot of each disease state in each tissue. Each row represents a significant GO biological process which is colored according to the -log10(p.adjust). |
| Page: 1 2 3 4 5 6 7 8 9 |
| GO ID | Tissue | Disease Stage | Description | Gene Ratio | Bg Ratio | pvalue | p.adjust | Count |
| GO:000836026 | Thyroid | ATC | regulation of cell shape | 91/6293 | 154/18723 | 7.33e-11 | 2.31e-09 | 91 |
| GO:0008154111 | Thyroid | ATC | actin polymerization or depolymerization | 119/6293 | 218/18723 | 1.32e-10 | 4.08e-09 | 119 |
| GO:003133428 | Thyroid | ATC | positive regulation of protein-containing complex assembly | 127/6293 | 237/18723 | 1.64e-10 | 4.93e-09 | 127 |
| GO:001097523 | Thyroid | ATC | regulation of neuron projection development | 212/6293 | 445/18723 | 4.16e-10 | 1.14e-08 | 212 |
| GO:006156423 | Thyroid | ATC | axon development | 220/6293 | 467/18723 | 6.85e-10 | 1.80e-08 | 220 |
| GO:000740919 | Thyroid | ATC | axonogenesis | 197/6293 | 418/18723 | 5.09e-09 | 1.13e-07 | 197 |
| GO:190165325 | Thyroid | ATC | cellular response to peptide | 173/6293 | 359/18723 | 5.87e-09 | 1.28e-07 | 173 |
| GO:0008064111 | Thyroid | ATC | regulation of actin polymerization or depolymerization | 101/6293 | 188/18723 | 9.88e-09 | 2.05e-07 | 101 |
| GO:0030832111 | Thyroid | ATC | regulation of actin filament length | 101/6293 | 189/18723 | 1.43e-08 | 2.92e-07 | 101 |
| GO:001076927 | Thyroid | ATC | regulation of cell morphogenesis involved in differentiation | 59/6293 | 96/18723 | 2.08e-08 | 4.05e-07 | 59 |
| GO:001072022 | Thyroid | ATC | positive regulation of cell development | 146/6293 | 298/18723 | 2.36e-08 | 4.56e-07 | 146 |
| GO:0030041111 | Thyroid | ATC | actin filament polymerization | 101/6293 | 191/18723 | 2.91e-08 | 5.50e-07 | 101 |
| GO:004343428 | Thyroid | ATC | response to peptide hormone | 192/6293 | 414/18723 | 3.63e-08 | 6.70e-07 | 192 |
| GO:0032273113 | Thyroid | ATC | positive regulation of protein polymerization | 77/6293 | 138/18723 | 6.67e-08 | 1.17e-06 | 77 |
| GO:0051017210 | Thyroid | ATC | actin filament bundle assembly | 85/6293 | 157/18723 | 8.99e-08 | 1.54e-06 | 85 |
| GO:0030833110 | Thyroid | ATC | regulation of actin filament polymerization | 91/6293 | 172/18723 | 1.34e-07 | 2.20e-06 | 91 |
| GO:0061572210 | Thyroid | ATC | actin filament bundle organization | 86/6293 | 161/18723 | 1.68e-07 | 2.69e-06 | 86 |
| GO:0031532111 | Thyroid | ATC | actin cytoskeleton reorganization | 62/6293 | 107/18723 | 2.01e-07 | 3.17e-06 | 62 |
| GO:005076922 | Thyroid | ATC | positive regulation of neurogenesis | 112/6293 | 225/18723 | 3.53e-07 | 5.21e-06 | 112 |
| GO:005076723 | Thyroid | ATC | regulation of neurogenesis | 168/6293 | 364/18723 | 3.73e-07 | 5.48e-06 | 168 |
| Page: 1 2 3 4 5 6 7 8 9 10 11 12 13 14 15 16 17 18 19 20 21 22 23 24 25 26 27 28 29 30 31 32 33 34 35 36 37 38 39 40 41 42 43 44 45 46 47 48 49 50 51 52 53 |
| Pathway ID | Tissue | Disease Stage | Description | Gene Ratio | Bg Ratio | pvalue | p.adjust | qvalue | Count |
| hsa05130211 | Esophagus | ESCC | Pathogenic Escherichia coli infection | 142/4205 | 197/8465 | 8.21e-11 | 1.06e-09 | 5.42e-10 | 142 |
| hsa0513526 | Esophagus | ESCC | Yersinia infection | 100/4205 | 137/8465 | 1.80e-08 | 1.59e-07 | 8.12e-08 | 100 |
| hsa0452030 | Esophagus | ESCC | Adherens junction | 69/4205 | 93/8465 | 1.08e-06 | 6.83e-06 | 3.50e-06 | 69 |
| hsa0481028 | Esophagus | ESCC | Regulation of actin cytoskeleton | 133/4205 | 229/8465 | 5.94e-03 | 1.48e-02 | 7.56e-03 | 133 |
| hsa05130310 | Esophagus | ESCC | Pathogenic Escherichia coli infection | 142/4205 | 197/8465 | 8.21e-11 | 1.06e-09 | 5.42e-10 | 142 |
| hsa05135111 | Esophagus | ESCC | Yersinia infection | 100/4205 | 137/8465 | 1.80e-08 | 1.59e-07 | 8.12e-08 | 100 |
| hsa04520114 | Esophagus | ESCC | Adherens junction | 69/4205 | 93/8465 | 1.08e-06 | 6.83e-06 | 3.50e-06 | 69 |
| hsa04810112 | Esophagus | ESCC | Regulation of actin cytoskeleton | 133/4205 | 229/8465 | 5.94e-03 | 1.48e-02 | 7.56e-03 | 133 |
| hsa0513042 | Liver | HCC | Pathogenic Escherichia coli infection | 129/4020 | 197/8465 | 2.02e-07 | 2.50e-06 | 1.39e-06 | 129 |
| hsa0452042 | Liver | HCC | Adherens junction | 68/4020 | 93/8465 | 3.99e-07 | 4.46e-06 | 2.48e-06 | 68 |
| hsa0513542 | Liver | HCC | Yersinia infection | 92/4020 | 137/8465 | 2.25e-06 | 2.19e-05 | 1.22e-05 | 92 |
| hsa0481041 | Liver | HCC | Regulation of actin cytoskeleton | 134/4020 | 229/8465 | 4.48e-04 | 1.94e-03 | 1.08e-03 | 134 |
| hsa0513052 | Liver | HCC | Pathogenic Escherichia coli infection | 129/4020 | 197/8465 | 2.02e-07 | 2.50e-06 | 1.39e-06 | 129 |
| hsa0452052 | Liver | HCC | Adherens junction | 68/4020 | 93/8465 | 3.99e-07 | 4.46e-06 | 2.48e-06 | 68 |
| hsa0513552 | Liver | HCC | Yersinia infection | 92/4020 | 137/8465 | 2.25e-06 | 2.19e-05 | 1.22e-05 | 92 |
| hsa0481051 | Liver | HCC | Regulation of actin cytoskeleton | 134/4020 | 229/8465 | 4.48e-04 | 1.94e-03 | 1.08e-03 | 134 |
| hsa0513030 | Oral cavity | OSCC | Pathogenic Escherichia coli infection | 129/3704 | 197/8465 | 4.32e-10 | 5.17e-09 | 2.63e-09 | 129 |
| hsa0513520 | Oral cavity | OSCC | Yersinia infection | 94/3704 | 137/8465 | 2.85e-09 | 3.08e-08 | 1.57e-08 | 94 |
| hsa0452029 | Oral cavity | OSCC | Adherens junction | 62/3704 | 93/8465 | 6.34e-06 | 3.12e-05 | 1.59e-05 | 62 |
| hsa0481026 | Oral cavity | OSCC | Regulation of actin cytoskeleton | 129/3704 | 229/8465 | 7.14e-05 | 2.74e-04 | 1.40e-04 | 129 |
| Page: 1 2 3 |
Top |
Cell-cell communication analysis |
| Identification of potential cell-cell interactions between two cell types and their ligand-receptor pairs for different disease states |
| Ligand | Receptor | LRpair | Pathway | Tissue | Disease Stage |
| Page: 1 |
Top |
Single-cell gene regulatory network inference analysis |
| Find out the significant the regulons (TFs) and the target genes of each regulon across cell types for different disease states |
| TF | Cell Type | Tissue | Disease Stage | Target Gene | RSS | Regulon Activity |
| ∗The dot plots of a searched regulon are shown for all cell subpopulations in each disease state of each tissue based on the regulon specific score inferred using pySCENIC and by calculating the average expression. |
| Page: 1 |
Top |
Somatic mutation of malignant transformation related genes |
| Annotation of somatic variants for genes involved in malignant transformation |
| Hugo Symbol | Variant Class | Variant Classification | dbSNP RS | HGVSc | HGVSp | HGVSp Short | SWISSPROT | BIOTYPE | SIFT | PolyPhen | Tumor Sample Barcode | Tissue | Histology | Sex | Age | Stage | Therapy Types | Drugs | Outcome |
| BAIAP2 | SNV | Missense_Mutation | novel | c.1307N>T | p.Asp436Val | p.D436V | Q9UQB8 | protein_coding | deleterious(0.05) | benign(0.05) | TCGA-A2-A4S3-01 | Breast | breast invasive carcinoma | Female | <65 | I/II | Unknown | Unknown | SD |
| BAIAP2 | SNV | Missense_Mutation | novel | c.1146N>G | p.Ile382Met | p.I382M | Q9UQB8 | protein_coding | tolerated(0.06) | possibly_damaging(0.455) | TCGA-OL-A5RW-01 | Breast | breast invasive carcinoma | Female | <65 | I/II | Chemotherapy | adriamycin | CR |
| BAIAP2 | insertion | Frame_Shift_Ins | novel | c.1251_1252insCCTCAGAACCCTGTGATGATTGCGTTAACTGCACAAATTGTTC | p.Ser418ProfsTer16 | p.S418Pfs*16 | Q9UQB8 | protein_coding | TCGA-B6-A0I6-01 | Breast | breast invasive carcinoma | Female | <65 | I/II | Unknown | Unknown | PD | ||
| BAIAP2 | SNV | Missense_Mutation | novel | c.460N>T | p.Pro154Ser | p.P154S | Q9UQB8 | protein_coding | tolerated(0.08) | probably_damaging(0.999) | TCGA-2W-A8YY-01 | Cervix | cervical & endocervical cancer | Female | <65 | I/II | Chemotherapy | cisplatin | CR |
| BAIAP2 | SNV | Missense_Mutation | novel | c.1289N>T | p.Ser430Phe | p.S430F | Q9UQB8 | protein_coding | deleterious(0) | probably_damaging(1) | TCGA-VS-A9U7-01 | Cervix | cervical & endocervical cancer | Female | <65 | I/II | Chemotherapy | cisplatin | CR |
| BAIAP2 | SNV | Missense_Mutation | c.1229N>A | p.Arg410His | p.R410H | Q9UQB8 | protein_coding | deleterious(0) | probably_damaging(1) | TCGA-A6-5659-01 | Colorectum | colon adenocarcinoma | Male | >=65 | I/II | Unknown | Unknown | SD | |
| BAIAP2 | SNV | Missense_Mutation | novel | c.1269N>T | p.Met423Ile | p.M423I | Q9UQB8 | protein_coding | tolerated(0.1) | benign(0.018) | TCGA-A6-5665-01 | Colorectum | colon adenocarcinoma | Female | >=65 | I/II | Unknown | Unknown | PD |
| BAIAP2 | SNV | Missense_Mutation | rs760359913 | c.1552N>A | p.Val518Ile | p.V518I | Q9UQB8 | protein_coding | tolerated(0.1) | benign(0.023) | TCGA-A6-6141-01 | Colorectum | colon adenocarcinoma | Male | <65 | I/II | Chemotherapy | 5-fu | SD |
| BAIAP2 | SNV | Missense_Mutation | c.314N>C | p.Leu105Pro | p.L105P | Q9UQB8 | protein_coding | deleterious(0) | probably_damaging(1) | TCGA-AD-6895-01 | Colorectum | colon adenocarcinoma | Male | >=65 | III/IV | Unknown | Unknown | SD | |
| BAIAP2 | SNV | Missense_Mutation | rs768070859 | c.1408N>A | p.Asp470Asn | p.D470N | Q9UQB8 | protein_coding | deleterious(0) | benign(0.109) | TCGA-CM-4752-01 | Colorectum | colon adenocarcinoma | Male | <65 | I/II | Unknown | Unknown | SD |
| Page: 1 2 3 4 5 6 |
Top |
Related drugs of malignant transformation related genes |
| Identification of chemicals and drugs interact with genes involved in malignant transfromation |
| (DGIdb 4.0) |
| Entrez ID | Symbol | Category | Interaction Types | Drug Claim Name | Drug Name | PMIDs |
| Page: 1 |

Copyright 2023-Present -The University of Texas Health Science Center at Houston |