
|
|||||
|
 | |
| |
| |
| |
| |
| |
|
Gene: TRIM2 |
Gene summary for TRIM2 |
| Gene information | Species | Human | Gene symbol | TRIM2 | Gene ID | 23321 |
| Gene name | tripartite motif containing 2 | |
| Gene Alias | CMT2R | |
| Cytomap | 4q31.3 | |
| Gene Type | protein-coding | GO ID | GO:0000209 | UniProtAcc | Q9C040 |
Top |
Malignant transformation analysis |
| Identification of the aberrant gene expression in precancerous and cancerous lesions by comparing the gene expression of stem-like cells in diseased tissues with normal stem cells |
| Entrez ID | Symbol | Replicates | Species | Organ | Tissue | Adj P-value | Log2FC | Malignancy |
| 23321 | TRIM2 | CA_HPV_1 | Human | Cervix | CC | 8.99e-09 | -2.78e-01 | 0.0264 |
| 23321 | TRIM2 | CA_HPV_3 | Human | Cervix | CC | 2.44e-02 | -2.31e-01 | 0.0414 |
| 23321 | TRIM2 | N_HPV_1 | Human | Cervix | N_HPV | 4.34e-05 | -2.58e-01 | 0.0079 |
| 23321 | TRIM2 | N_HPV_2 | Human | Cervix | N_HPV | 1.34e-02 | -2.46e-01 | -0.0131 |
| 23321 | TRIM2 | CCI_1 | Human | Cervix | CC | 4.97e-02 | 6.42e-01 | 0.528 |
| 23321 | TRIM2 | CCI_2 | Human | Cervix | CC | 9.64e-04 | 7.16e-01 | 0.5249 |
| 23321 | TRIM2 | H2 | Human | Cervix | HSIL_HPV | 5.94e-07 | 3.49e-01 | 0.0632 |
| 23321 | TRIM2 | HTA11_3410_2000001011 | Human | Colorectum | AD | 2.73e-08 | -4.24e-01 | 0.0155 |
| 23321 | TRIM2 | HTA11_347_2000001011 | Human | Colorectum | AD | 2.80e-19 | 8.02e-01 | -0.1954 |
| 23321 | TRIM2 | HTA11_3361_2000001011 | Human | Colorectum | AD | 3.76e-03 | -5.61e-01 | -0.1207 |
| 23321 | TRIM2 | HTA11_8622_2000001021 | Human | Colorectum | SER | 3.58e-05 | -5.05e-01 | 0.0528 |
| 23321 | TRIM2 | HTA11_99999970781_79442 | Human | Colorectum | MSS | 1.56e-02 | -2.87e-01 | 0.294 |
| 23321 | TRIM2 | HTA11_99999965104_69814 | Human | Colorectum | MSS | 3.94e-08 | 6.73e-01 | 0.281 |
| 23321 | TRIM2 | HTA11_99999974143_84620 | Human | Colorectum | MSS | 3.14e-05 | -4.08e-01 | 0.3005 |
| 23321 | TRIM2 | A002-C-010 | Human | Colorectum | FAP | 1.57e-05 | 1.49e-01 | 0.242 |
| 23321 | TRIM2 | A015-C-203 | Human | Colorectum | FAP | 9.78e-29 | -2.81e-01 | -0.1294 |
| 23321 | TRIM2 | A014-C-040 | Human | Colorectum | FAP | 2.14e-02 | -2.98e-01 | -0.1184 |
| 23321 | TRIM2 | A002-C-201 | Human | Colorectum | FAP | 1.50e-08 | -2.20e-01 | 0.0324 |
| 23321 | TRIM2 | A001-C-119 | Human | Colorectum | FAP | 4.63e-10 | 2.65e-01 | -0.1557 |
| 23321 | TRIM2 | A001-C-108 | Human | Colorectum | FAP | 3.99e-13 | -1.20e-01 | -0.0272 |
| Page: 1 2 3 4 5 6 7 8 9 |
| Tissue | Expression Dynamics | Abbreviation |
| Cervix |  | CC: Cervix cancer |
| HSIL_HPV: HPV-infected high-grade squamous intraepithelial lesions | ||
| N_HPV: HPV-infected normal cervix | ||
| Colorectum (GSE201348) |  | FAP: Familial adenomatous polyposis |
| CRC: Colorectal cancer | ||
| Colorectum (HTA11) |  | AD: Adenomas |
| SER: Sessile serrated lesions | ||
| MSI-H: Microsatellite-high colorectal cancer | ||
| MSS: Microsatellite stable colorectal cancer | ||
| Endometrium | 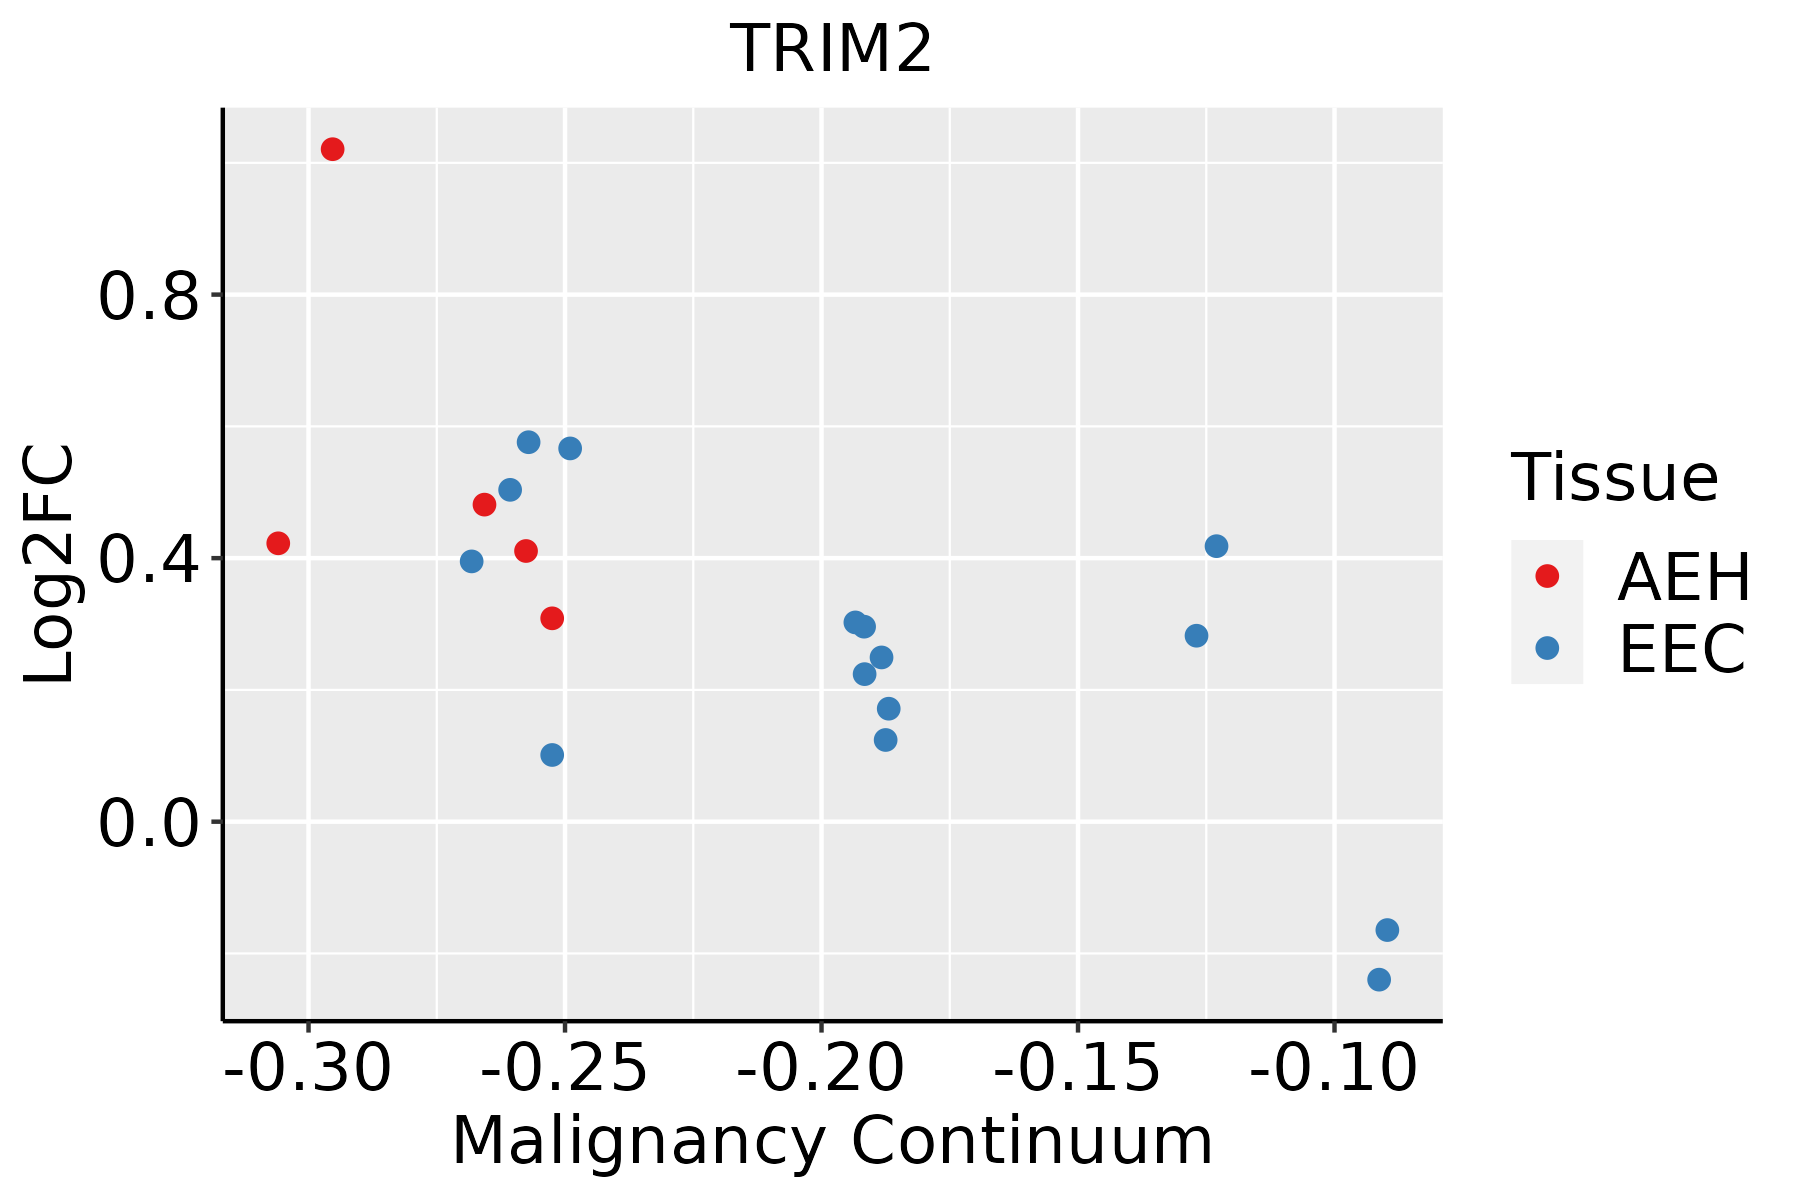 | AEH: Atypical endometrial hyperplasia |
| EEC: Endometrioid Cancer | ||
| Esophagus | 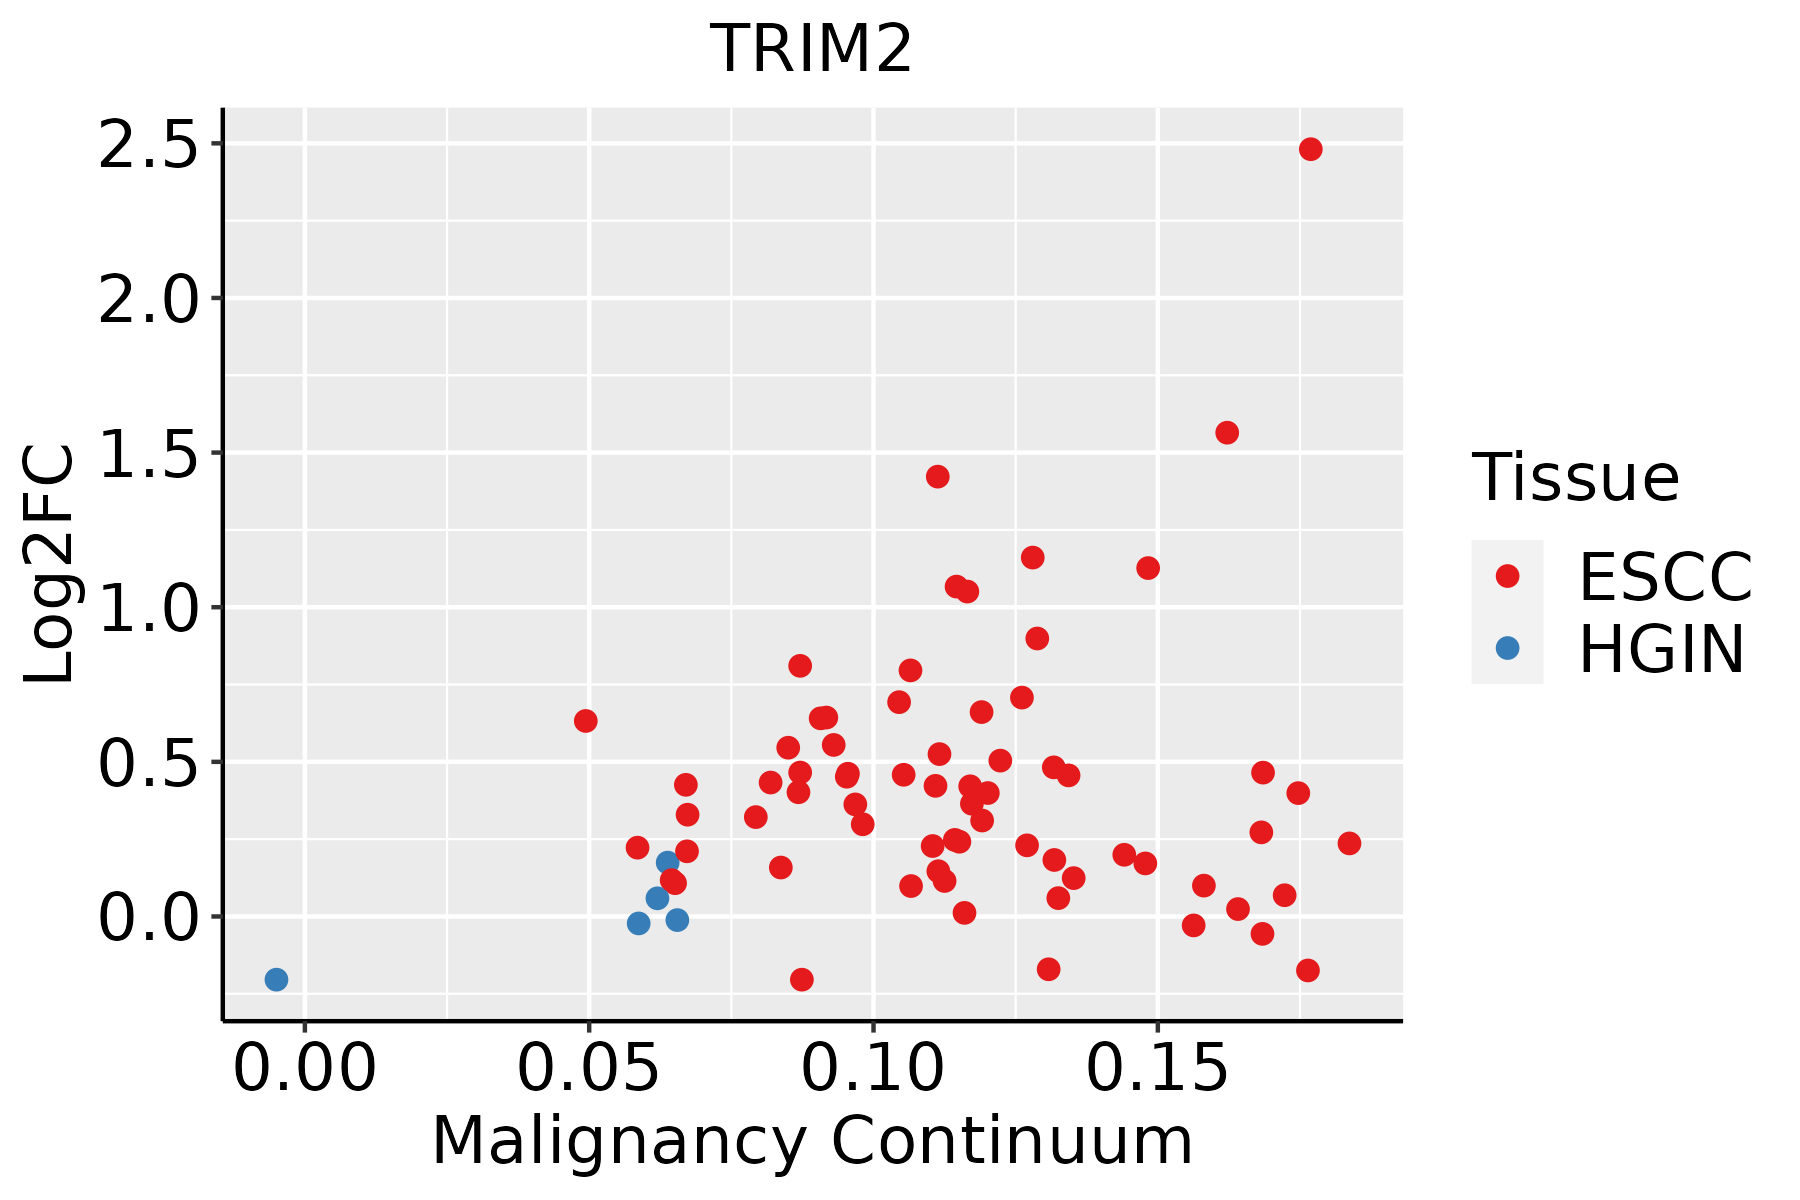 | ESCC: Esophageal squamous cell carcinoma |
| HGIN: High-grade intraepithelial neoplasias | ||
| LGIN: Low-grade intraepithelial neoplasias | ||
| Liver | 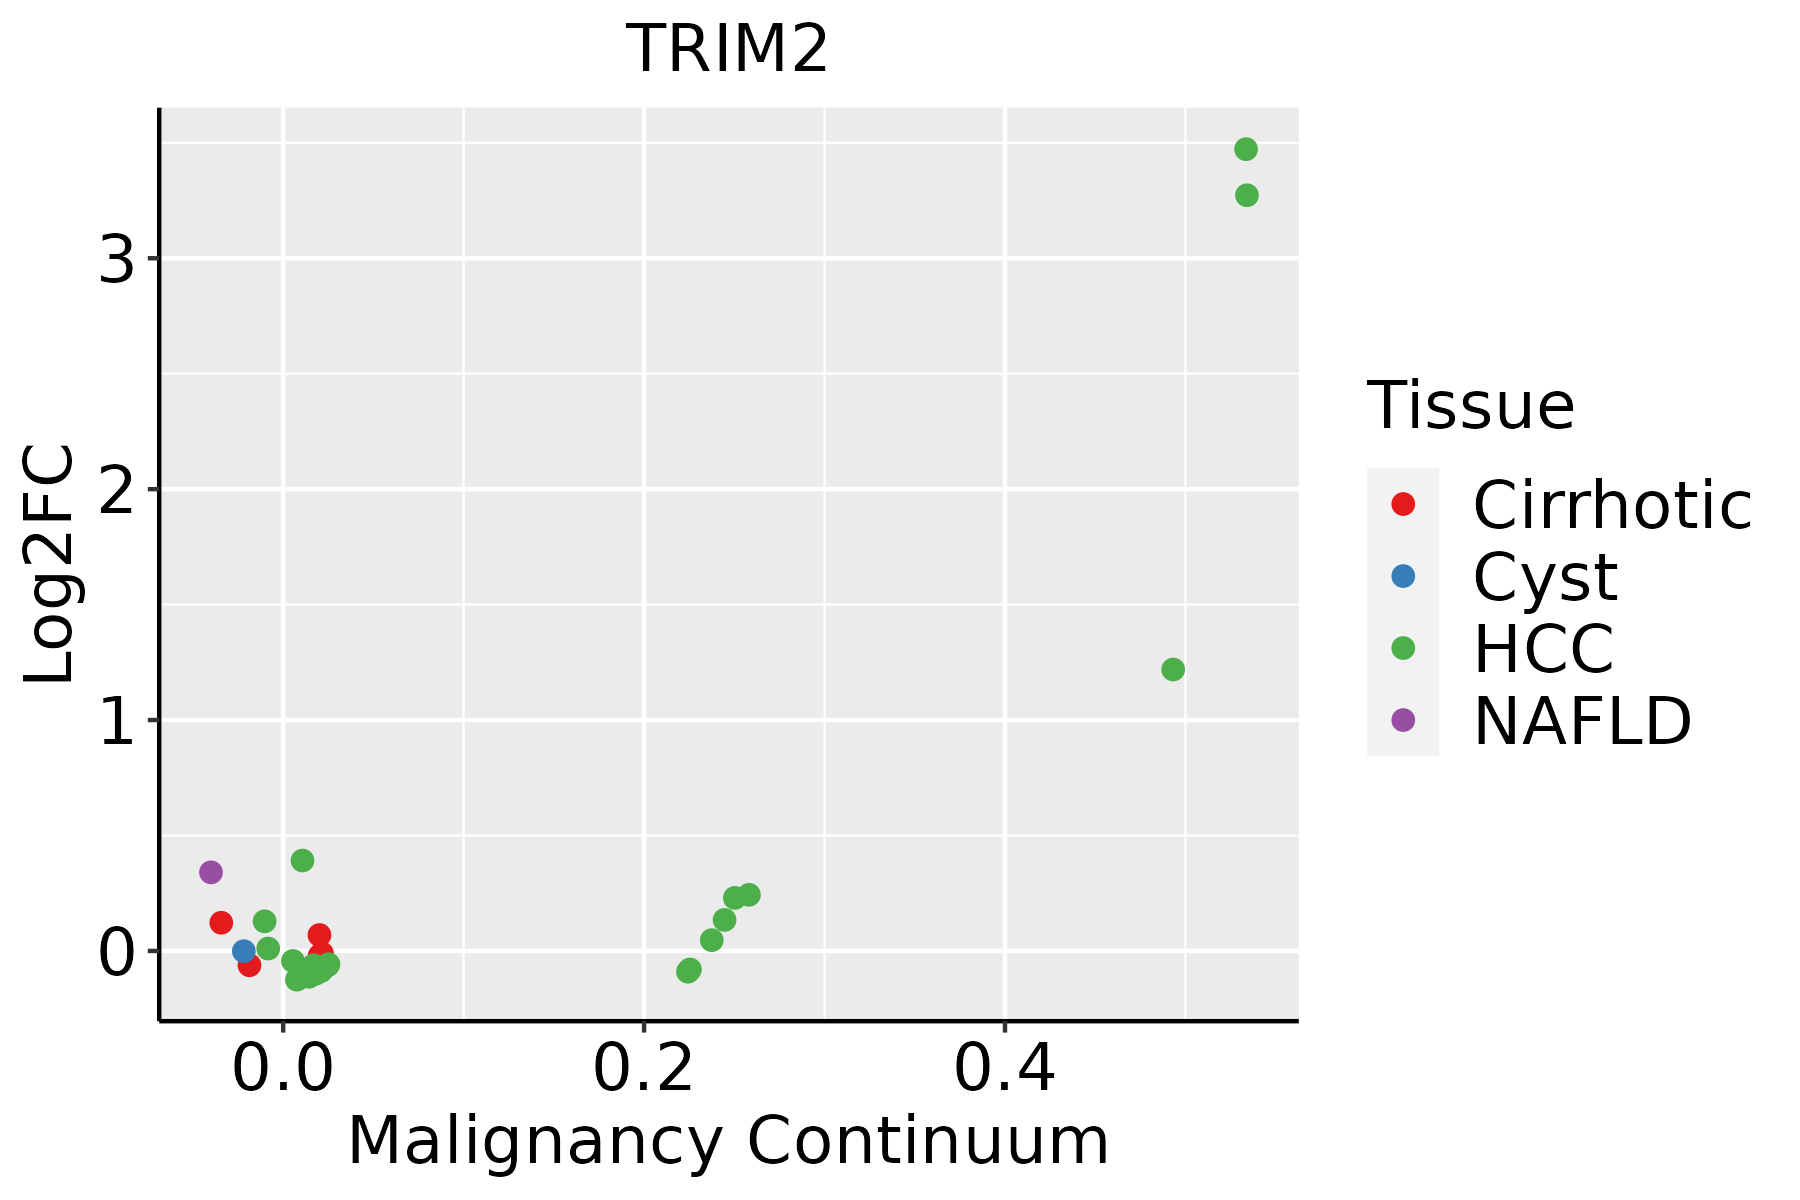 | HCC: Hepatocellular carcinoma |
| NAFLD: Non-alcoholic fatty liver disease | ||
| Lung | 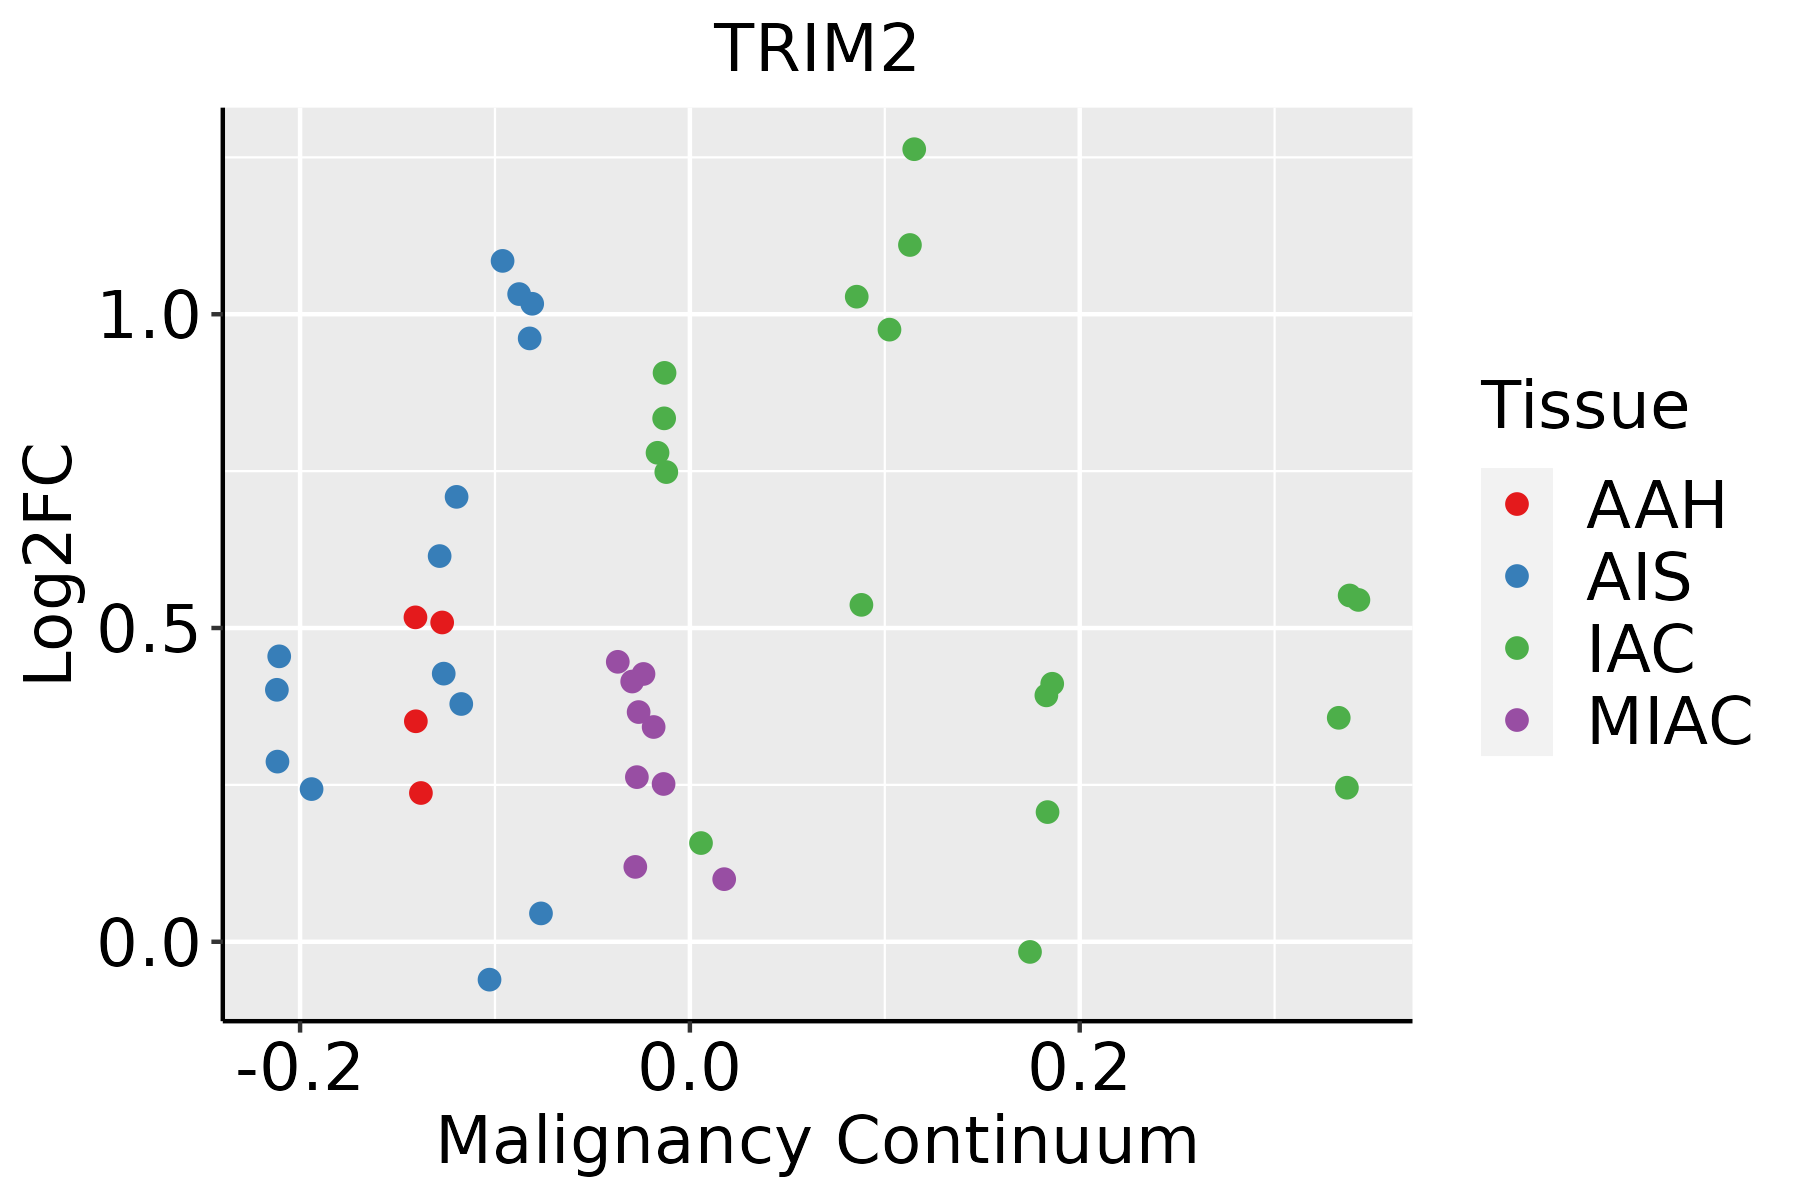 | AAH: Atypical adenomatous hyperplasia |
| AIS: Adenocarcinoma in situ | ||
| IAC: Invasive lung adenocarcinoma | ||
| MIA: Minimally invasive adenocarcinoma | ||
| Oral Cavity |  | EOLP: Erosive Oral lichen planus |
| LP: leukoplakia | ||
| NEOLP: Non-erosive oral lichen planus | ||
| OSCC: Oral squamous cell carcinoma | ||
| Prostate | 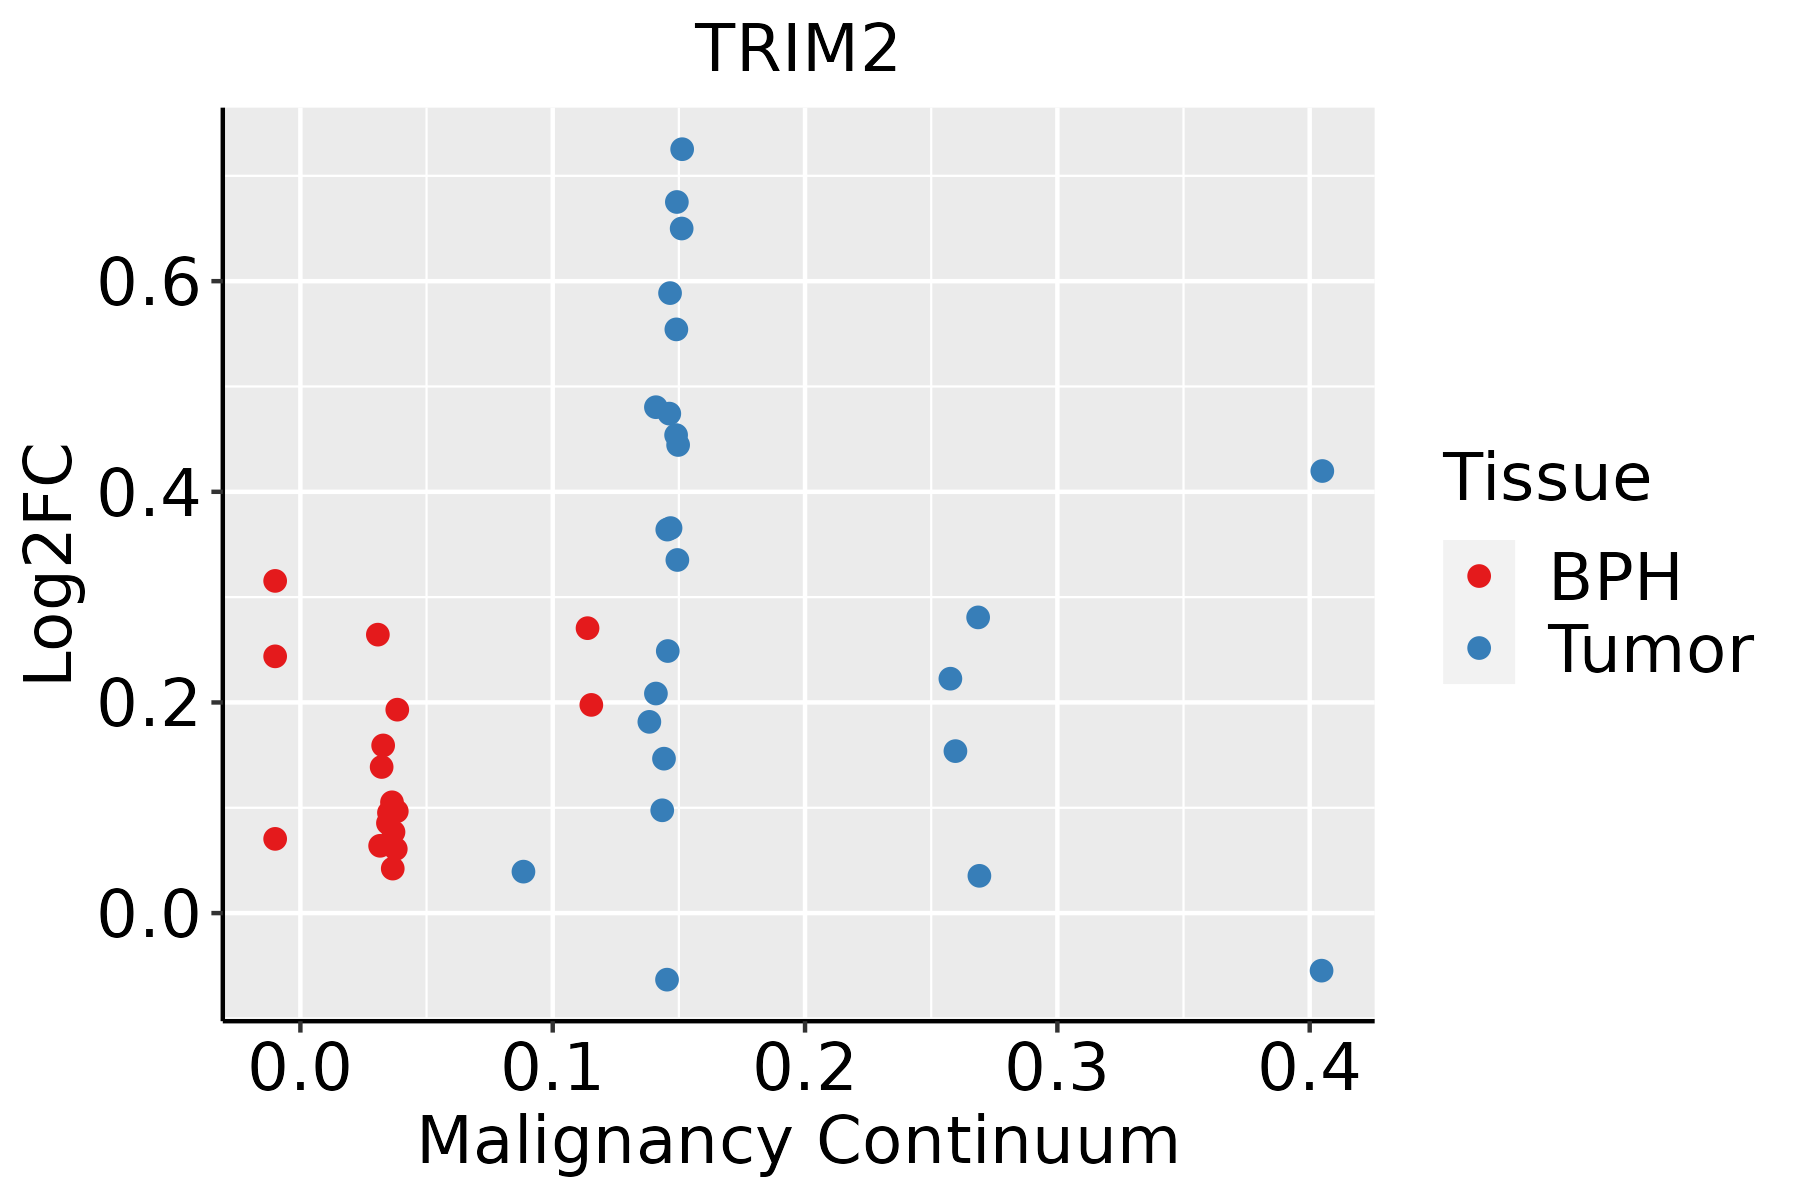 | BPH: Benign Prostatic Hyperplasia |
| Thyroid | 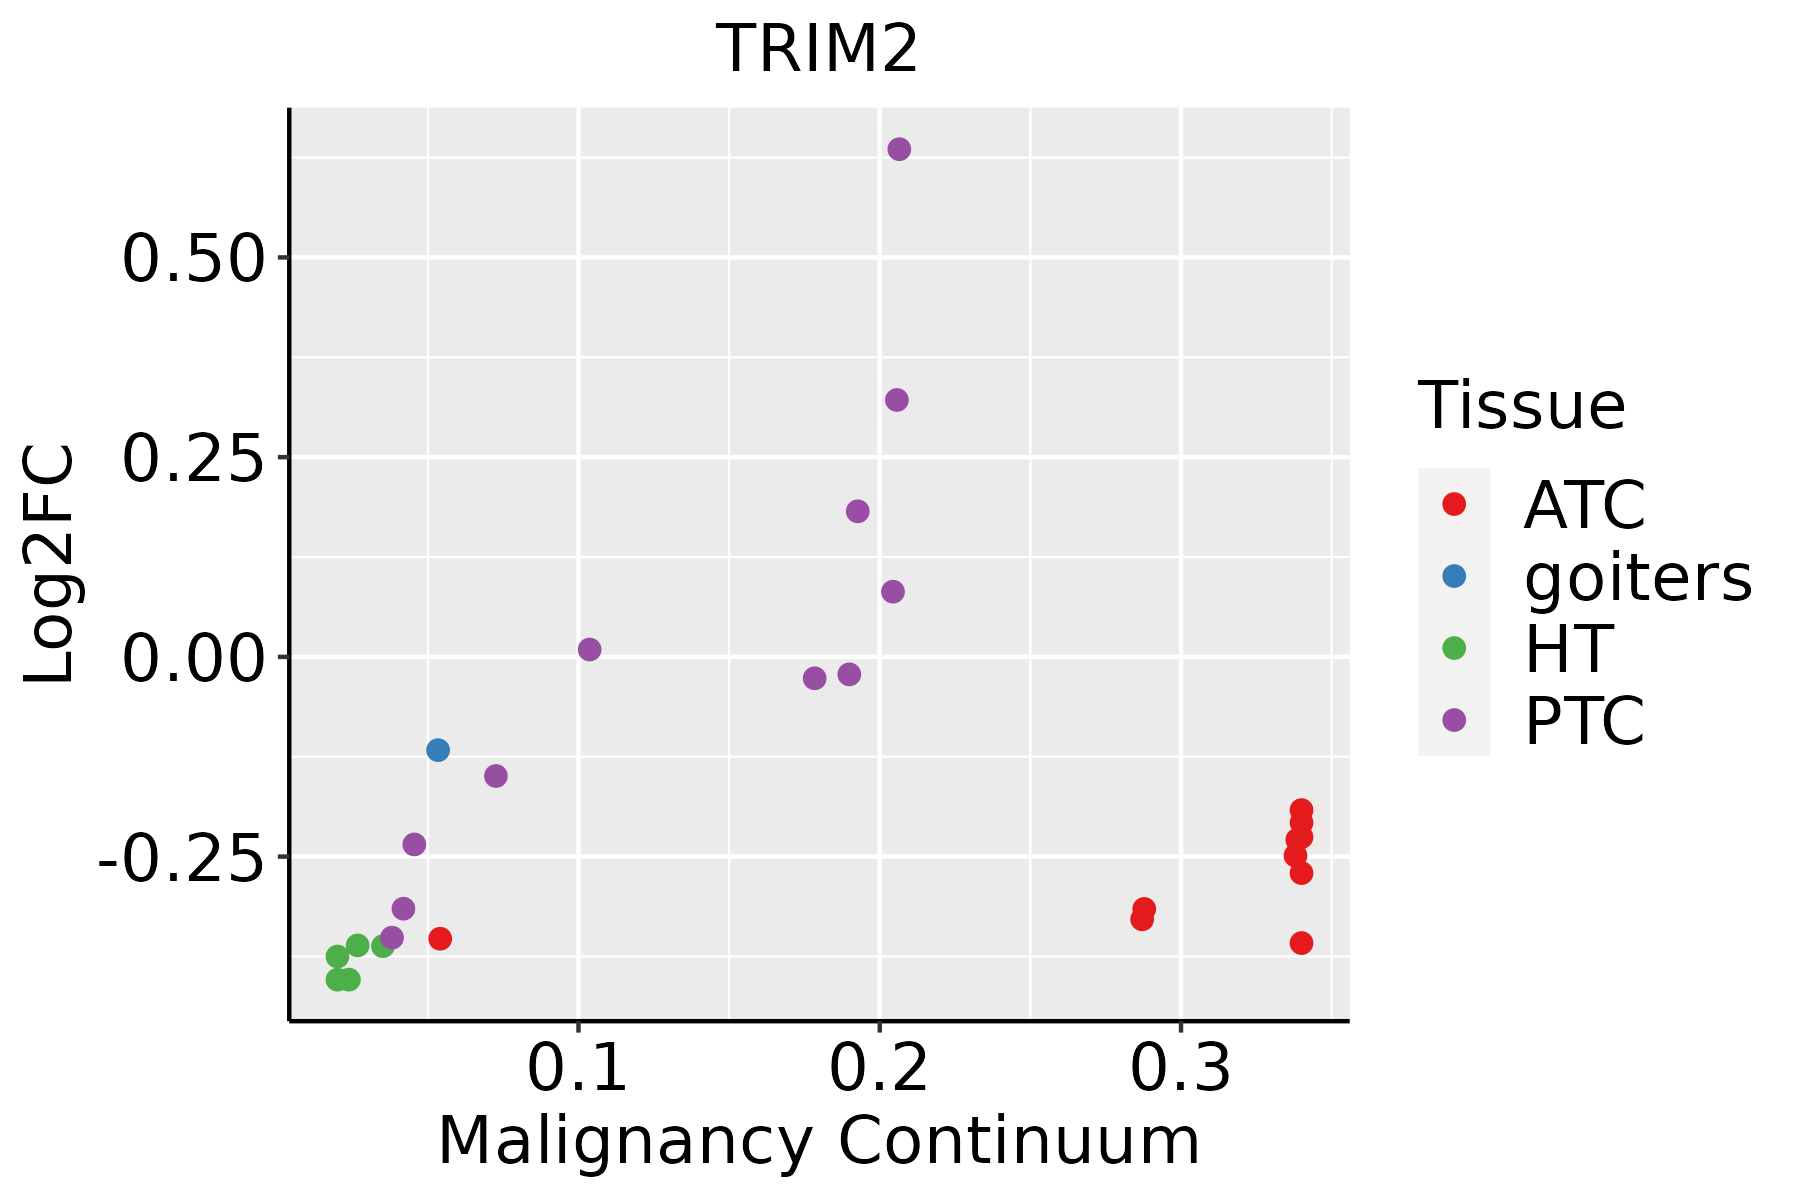 | ATC: Anaplastic thyroid cancer |
| HT: Hashimoto's thyroiditis | ||
| PTC: Papillary thyroid cancer |
| ∗log2FC in expression of this searched gene in stem-like cells from each diseased tissue sample relative to stem-like cells in normal samples in each tissue plotted against the malignancy continuum. Samples are colored based on if they are from different disease stage. |
Top |
Malignant transformation related pathway analysis |
| Find out the enriched GO biological processes and KEGG pathways involved in transition from healthy to precancer to cancer |
| Tissue | Disease Stage | Enriched GO biological Processes |
| Colorectum | AD |  |
| Colorectum | SER |  |
| Colorectum | MSS |  |
| Colorectum | MSI-H |  |
| Colorectum | FAP |  |
| ∗Top 15 enriched GO BP terms are showed in the bar plot of each disease state in each tissue. Each row represents a significant GO biological process which is colored according to the -log10(p.adjust). |
| Page: 1 2 3 4 5 6 7 8 9 |
| GO ID | Tissue | Disease Stage | Description | Gene Ratio | Bg Ratio | pvalue | p.adjust | Count |
| GO:004390312 | Lung | AIS | regulation of biological process involved in symbiotic interaction | 16/1849 | 72/18723 | 1.50e-03 | 1.81e-02 | 16 |
| GO:005109111 | Lung | AIS | positive regulation of DNA-binding transcription factor activity | 41/1849 | 260/18723 | 1.77e-03 | 2.01e-02 | 41 |
| GO:003166913 | Lung | AIS | cellular response to nutrient levels | 35/1849 | 215/18723 | 2.15e-03 | 2.31e-02 | 35 |
| GO:005237212 | Lung | AIS | modulation by symbiont of entry into host | 12/1849 | 49/18723 | 2.39e-03 | 2.48e-02 | 12 |
| GO:190390013 | Lung | AIS | regulation of viral life cycle | 26/1849 | 148/18723 | 2.64e-03 | 2.68e-02 | 26 |
| GO:003166713 | Lung | AIS | response to nutrient levels | 64/1849 | 474/18723 | 6.13e-03 | 4.98e-02 | 64 |
| GO:004316123 | Lung | MIAC | proteasome-mediated ubiquitin-dependent protein catabolic process | 37/967 | 412/18723 | 7.87e-04 | 1.76e-02 | 37 |
| GO:000020922 | Lung | MIAC | protein polyubiquitination | 24/967 | 236/18723 | 1.22e-03 | 2.31e-02 | 24 |
| GO:001049823 | Lung | MIAC | proteasomal protein catabolic process | 40/967 | 490/18723 | 2.92e-03 | 3.99e-02 | 40 |
| GO:007099723 | Lung | MIAC | neuron death | 31/967 | 361/18723 | 3.97e-03 | 4.79e-02 | 31 |
| GO:001049820 | Oral cavity | OSCC | proteasomal protein catabolic process | 336/7305 | 490/18723 | 5.45e-41 | 8.63e-38 | 336 |
| GO:004316120 | Oral cavity | OSCC | proteasome-mediated ubiquitin-dependent protein catabolic process | 285/7305 | 412/18723 | 5.68e-36 | 5.99e-33 | 285 |
| GO:007259418 | Oral cavity | OSCC | establishment of protein localization to organelle | 284/7305 | 422/18723 | 1.50e-32 | 1.35e-29 | 284 |
| GO:001603220 | Oral cavity | OSCC | viral process | 274/7305 | 415/18723 | 2.42e-29 | 1.70e-26 | 274 |
| GO:000989620 | Oral cavity | OSCC | positive regulation of catabolic process | 307/7305 | 492/18723 | 2.29e-26 | 7.64e-24 | 307 |
| GO:003133120 | Oral cavity | OSCC | positive regulation of cellular catabolic process | 273/7305 | 427/18723 | 6.39e-26 | 2.02e-23 | 273 |
| GO:000691317 | Oral cavity | OSCC | nucleocytoplasmic transport | 204/7305 | 301/18723 | 2.65e-24 | 6.98e-22 | 204 |
| GO:005116917 | Oral cavity | OSCC | nuclear transport | 204/7305 | 301/18723 | 2.65e-24 | 6.98e-22 | 204 |
| GO:003497620 | Oral cavity | OSCC | response to endoplasmic reticulum stress | 178/7305 | 256/18723 | 2.59e-23 | 6.06e-21 | 178 |
| GO:001905820 | Oral cavity | OSCC | viral life cycle | 208/7305 | 317/18723 | 4.59e-22 | 1.00e-19 | 208 |
| Page: 1 2 3 4 5 6 7 8 9 10 11 12 13 14 15 16 17 18 19 20 21 22 23 24 25 26 27 28 29 30 31 32 33 34 35 36 37 38 39 40 41 42 43 44 45 46 47 48 49 50 51 52 53 54 55 56 57 58 59 60 61 62 63 64 65 66 67 68 69 70 71 72 73 74 75 76 77 78 79 80 81 82 83 84 85 86 87 88 89 |
| Pathway ID | Tissue | Disease Stage | Description | Gene Ratio | Bg Ratio | pvalue | p.adjust | qvalue | Count |
| Page: 1 |
Top |
Cell-cell communication analysis |
| Identification of potential cell-cell interactions between two cell types and their ligand-receptor pairs for different disease states |
| Ligand | Receptor | LRpair | Pathway | Tissue | Disease Stage |
| Page: 1 |
Top |
Single-cell gene regulatory network inference analysis |
| Find out the significant the regulons (TFs) and the target genes of each regulon across cell types for different disease states |
| TF | Cell Type | Tissue | Disease Stage | Target Gene | RSS | Regulon Activity |
| ∗The dot plots of a searched regulon are shown for all cell subpopulations in each disease state of each tissue based on the regulon specific score inferred using pySCENIC and by calculating the average expression. |
| Page: 1 |
Top |
Somatic mutation of malignant transformation related genes |
| Annotation of somatic variants for genes involved in malignant transformation |
| Hugo Symbol | Variant Class | Variant Classification | dbSNP RS | HGVSc | HGVSp | HGVSp Short | SWISSPROT | BIOTYPE | SIFT | PolyPhen | Tumor Sample Barcode | Tissue | Histology | Sex | Age | Stage | Therapy Types | Drugs | Outcome |
| TRIM2 | SNV | Missense_Mutation | novel | c.1667N>T | p.Ser556Phe | p.S556F | Q9C040 | protein_coding | deleterious(0) | benign(0.352) | TCGA-5L-AAT1-01 | Breast | breast invasive carcinoma | Female | <65 | III/IV | Hormone Therapy | letrozol | SD |
| TRIM2 | SNV | Missense_Mutation | novel | c.230A>G | p.Tyr77Cys | p.Y77C | Q9C040 | protein_coding | deleterious(0) | probably_damaging(0.998) | TCGA-AC-A7VC-01 | Breast | breast invasive carcinoma | Female | <65 | I/II | Unknown | Unknown | SD |
| TRIM2 | SNV | Missense_Mutation | rs780090814 | c.1793G>T | p.Gly598Val | p.G598V | Q9C040 | protein_coding | deleterious(0) | probably_damaging(0.998) | TCGA-BH-A0BZ-01 | Breast | breast invasive carcinoma | Female | <65 | III/IV | Chemotherapy | doxorubicin | CR |
| TRIM2 | insertion | Frame_Shift_Ins | novel | c.211_212insCTCACCCAGGCTGGAGTGC | p.Glu71AlafsTer62 | p.E71Afs*62 | Q9C040 | protein_coding | TCGA-A8-A09D-01 | Breast | breast invasive carcinoma | Female | <65 | I/II | Chemotherapy | doxorubicin | CR | ||
| TRIM2 | deletion | Frame_Shift_Del | novel | c.1234delN | p.Lys412ArgfsTer21 | p.K412Rfs*21 | Q9C040 | protein_coding | TCGA-D8-A27V-01 | Breast | breast invasive carcinoma | Female | <65 | I/II | Hormone Therapy | tamoxiphen | SD | ||
| TRIM2 | SNV | Missense_Mutation | rs759524701 | c.1876G>A | p.Val626Met | p.V626M | Q9C040 | protein_coding | deleterious(0) | probably_damaging(0.997) | TCGA-2W-A8YY-01 | Cervix | cervical & endocervical cancer | Female | <65 | I/II | Chemotherapy | cisplatin | CR |
| TRIM2 | SNV | Missense_Mutation | rs754843842 | c.733N>T | p.Arg245Cys | p.R245C | Q9C040 | protein_coding | deleterious(0) | probably_damaging(0.99) | TCGA-EA-A3HS-01 | Cervix | cervical & endocervical cancer | Female | <65 | I/II | Unknown | Unknown | SD |
| TRIM2 | SNV | Missense_Mutation | novel | c.1724N>A | p.Ile575Asn | p.I575N | Q9C040 | protein_coding | deleterious(0) | probably_damaging(0.995) | TCGA-AA-3979-01 | Colorectum | colon adenocarcinoma | Male | >=65 | I/II | Unknown | Unknown | SD |
| TRIM2 | SNV | Missense_Mutation | novel | c.225N>T | p.Gln75His | p.Q75H | Q9C040 | protein_coding | deleterious(0.01) | probably_damaging(0.992) | TCGA-AA-3984-01 | Colorectum | colon adenocarcinoma | Female | <65 | I/II | Unknown | Unknown | SD |
| TRIM2 | SNV | Missense_Mutation | novel | c.1183N>A | p.Glu395Lys | p.E395K | Q9C040 | protein_coding | tolerated(0.23) | benign(0.253) | TCGA-AA-3984-01 | Colorectum | colon adenocarcinoma | Female | <65 | I/II | Unknown | Unknown | SD |
| Page: 1 2 3 4 5 6 7 |
Top |
Related drugs of malignant transformation related genes |
| Identification of chemicals and drugs interact with genes involved in malignant transfromation |
| (DGIdb 4.0) |
| Entrez ID | Symbol | Category | Interaction Types | Drug Claim Name | Drug Name | PMIDs |
| Page: 1 |

Copyright 2023-Present -The University of Texas Health Science Center at Houston |