| Tissue | Expression Dynamics | Abbreviation |
| Breast |  | IDC: Invasive ductal carcinoma |
| DCIS: Ductal carcinoma in situ |
| Precancer(BRCA1-mut): Precancerous lesion from BRCA1 mutation carriers |
| Cervix |  | CC: Cervix cancer |
| HSIL_HPV: HPV-infected high-grade squamous intraepithelial lesions |
| N_HPV: HPV-infected normal cervix |
| Colorectum (GSE201348) |  | FAP: Familial adenomatous polyposis |
| CRC: Colorectal cancer |
| Colorectum (HTA11) |  | AD: Adenomas |
| SER: Sessile serrated lesions |
| MSI-H: Microsatellite-high colorectal cancer |
| MSS: Microsatellite stable colorectal cancer |
| Endometrium |  | AEH: Atypical endometrial hyperplasia |
| EEC: Endometrioid Cancer |
| Esophagus |  | ESCC: Esophageal squamous cell carcinoma |
| HGIN: High-grade intraepithelial neoplasias |
| LGIN: Low-grade intraepithelial neoplasias |
| Liver | 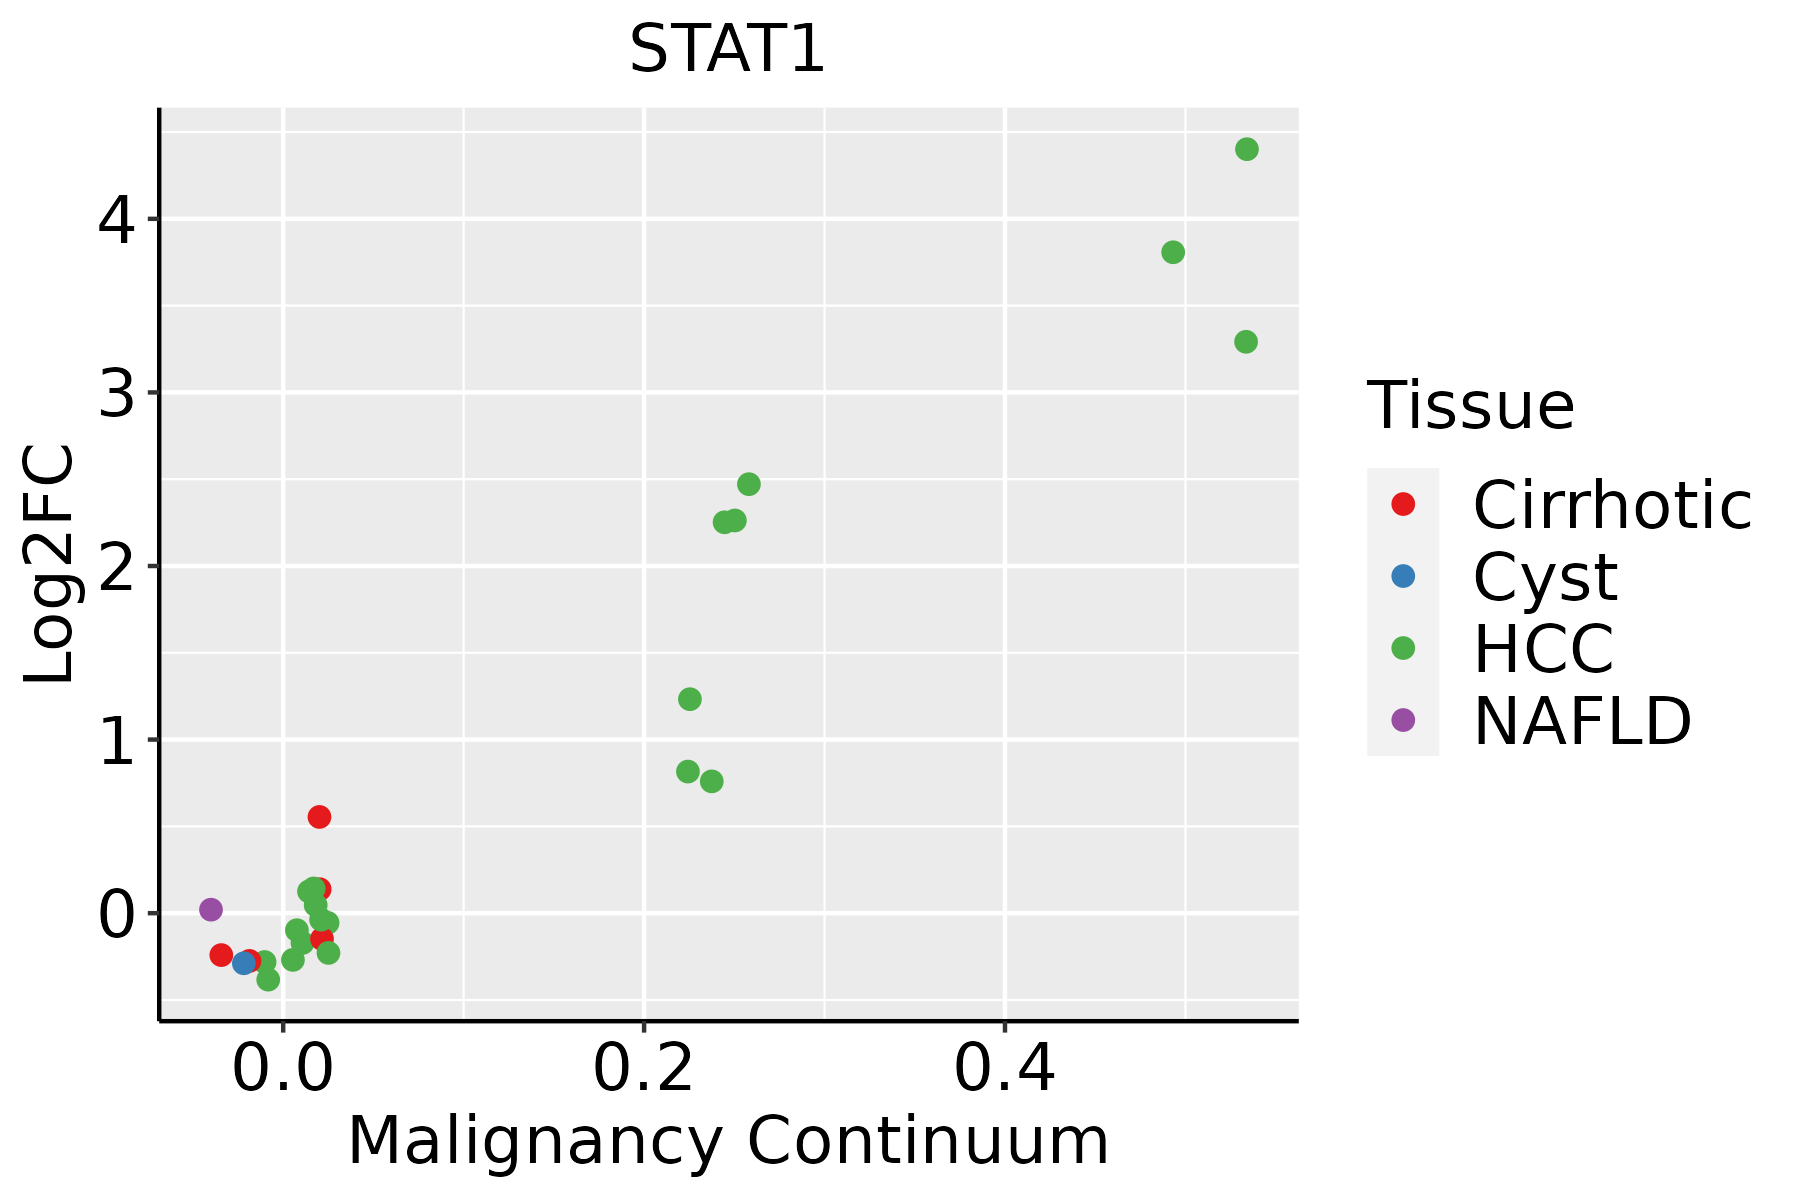 | HCC: Hepatocellular carcinoma |
| NAFLD: Non-alcoholic fatty liver disease |
| Oral Cavity |  | EOLP: Erosive Oral lichen planus |
| LP: leukoplakia |
| NEOLP: Non-erosive oral lichen planus |
| OSCC: Oral squamous cell carcinoma |
| Prostate | 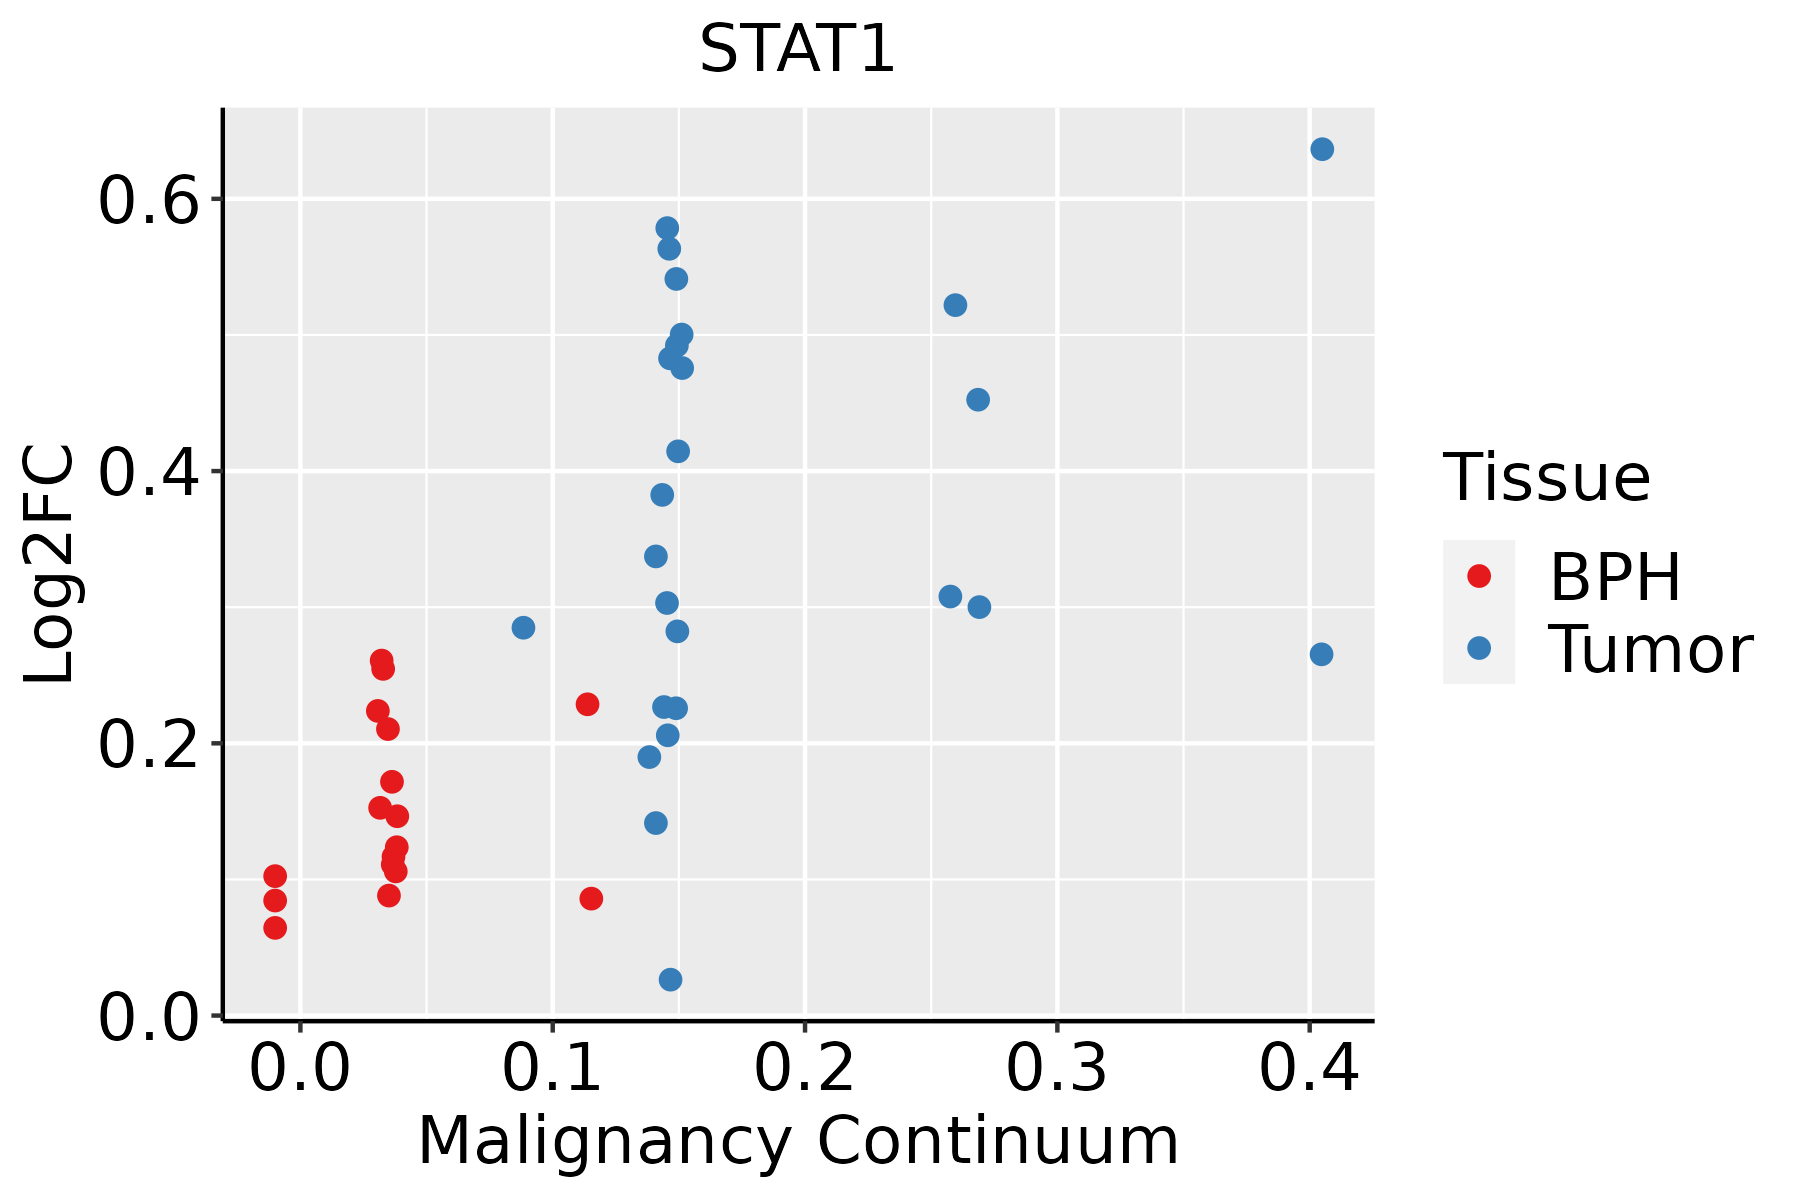 | BPH: Benign Prostatic Hyperplasia |
| Skin | 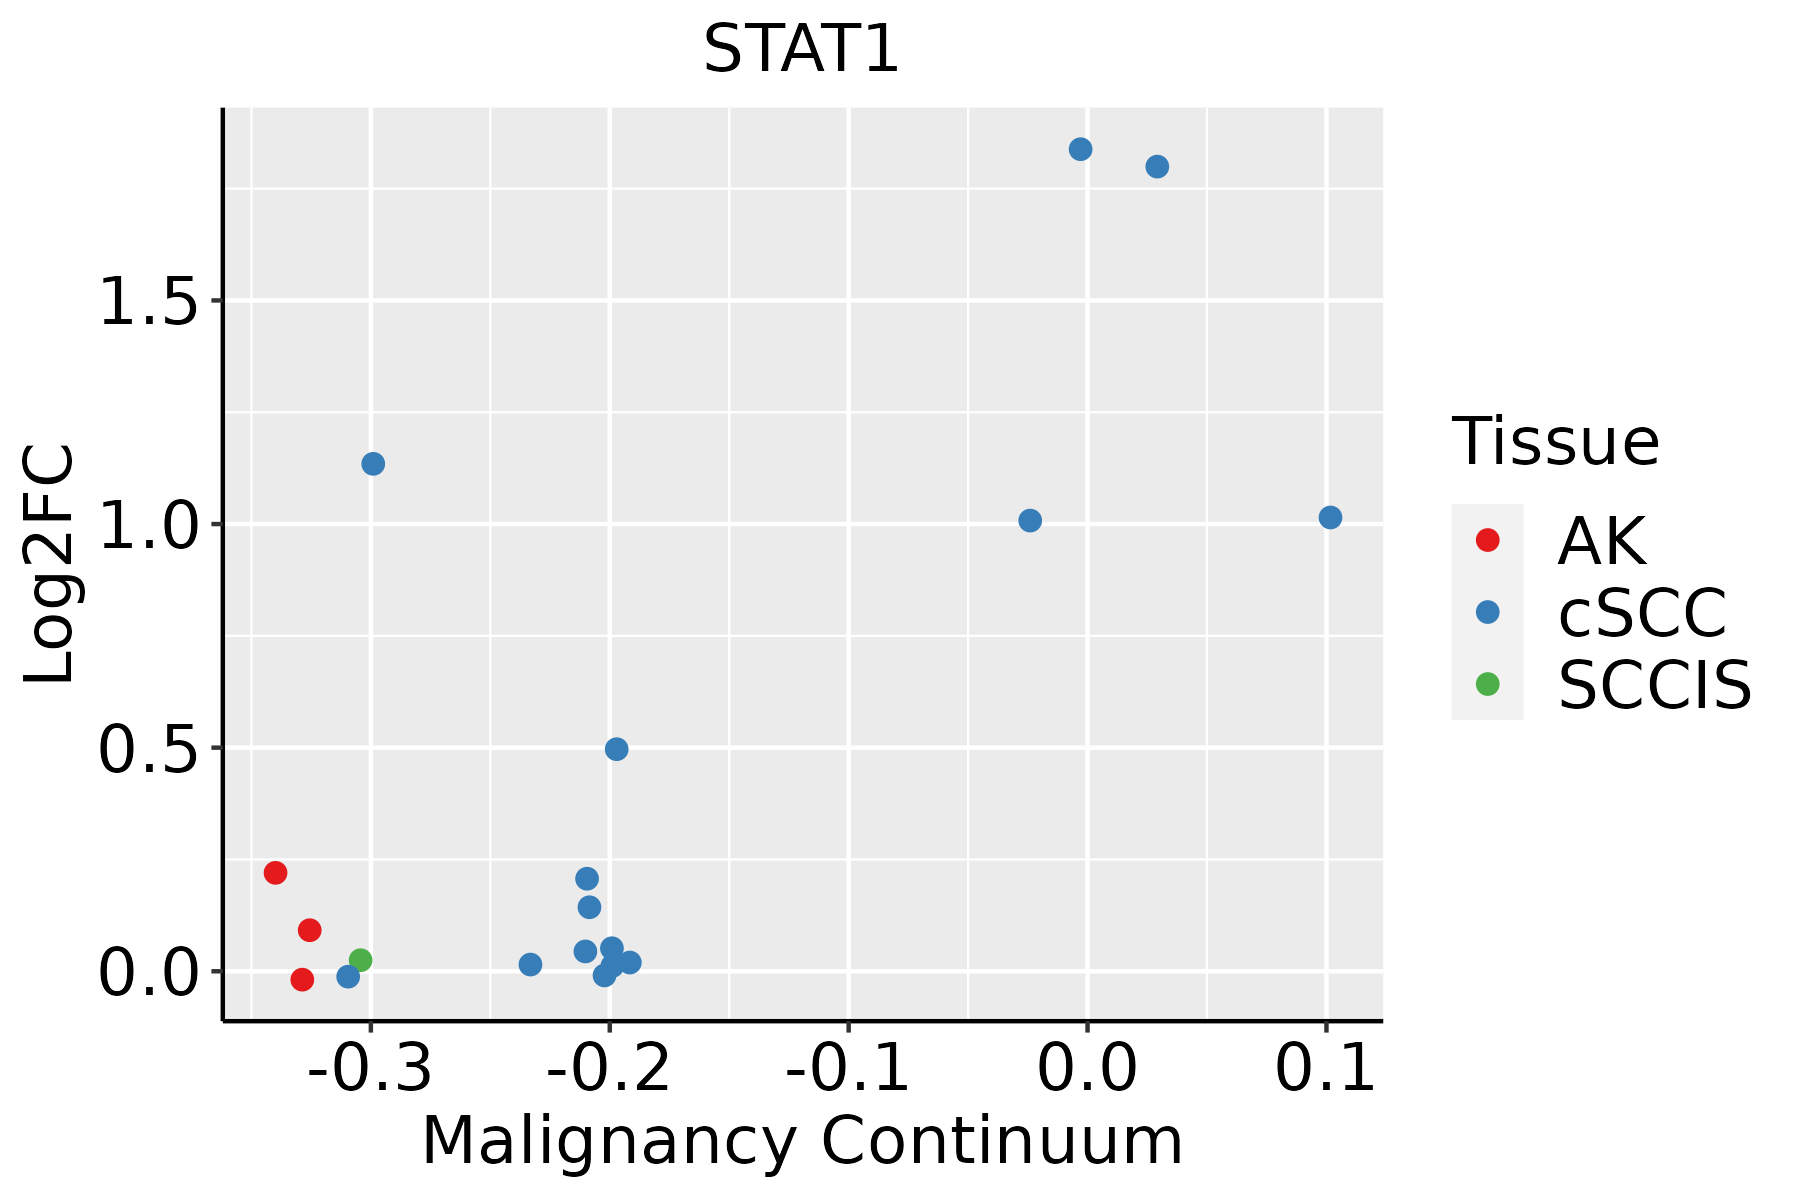 | AK: Actinic keratosis |
| cSCC: Cutaneous squamous cell carcinoma |
| SCCIS:squamous cell carcinoma in situ |
| Thyroid | 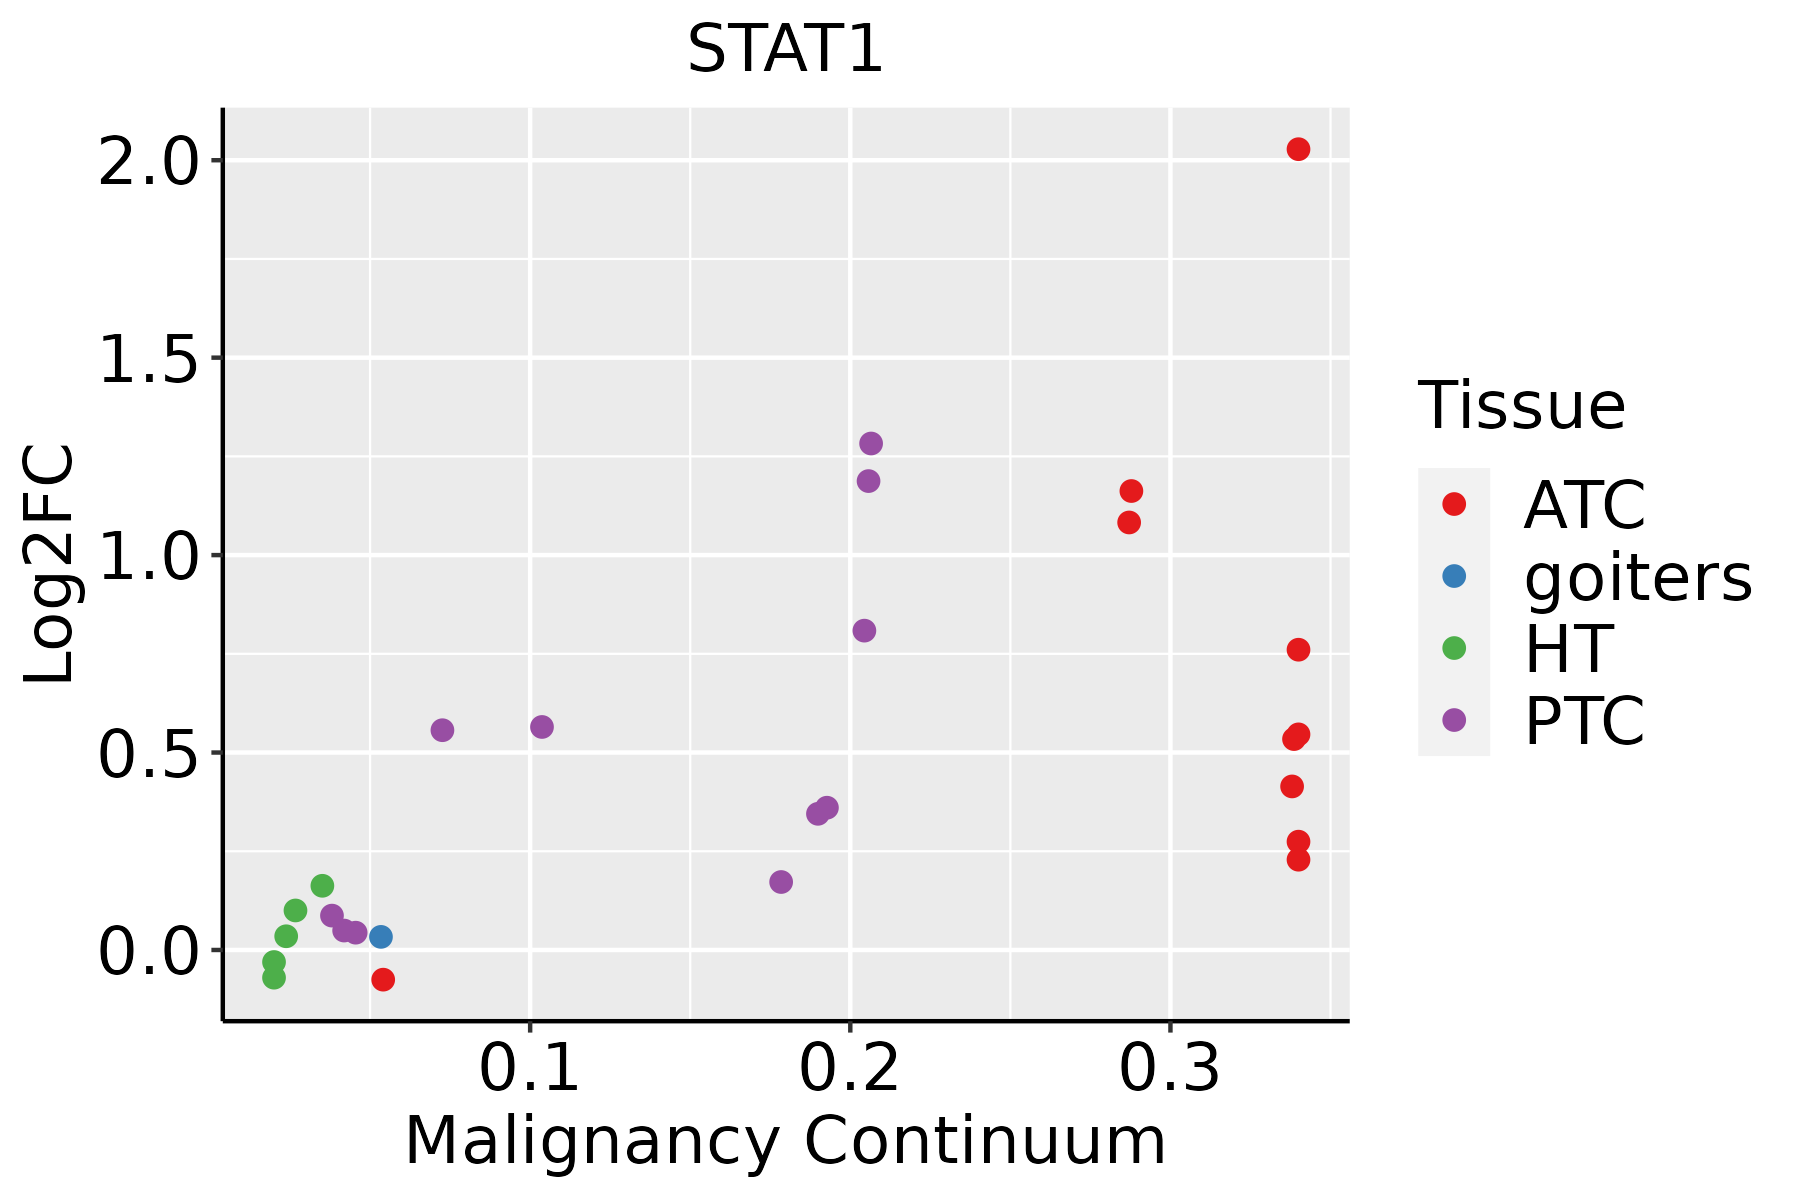 | ATC: Anaplastic thyroid cancer |
| HT: Hashimoto's thyroiditis |
| PTC: Papillary thyroid cancer |
| GO ID | Tissue | Disease Stage | Description | Gene Ratio | Bg Ratio | pvalue | p.adjust | Count |
| GO:0002262113 | Thyroid | PTC | myeloid cell homeostasis | 79/5968 | 157/18723 | 1.11e-06 | 1.64e-05 | 79 |
| GO:000165517 | Thyroid | PTC | urogenital system development | 149/5968 | 338/18723 | 1.41e-06 | 2.01e-05 | 149 |
| GO:007200114 | Thyroid | PTC | renal system development | 135/5968 | 302/18723 | 1.76e-06 | 2.43e-05 | 135 |
| GO:0030218113 | Thyroid | PTC | erythrocyte differentiation | 63/5968 | 120/18723 | 2.14e-06 | 2.89e-05 | 63 |
| GO:00343408 | Thyroid | PTC | response to type I interferon | 35/5968 | 58/18723 | 7.35e-06 | 8.60e-05 | 35 |
| GO:0030099113 | Thyroid | PTC | myeloid cell differentiation | 160/5968 | 381/18723 | 1.75e-05 | 1.82e-04 | 160 |
| GO:0009612110 | Thyroid | PTC | response to mechanical stimulus | 98/5968 | 216/18723 | 2.09e-05 | 2.09e-04 | 98 |
| GO:00324819 | Thyroid | PTC | positive regulation of type I interferon production | 33/5968 | 58/18723 | 7.13e-05 | 6.19e-04 | 33 |
| GO:00713577 | Thyroid | PTC | cellular response to type I interferon | 30/5968 | 52/18723 | 1.06e-04 | 8.56e-04 | 30 |
| GO:0034612111 | Thyroid | PTC | response to tumor necrosis factor | 109/5968 | 253/18723 | 1.08e-04 | 8.69e-04 | 109 |
| GO:00603377 | Thyroid | PTC | type I interferon signaling pathway | 29/5968 | 50/18723 | 1.21e-04 | 9.66e-04 | 29 |
| GO:000283114 | Thyroid | PTC | regulation of response to biotic stimulus | 136/5968 | 327/18723 | 1.22e-04 | 9.69e-04 | 136 |
| GO:004876215 | Thyroid | PTC | mesenchymal cell differentiation | 99/5968 | 236/18723 | 6.72e-04 | 4.22e-03 | 99 |
| GO:0045646111 | Thyroid | PTC | regulation of erythrocyte differentiation | 26/5968 | 47/18723 | 7.38e-04 | 4.59e-03 | 26 |
| GO:0071356111 | Thyroid | PTC | cellular response to tumor necrosis factor | 96/5968 | 229/18723 | 8.24e-04 | 5.10e-03 | 96 |
| GO:00603338 | Thyroid | PTC | interferon-gamma-mediated signaling pathway | 17/5968 | 27/18723 | 8.67e-04 | 5.30e-03 | 17 |
| GO:00324796 | Thyroid | PTC | regulation of type I interferon production | 45/5968 | 95/18723 | 1.13e-03 | 6.63e-03 | 45 |
| GO:00326066 | Thyroid | PTC | type I interferon production | 45/5968 | 95/18723 | 1.13e-03 | 6.63e-03 | 45 |
| GO:00516077 | Thyroid | PTC | defense response to virus | 108/5968 | 265/18723 | 1.34e-03 | 7.55e-03 | 108 |
| GO:01405467 | Thyroid | PTC | defense response to symbiont | 108/5968 | 265/18723 | 1.34e-03 | 7.55e-03 | 108 |
| Pathway ID | Tissue | Disease Stage | Description | Gene Ratio | Bg Ratio | pvalue | p.adjust | qvalue | Count |
| hsa0517124 | Breast | IDC | Coronavirus disease - COVID-19 | 86/867 | 232/8465 | 1.50e-28 | 9.72e-27 | 7.27e-27 | 86 |
| hsa0516922 | Breast | IDC | Epstein-Barr virus infection | 45/867 | 202/8465 | 3.16e-07 | 6.05e-06 | 4.52e-06 | 45 |
| hsa0516723 | Breast | IDC | Kaposi sarcoma-associated herpesvirus infection | 38/867 | 194/8465 | 5.87e-05 | 5.96e-04 | 4.46e-04 | 38 |
| hsa0491916 | Breast | IDC | Thyroid hormone signaling pathway | 23/867 | 121/8465 | 2.45e-03 | 1.69e-02 | 1.27e-02 | 23 |
| hsa0514012 | Breast | IDC | Leishmaniasis | 16/867 | 77/8465 | 4.35e-03 | 2.57e-02 | 1.92e-02 | 16 |
| hsa0517134 | Breast | IDC | Coronavirus disease - COVID-19 | 86/867 | 232/8465 | 1.50e-28 | 9.72e-27 | 7.27e-27 | 86 |
| hsa0516932 | Breast | IDC | Epstein-Barr virus infection | 45/867 | 202/8465 | 3.16e-07 | 6.05e-06 | 4.52e-06 | 45 |
| hsa0516733 | Breast | IDC | Kaposi sarcoma-associated herpesvirus infection | 38/867 | 194/8465 | 5.87e-05 | 5.96e-04 | 4.46e-04 | 38 |
| hsa0491917 | Breast | IDC | Thyroid hormone signaling pathway | 23/867 | 121/8465 | 2.45e-03 | 1.69e-02 | 1.27e-02 | 23 |
| hsa0514013 | Breast | IDC | Leishmaniasis | 16/867 | 77/8465 | 4.35e-03 | 2.57e-02 | 1.92e-02 | 16 |
| hsa0516941 | Breast | DCIS | Epstein-Barr virus infection | 46/846 | 202/8465 | 5.60e-08 | 1.13e-06 | 8.33e-07 | 46 |
| hsa0516743 | Breast | DCIS | Kaposi sarcoma-associated herpesvirus infection | 38/846 | 194/8465 | 3.43e-05 | 3.69e-04 | 2.72e-04 | 38 |
| hsa0491922 | Breast | DCIS | Thyroid hormone signaling pathway | 23/846 | 121/8465 | 1.78e-03 | 1.22e-02 | 9.00e-03 | 23 |
| hsa0516951 | Breast | DCIS | Epstein-Barr virus infection | 46/846 | 202/8465 | 5.60e-08 | 1.13e-06 | 8.33e-07 | 46 |
| hsa0516753 | Breast | DCIS | Kaposi sarcoma-associated herpesvirus infection | 38/846 | 194/8465 | 3.43e-05 | 3.69e-04 | 2.72e-04 | 38 |
| hsa0491932 | Breast | DCIS | Thyroid hormone signaling pathway | 23/846 | 121/8465 | 1.78e-03 | 1.22e-02 | 9.00e-03 | 23 |
| hsa0517120 | Cervix | CC | Coronavirus disease - COVID-19 | 111/1267 | 232/8465 | 1.82e-33 | 5.90e-31 | 3.49e-31 | 111 |
| hsa0516720 | Cervix | CC | Kaposi sarcoma-associated herpesvirus infection | 60/1267 | 194/8465 | 9.74e-09 | 1.58e-07 | 9.33e-08 | 60 |
| hsa0516920 | Cervix | CC | Epstein-Barr virus infection | 57/1267 | 202/8465 | 7.30e-07 | 7.39e-06 | 4.37e-06 | 57 |
| hsa0514514 | Cervix | CC | Toxoplasmosis | 34/1267 | 112/8465 | 2.42e-05 | 1.82e-04 | 1.08e-04 | 34 |
| Hugo Symbol | Variant Class | Variant Classification | dbSNP RS | HGVSc | HGVSp | HGVSp Short | SWISSPROT | BIOTYPE | SIFT | PolyPhen | Tumor Sample Barcode | Tissue | Histology | Sex | Age | Stage | Therapy Types | Drugs | Outcome |
| STAT1 | SNV | Missense_Mutation | novel | c.567N>C | p.Lys189Asn | p.K189N | P42224 | protein_coding | tolerated(0.43) | benign(0.014) | TCGA-A7-A3IZ-01 | Breast | breast invasive carcinoma | Female | <65 | I/II | Chemotherapy | cytoxan | SD |
| STAT1 | SNV | Missense_Mutation | | c.1778N>T | p.Asp593Val | p.D593V | P42224 | protein_coding | deleterious(0.03) | benign(0.392) | TCGA-D8-A1J8-01 | Breast | breast invasive carcinoma | Female | >=65 | I/II | Hormone Therapy | nolvadex | SD |
| STAT1 | SNV | Missense_Mutation | | c.1236G>C | p.Gln412His | p.Q412H | P42224 | protein_coding | deleterious(0) | probably_damaging(0.931) | TCGA-D8-A27G-01 | Breast | breast invasive carcinoma | Female | >=65 | I/II | Unknown | Unknown | SD |
| STAT1 | insertion | Nonsense_Mutation | novel | c.65_66insAGGTT | p.Tyr22Ter | p.Y22* | P42224 | protein_coding | | | TCGA-A8-A09W-01 | Breast | breast invasive carcinoma | Female | >=65 | III/IV | Unknown | Unknown | SD |
| STAT1 | insertion | Frame_Shift_Ins | novel | c.63_64insATCCCCATTTTAAAGATGAGAAAAC | p.Tyr22IlefsTer10 | p.Y22Ifs*10 | P42224 | protein_coding | | | TCGA-A8-A09W-01 | Breast | breast invasive carcinoma | Female | >=65 | III/IV | Unknown | Unknown | SD |
| STAT1 | insertion | In_Frame_Ins | novel | c.46_47insGCCTGG | p.Leu15_Glu16insGlyLeu | p.L15_E16insGL | P42224 | protein_coding | | | TCGA-BH-A0BG-01 | Breast | breast invasive carcinoma | Female | >=65 | I/II | Unknown | Unknown | SD |
| STAT1 | SNV | Missense_Mutation | novel | c.431G>T | p.Ser144Ile | p.S144I | P42224 | protein_coding | tolerated(0.18) | benign(0.021) | TCGA-2W-A8YY-01 | Cervix | cervical & endocervical cancer | Female | <65 | I/II | Chemotherapy | cisplatin | CR |
| STAT1 | SNV | Missense_Mutation | novel | c.227A>G | p.Asn76Ser | p.N76S | P42224 | protein_coding | tolerated(0.13) | benign(0.023) | TCGA-2W-A8YY-01 | Cervix | cervical & endocervical cancer | Female | <65 | I/II | Chemotherapy | cisplatin | CR |
| STAT1 | SNV | Missense_Mutation | | c.1035N>C | p.Leu345Phe | p.L345F | P42224 | protein_coding | deleterious(0.01) | possibly_damaging(0.629) | TCGA-C5-A1BI-01 | Cervix | cervical & endocervical cancer | Female | <65 | III/IV | Chemotherapy | cisplatin | SD |
| STAT1 | SNV | Missense_Mutation | | c.1945N>T | p.Arg649Cys | p.R649C | P42224 | protein_coding | deleterious(0.03) | possibly_damaging(0.48) | TCGA-C5-A1BQ-01 | Cervix | cervical & endocervical cancer | Female | >=65 | III/IV | Chemotherapy | cisplatin | CR |
| Entrez ID | Symbol | Category | Interaction Types | Drug Claim Name | Drug Name | PMIDs |
| 6772 | STAT1 | DRUGGABLE GENOME, DRUG RESISTANCE, TRANSCRIPTION FACTOR, KINASE | | AVT-02 UE | | |
| 6772 | STAT1 | DRUGGABLE GENOME, DRUG RESISTANCE, TRANSCRIPTION FACTOR, KINASE | | PMID26394986-Compound-10 | | |
| 6772 | STAT1 | DRUGGABLE GENOME, DRUG RESISTANCE, TRANSCRIPTION FACTOR, KINASE | | Peptidomimetic analog 5 | | |
| 6772 | STAT1 | DRUGGABLE GENOME, DRUG RESISTANCE, TRANSCRIPTION FACTOR, KINASE | | IPRIFLAVONE | IPRIFLAVONE | |
| 6772 | STAT1 | DRUGGABLE GENOME, DRUG RESISTANCE, TRANSCRIPTION FACTOR, KINASE | | GARCINOL | GARCINOL | |
| 6772 | STAT1 | DRUGGABLE GENOME, DRUG RESISTANCE, TRANSCRIPTION FACTOR, KINASE | | GUTTIFERONE K | GUTTIFERONE K | |
| 6772 | STAT1 | DRUGGABLE GENOME, DRUG RESISTANCE, TRANSCRIPTION FACTOR, KINASE | | Peptide analog 8 | | |
| 6772 | STAT1 | DRUGGABLE GENOME, DRUG RESISTANCE, TRANSCRIPTION FACTOR, KINASE | | Platinum IV complexe 1 | | |
| 6772 | STAT1 | DRUGGABLE GENOME, DRUG RESISTANCE, TRANSCRIPTION FACTOR, KINASE | | Oxazole derivative 1 | | |
| 6772 | STAT1 | DRUGGABLE GENOME, DRUG RESISTANCE, TRANSCRIPTION FACTOR, KINASE | | 10-METHOXYLRUTAECARPINE | CHEMBL85826 | |


