
|
|||||
|
 | |
| |
| |
| |
| |
| |
|
Gene: SMURF1 |
Gene summary for SMURF1 |
| Gene information | Species | Human | Gene symbol | SMURF1 | Gene ID | 57154 |
| Gene name | SMAD specific E3 ubiquitin protein ligase 1 | |
| Gene Alias | SMURF1 | |
| Cytomap | 7q22.1 | |
| Gene Type | protein-coding | GO ID | GO:0000045 | UniProtAcc | Q9HCE7 |
Top |
Malignant transformation analysis |
| Identification of the aberrant gene expression in precancerous and cancerous lesions by comparing the gene expression of stem-like cells in diseased tissues with normal stem cells |
| Entrez ID | Symbol | Replicates | Species | Organ | Tissue | Adj P-value | Log2FC | Malignancy |
| 57154 | SMURF1 | CCI_1 | Human | Cervix | CC | 1.15e-25 | 2.34e+00 | 0.528 |
| 57154 | SMURF1 | CCI_2 | Human | Cervix | CC | 9.47e-17 | 1.65e+00 | 0.5249 |
| 57154 | SMURF1 | CCI_3 | Human | Cervix | CC | 6.68e-29 | 1.28e+00 | 0.516 |
| 57154 | SMURF1 | CCII_1 | Human | Cervix | CC | 4.70e-06 | 3.65e-01 | 0.3249 |
| 57154 | SMURF1 | HTA11_3410_2000001011 | Human | Colorectum | AD | 8.43e-17 | -4.87e-01 | 0.0155 |
| 57154 | SMURF1 | HTA11_3361_2000001011 | Human | Colorectum | AD | 2.34e-05 | -5.38e-01 | -0.1207 |
| 57154 | SMURF1 | HTA11_866_3004761011 | Human | Colorectum | AD | 1.36e-07 | -4.89e-01 | 0.096 |
| 57154 | SMURF1 | HTA11_8622_2000001021 | Human | Colorectum | SER | 2.51e-04 | -6.88e-01 | 0.0528 |
| 57154 | SMURF1 | HTA11_7696_3000711011 | Human | Colorectum | AD | 1.18e-05 | -3.91e-01 | 0.0674 |
| 57154 | SMURF1 | HTA11_99999970781_79442 | Human | Colorectum | MSS | 8.42e-12 | -4.36e-01 | 0.294 |
| 57154 | SMURF1 | HTA11_99999974143_84620 | Human | Colorectum | MSS | 2.02e-16 | -5.63e-01 | 0.3005 |
| 57154 | SMURF1 | A001-C-207 | Human | Colorectum | FAP | 8.20e-03 | -1.87e-01 | 0.1278 |
| 57154 | SMURF1 | A015-C-203 | Human | Colorectum | FAP | 5.53e-34 | -5.54e-01 | -0.1294 |
| 57154 | SMURF1 | A015-C-204 | Human | Colorectum | FAP | 1.06e-10 | -4.90e-01 | -0.0228 |
| 57154 | SMURF1 | A014-C-040 | Human | Colorectum | FAP | 3.38e-04 | -9.03e-02 | -0.1184 |
| 57154 | SMURF1 | A002-C-201 | Human | Colorectum | FAP | 2.27e-13 | -2.83e-01 | 0.0324 |
| 57154 | SMURF1 | A002-C-203 | Human | Colorectum | FAP | 1.12e-02 | 3.30e-02 | 0.2786 |
| 57154 | SMURF1 | A001-C-119 | Human | Colorectum | FAP | 4.94e-10 | -3.95e-01 | -0.1557 |
| 57154 | SMURF1 | A001-C-108 | Human | Colorectum | FAP | 1.90e-17 | -3.73e-01 | -0.0272 |
| 57154 | SMURF1 | A002-C-205 | Human | Colorectum | FAP | 4.33e-32 | -6.29e-01 | -0.1236 |
| Page: 1 2 3 4 5 6 7 8 9 10 |
| Tissue | Expression Dynamics | Abbreviation |
| Cervix | 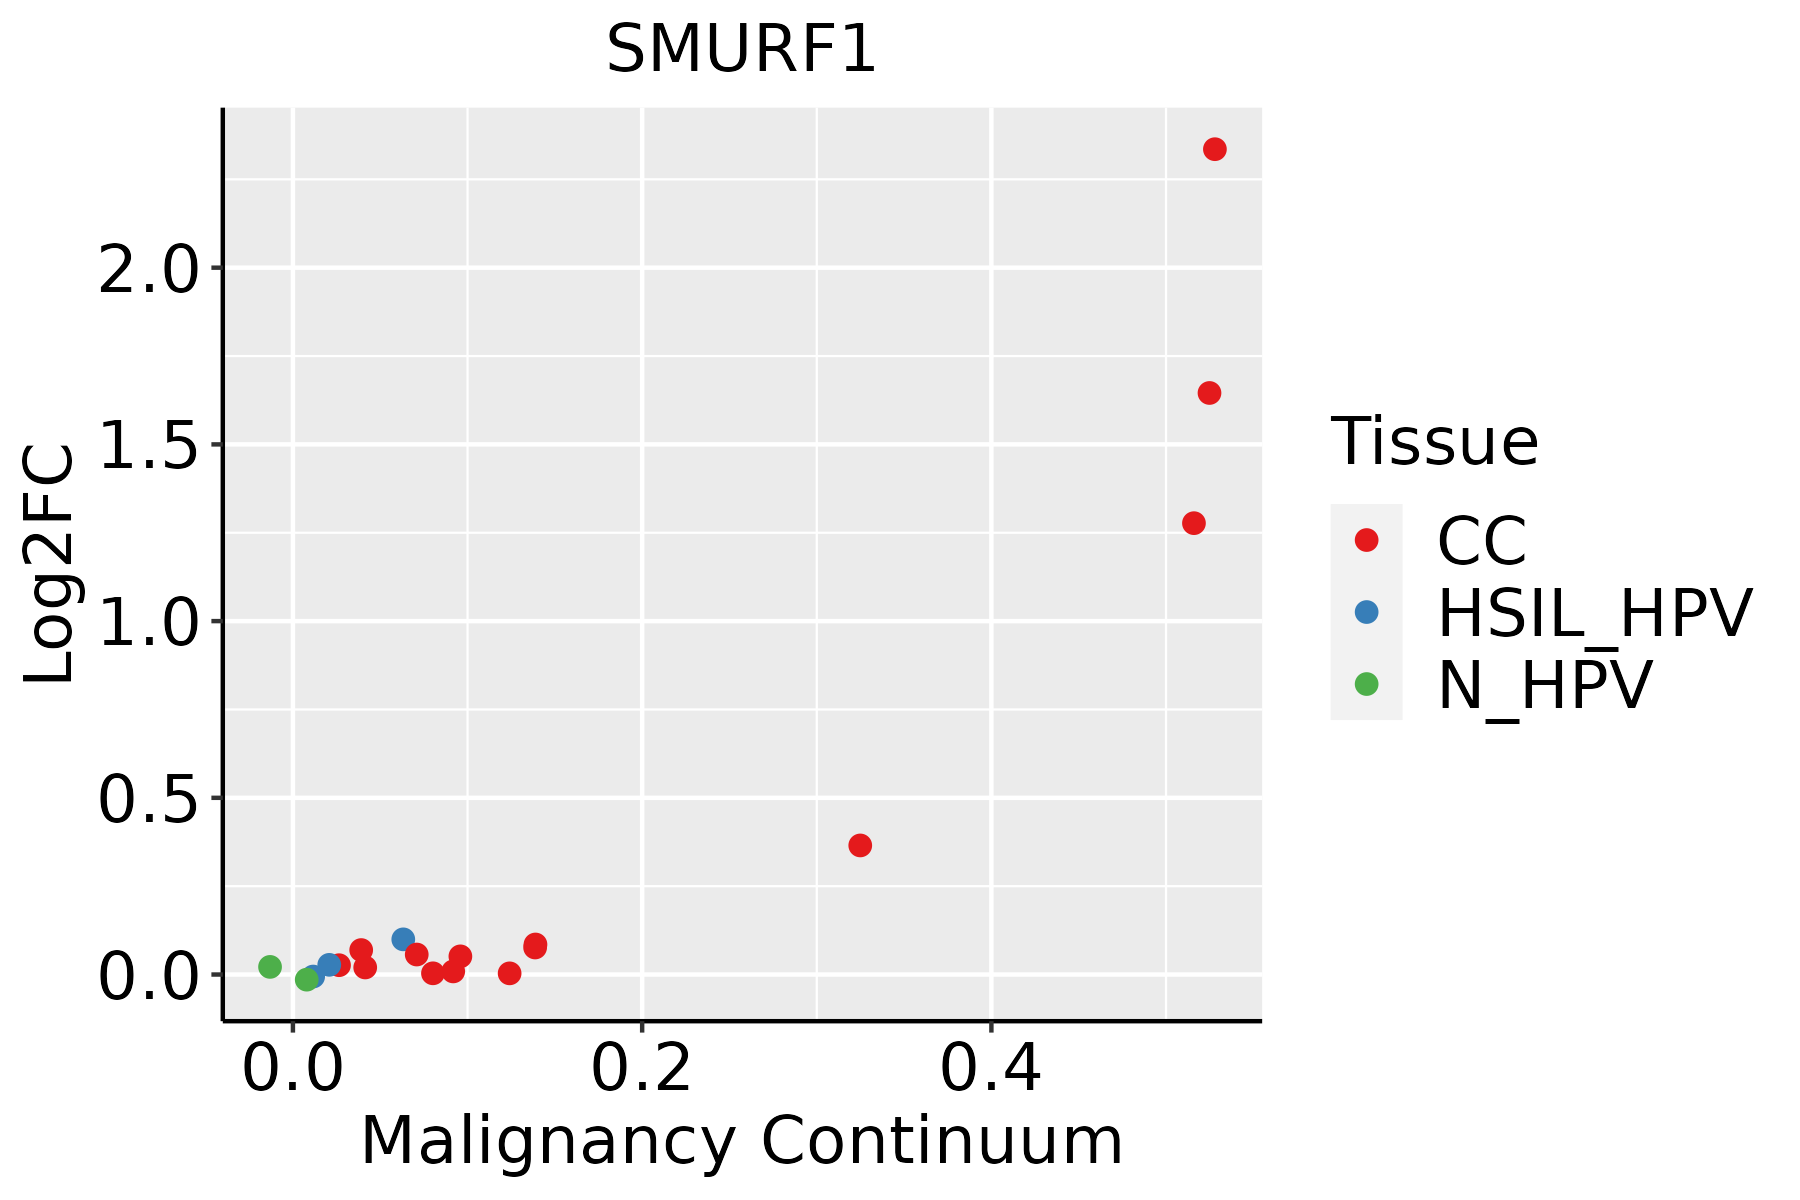 | CC: Cervix cancer |
| HSIL_HPV: HPV-infected high-grade squamous intraepithelial lesions | ||
| N_HPV: HPV-infected normal cervix | ||
| Colorectum (GSE201348) |  | FAP: Familial adenomatous polyposis |
| CRC: Colorectal cancer | ||
| Colorectum (HTA11) |  | AD: Adenomas |
| SER: Sessile serrated lesions | ||
| MSI-H: Microsatellite-high colorectal cancer | ||
| MSS: Microsatellite stable colorectal cancer | ||
| Endometrium |  | AEH: Atypical endometrial hyperplasia |
| EEC: Endometrioid Cancer | ||
| Esophagus | 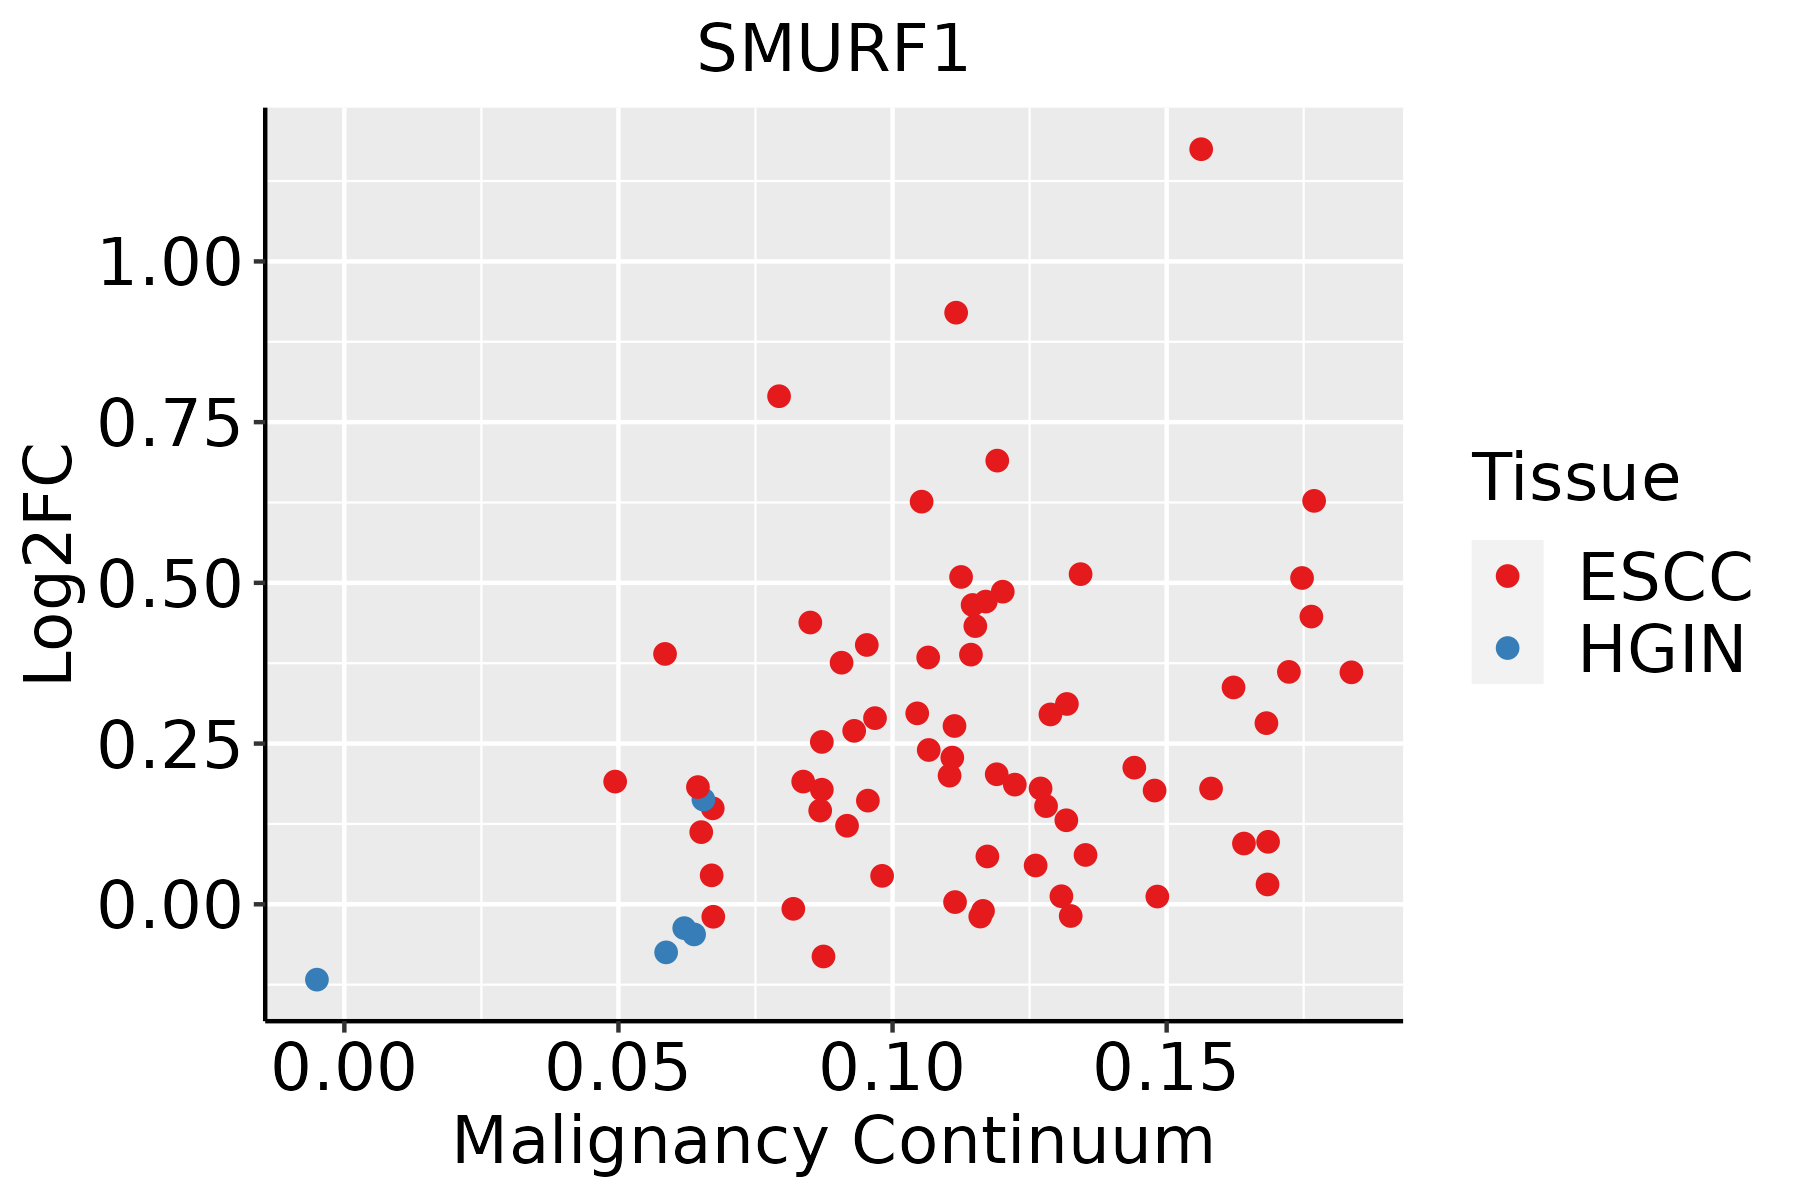 | ESCC: Esophageal squamous cell carcinoma |
| HGIN: High-grade intraepithelial neoplasias | ||
| LGIN: Low-grade intraepithelial neoplasias | ||
| Liver |  | HCC: Hepatocellular carcinoma |
| NAFLD: Non-alcoholic fatty liver disease | ||
| Lung | 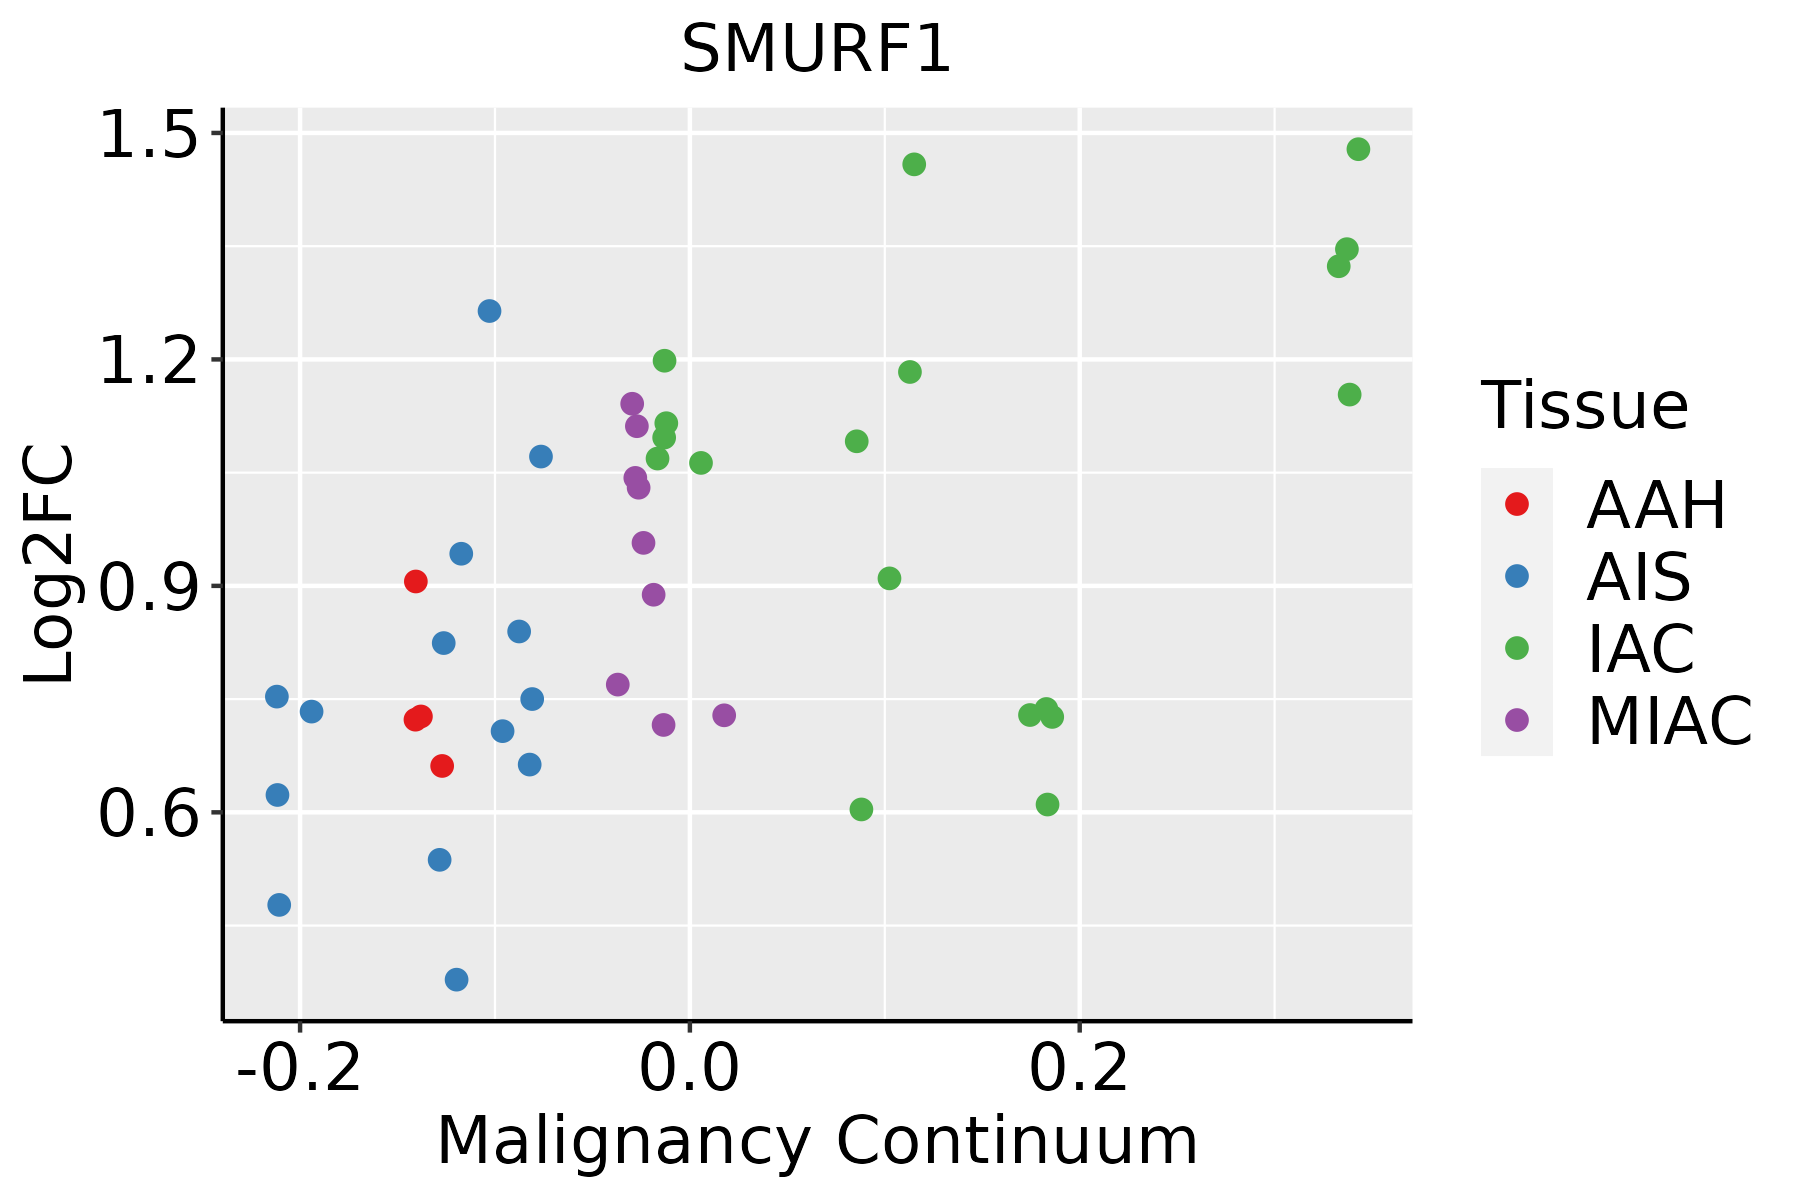 | AAH: Atypical adenomatous hyperplasia |
| AIS: Adenocarcinoma in situ | ||
| IAC: Invasive lung adenocarcinoma | ||
| MIA: Minimally invasive adenocarcinoma | ||
| Oral Cavity | 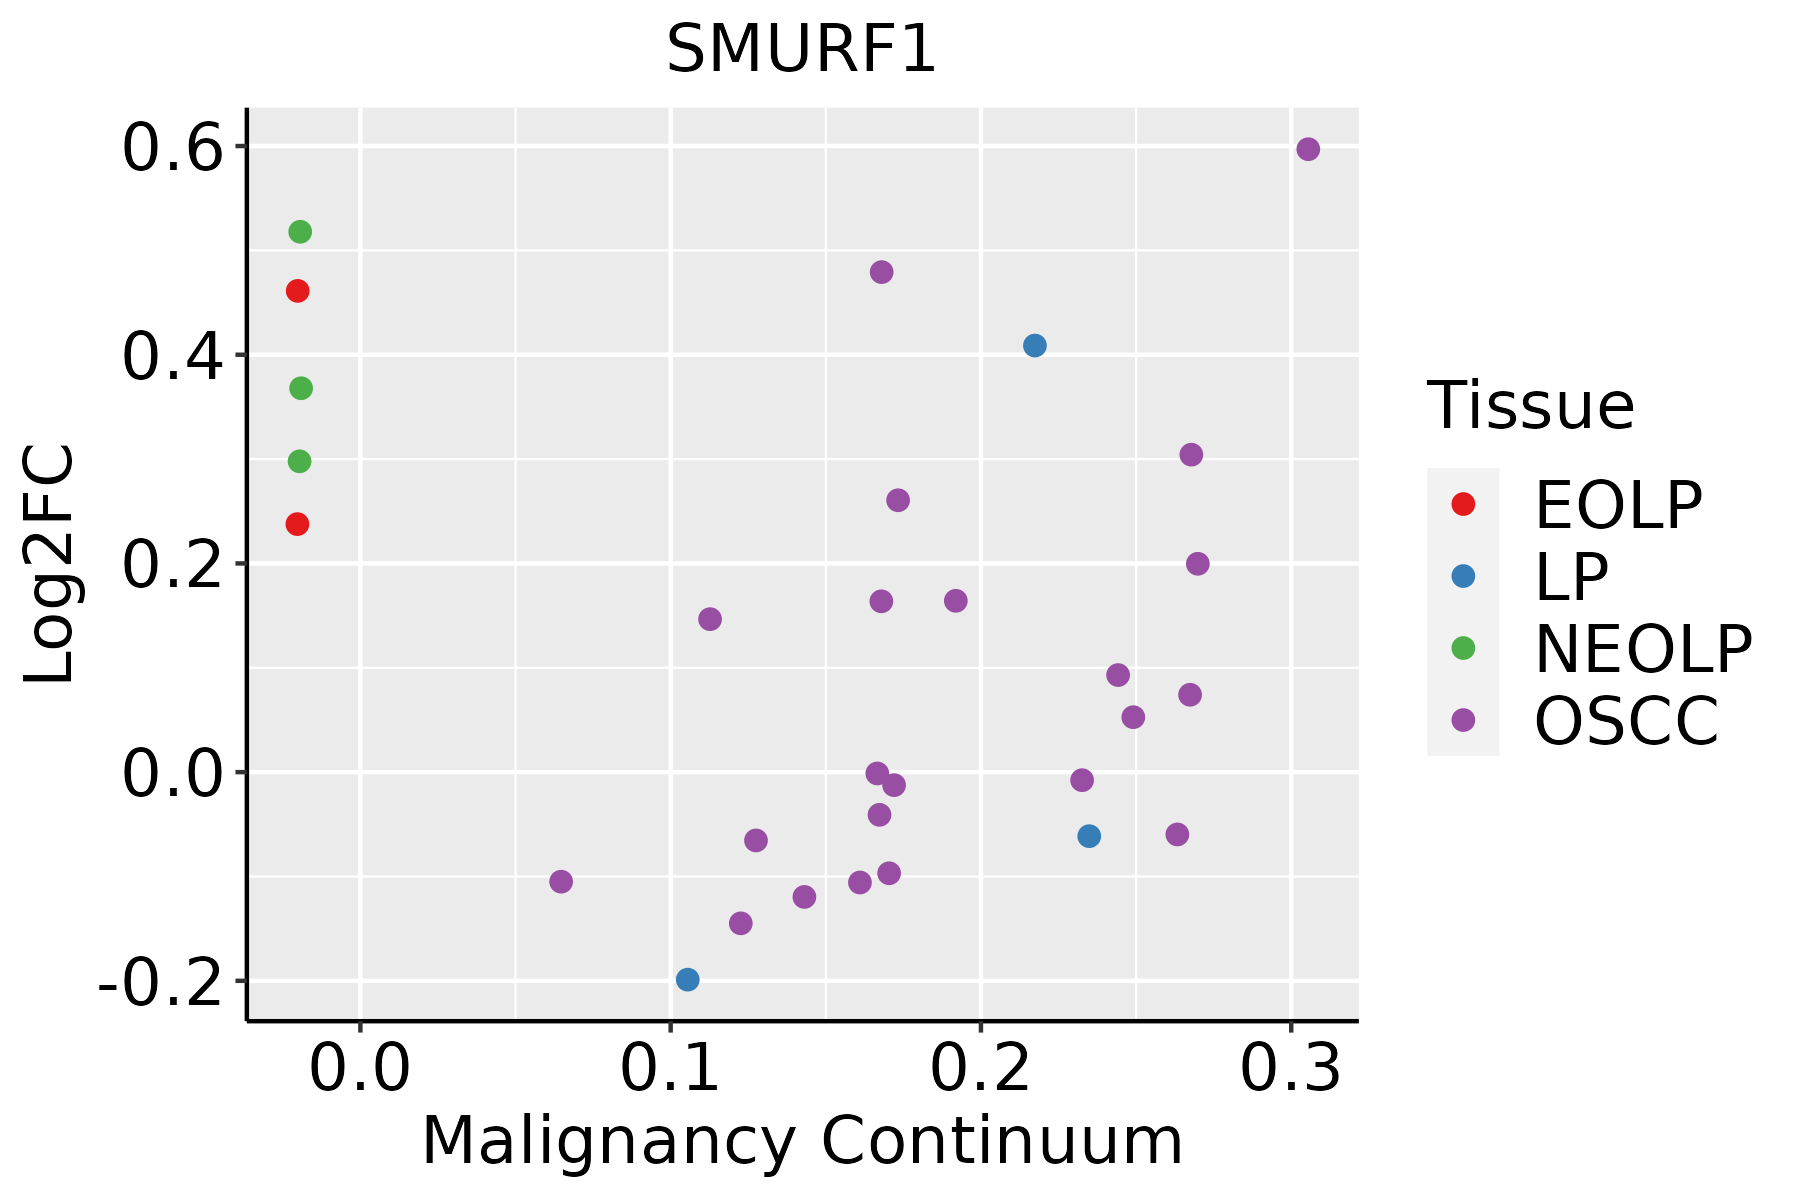 | EOLP: Erosive Oral lichen planus |
| LP: leukoplakia | ||
| NEOLP: Non-erosive oral lichen planus | ||
| OSCC: Oral squamous cell carcinoma | ||
| Prostate | 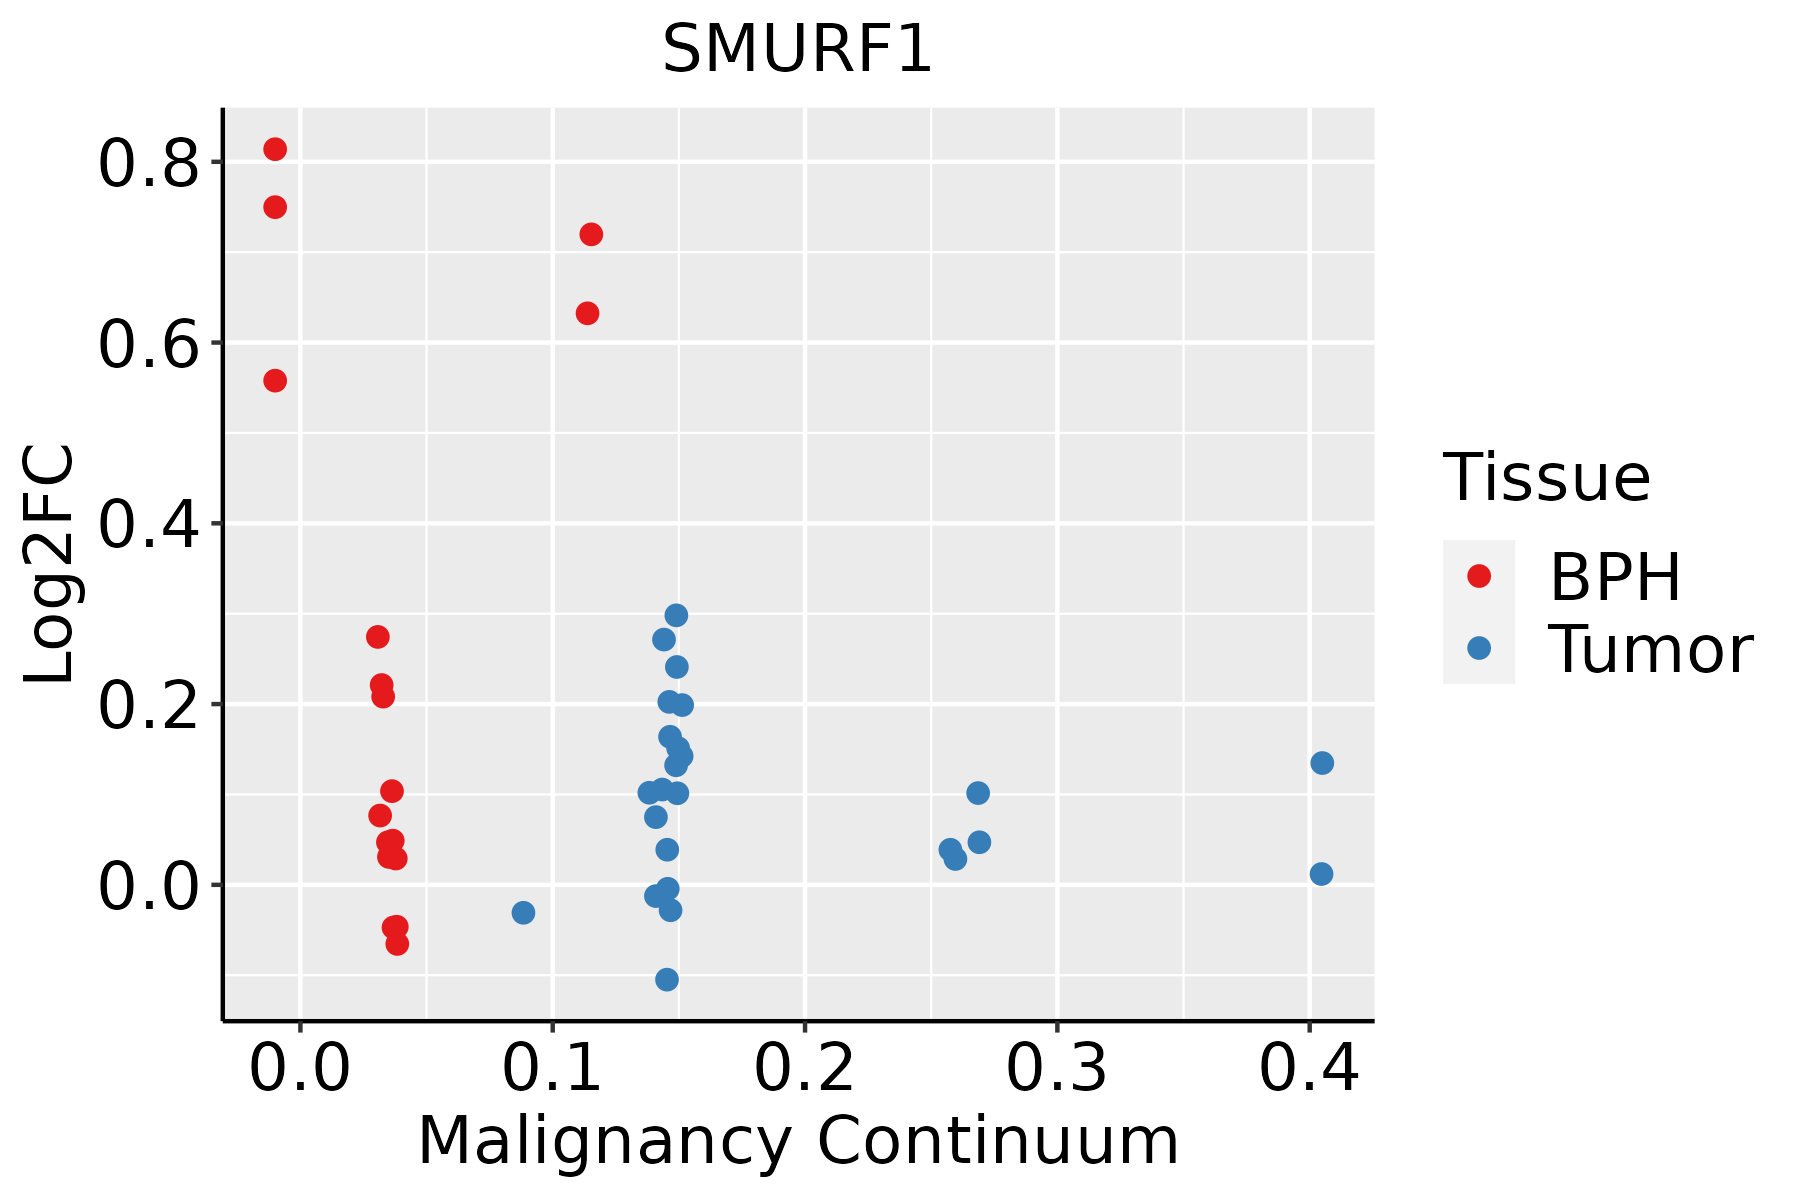 | BPH: Benign Prostatic Hyperplasia |
| Skin | 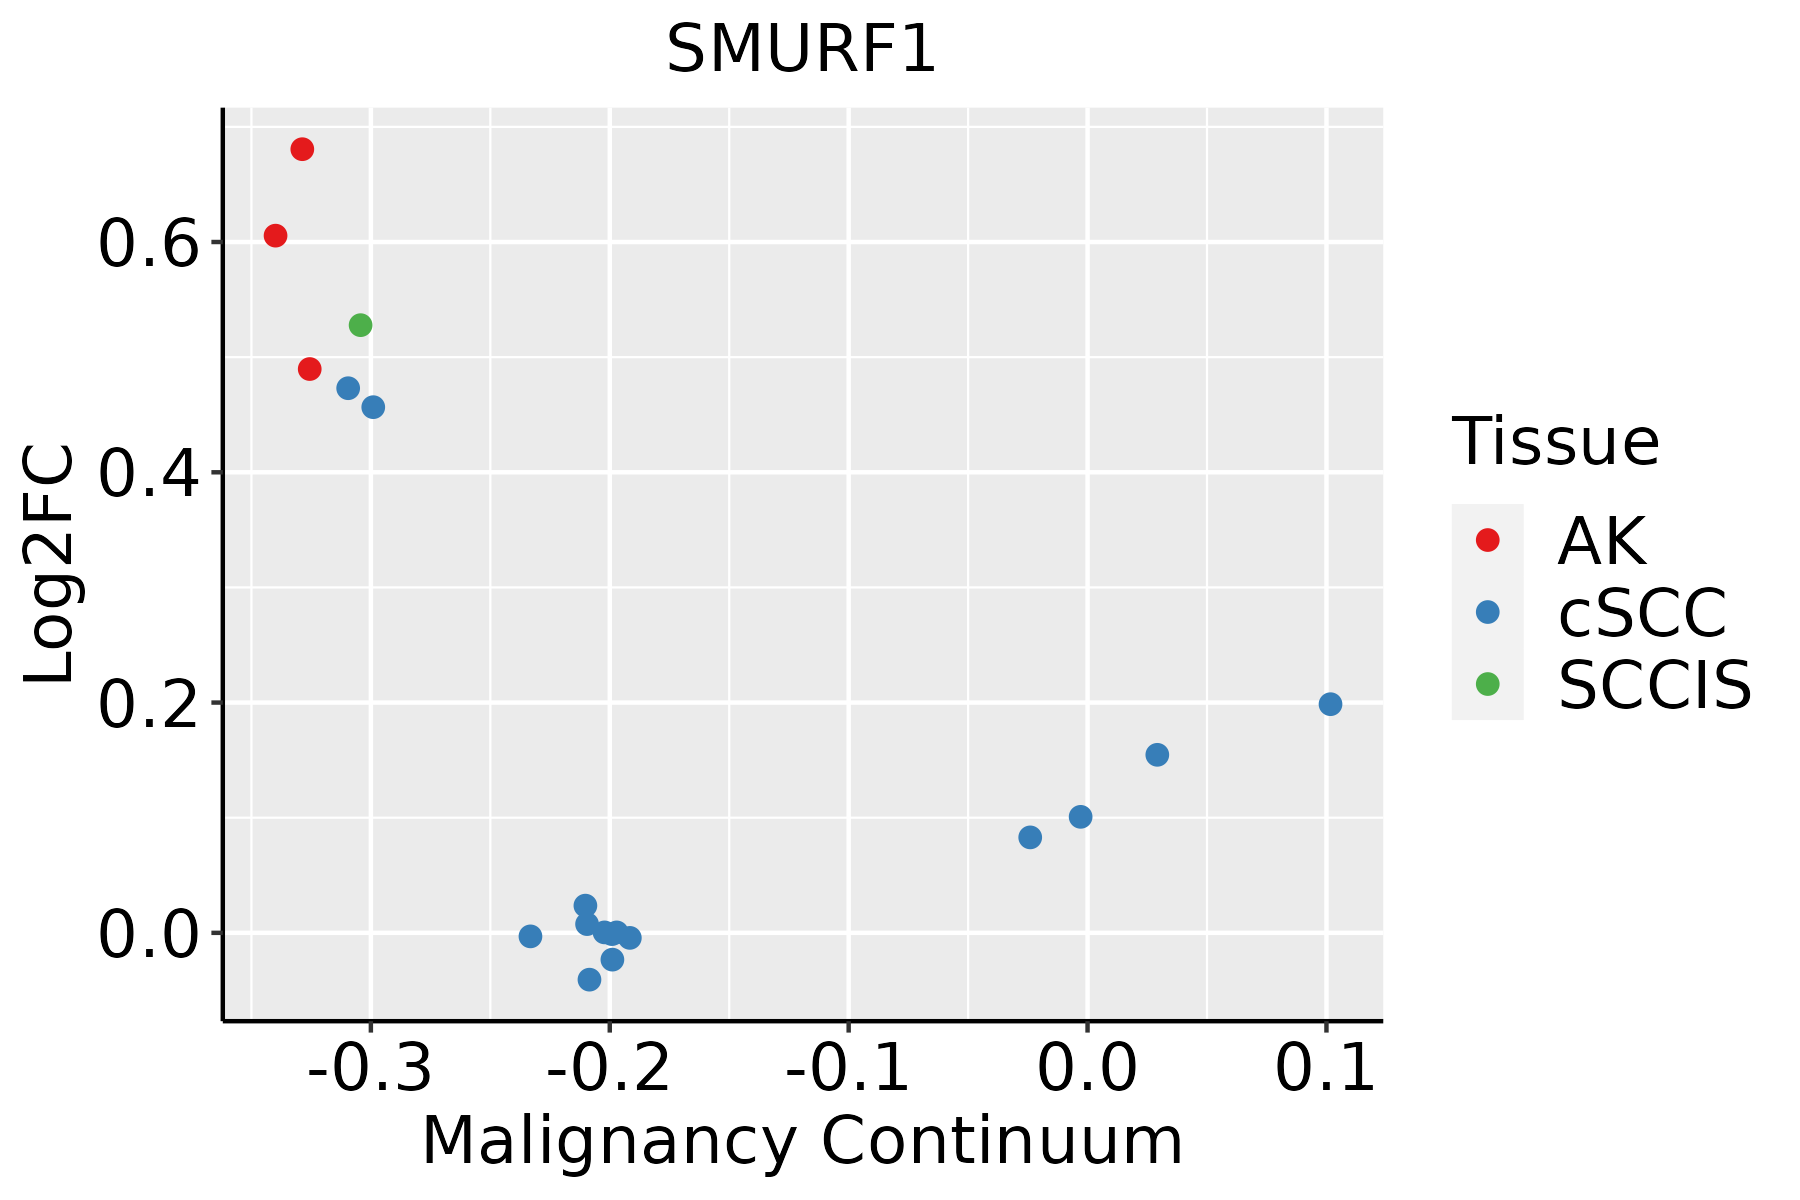 | AK: Actinic keratosis |
| cSCC: Cutaneous squamous cell carcinoma | ||
| SCCIS:squamous cell carcinoma in situ | ||
| Thyroid | 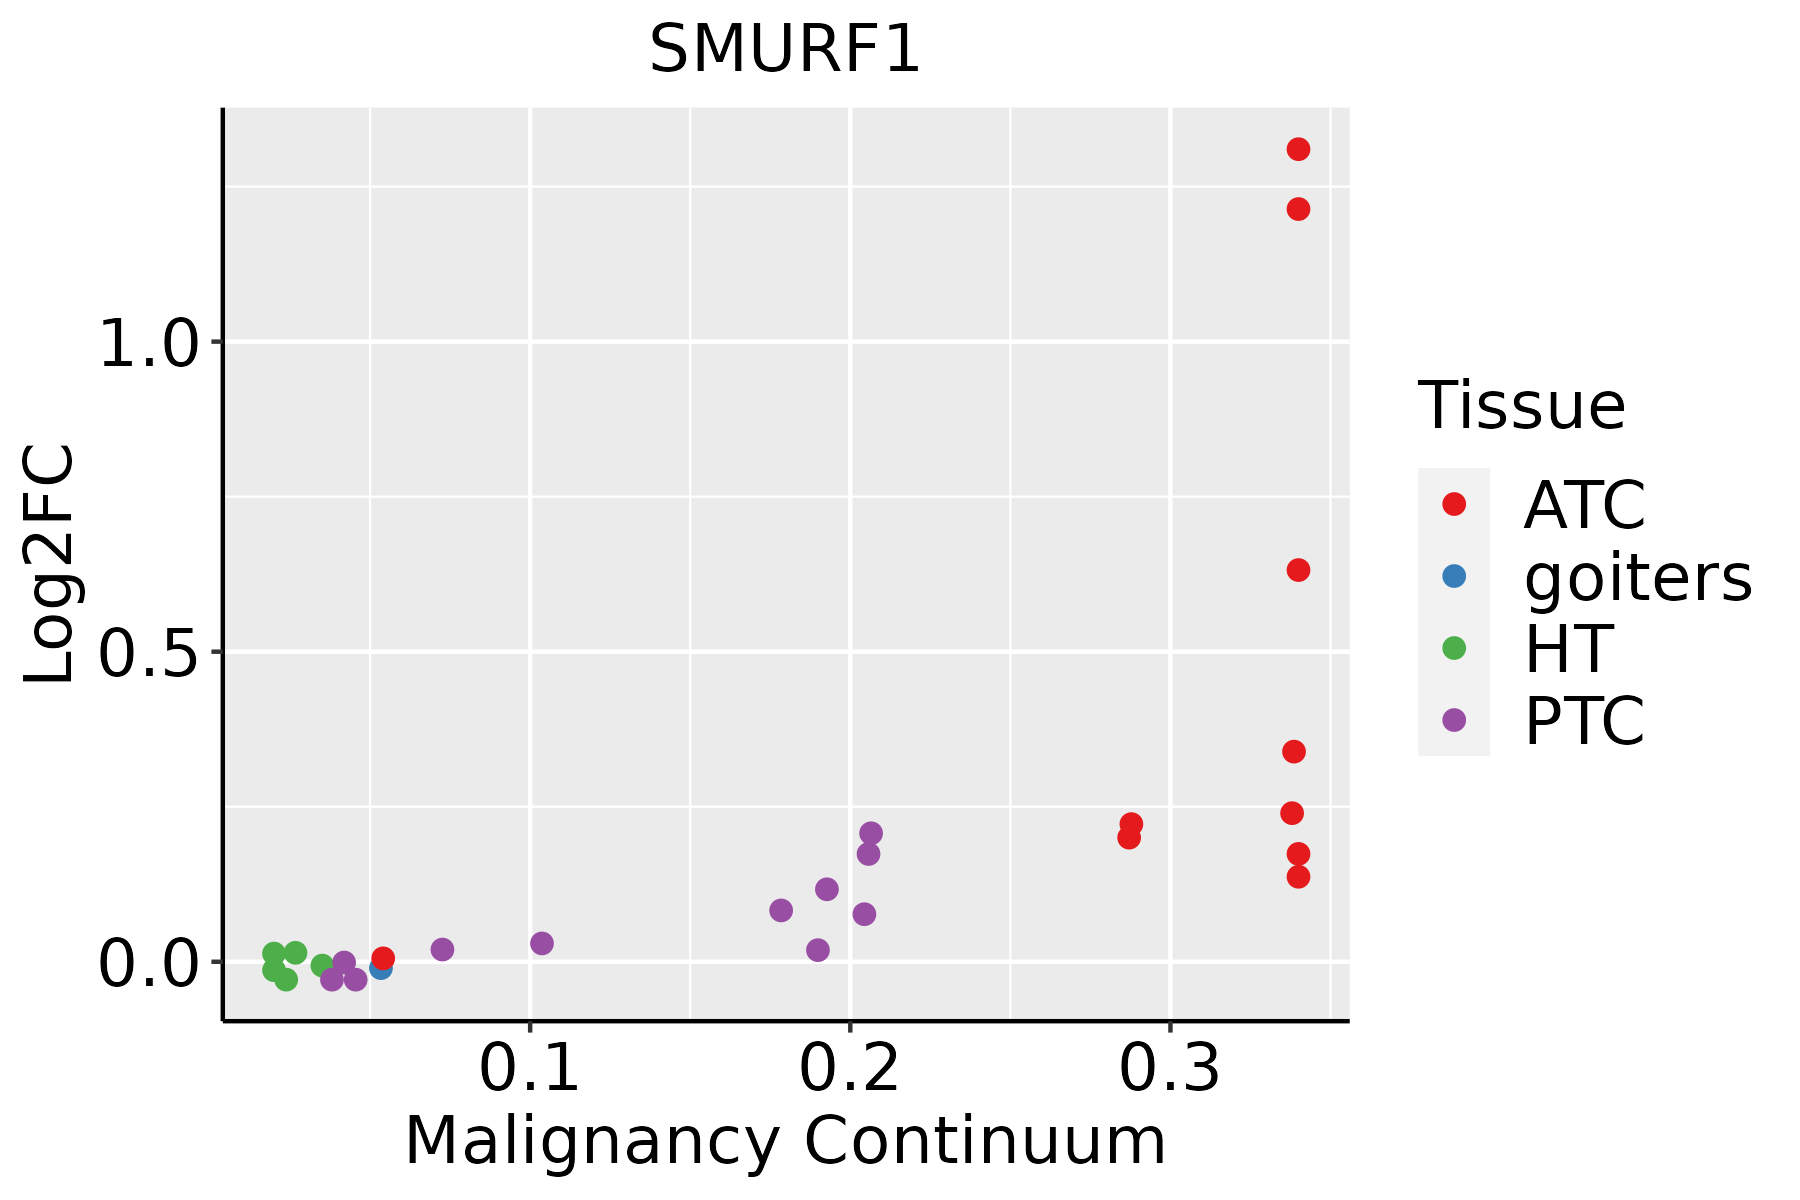 | ATC: Anaplastic thyroid cancer |
| HT: Hashimoto's thyroiditis | ||
| PTC: Papillary thyroid cancer |
| ∗log2FC in expression of this searched gene in stem-like cells from each diseased tissue sample relative to stem-like cells in normal samples in each tissue plotted against the malignancy continuum. Samples are colored based on if they are from different disease stage. |
Top |
Malignant transformation related pathway analysis |
| Find out the enriched GO biological processes and KEGG pathways involved in transition from healthy to precancer to cancer |
| Tissue | Disease Stage | Enriched GO biological Processes |
| Colorectum | AD |  |
| Colorectum | SER |  |
| Colorectum | MSS |  |
| Colorectum | MSI-H |  |
| Colorectum | FAP |  |
| ∗Top 15 enriched GO BP terms are showed in the bar plot of each disease state in each tissue. Each row represents a significant GO biological process which is colored according to the -log10(p.adjust). |
| Page: 1 2 3 4 5 6 7 8 9 |
| GO ID | Tissue | Disease Stage | Description | Gene Ratio | Bg Ratio | pvalue | p.adjust | Count |
| GO:004586228 | Skin | AK | positive regulation of proteolysis | 74/1910 | 372/18723 | 1.32e-08 | 8.20e-07 | 74 |
| GO:007259426 | Skin | AK | establishment of protein localization to organelle | 81/1910 | 422/18723 | 1.48e-08 | 9.11e-07 | 81 |
| GO:003133127 | Skin | AK | positive regulation of cellular catabolic process | 80/1910 | 427/18723 | 5.42e-08 | 2.76e-06 | 80 |
| GO:005116820 | Skin | AK | nuclear export | 39/1910 | 154/18723 | 6.00e-08 | 2.99e-06 | 39 |
| GO:007265925 | Skin | AK | protein localization to plasma membrane | 59/1910 | 284/18723 | 8.01e-08 | 3.80e-06 | 59 |
| GO:199077820 | Skin | AK | protein localization to cell periphery | 66/1910 | 333/18723 | 9.18e-08 | 4.21e-06 | 66 |
| GO:200006026 | Skin | AK | positive regulation of ubiquitin-dependent protein catabolic process | 30/1910 | 107/18723 | 1.82e-07 | 7.44e-06 | 30 |
| GO:007155910 | Skin | AK | response to transforming growth factor beta | 52/1910 | 256/18723 | 9.55e-07 | 3.09e-05 | 52 |
| GO:190305220 | Skin | AK | positive regulation of proteolysis involved in cellular protein catabolic process | 33/1910 | 133/18723 | 1.00e-06 | 3.21e-05 | 33 |
| GO:000155820 | Skin | AK | regulation of cell growth | 73/1910 | 414/18723 | 2.21e-06 | 6.27e-05 | 73 |
| GO:007156010 | Skin | AK | cellular response to transforming growth factor beta stimulus | 50/1910 | 250/18723 | 2.45e-06 | 6.76e-05 | 50 |
| GO:006056016 | Skin | AK | developmental growth involved in morphogenesis | 47/1910 | 234/18723 | 4.30e-06 | 1.05e-04 | 47 |
| GO:000661118 | Skin | AK | protein export from nucleus | 17/1910 | 57/18723 | 3.40e-05 | 5.68e-04 | 17 |
| GO:004858816 | Skin | AK | developmental cell growth | 44/1910 | 234/18723 | 4.68e-05 | 7.31e-04 | 44 |
| GO:003030716 | Skin | AK | positive regulation of cell growth | 34/1910 | 166/18723 | 5.76e-05 | 8.63e-04 | 34 |
| GO:00902873 | Skin | AK | regulation of cellular response to growth factor stimulus | 53/1910 | 304/18723 | 7.10e-05 | 1.02e-03 | 53 |
| GO:19901389 | Skin | AK | neuron projection extension | 34/1910 | 172/18723 | 1.20e-04 | 1.50e-03 | 34 |
| GO:004592718 | Skin | AK | positive regulation of growth | 46/1910 | 259/18723 | 1.33e-04 | 1.64e-03 | 46 |
| GO:00017388 | Skin | AK | morphogenesis of a polarized epithelium | 22/1910 | 94/18723 | 1.55e-04 | 1.84e-03 | 22 |
| GO:000660526 | Skin | AK | protein targeting | 53/1910 | 314/18723 | 1.67e-04 | 1.94e-03 | 53 |
| Page: 1 2 3 4 5 6 7 8 9 10 11 12 13 14 15 16 17 18 19 20 21 22 23 24 25 26 27 28 29 30 31 32 33 34 35 36 37 38 39 40 41 42 43 44 45 46 47 48 49 50 51 52 53 54 55 56 57 58 59 60 61 |
| Pathway ID | Tissue | Disease Stage | Description | Gene Ratio | Bg Ratio | pvalue | p.adjust | qvalue | Count |
| hsa0412014 | Cervix | CC | Ubiquitin mediated proteolysis | 49/1267 | 142/8465 | 4.26e-09 | 7.68e-08 | 4.54e-08 | 49 |
| hsa0452020 | Cervix | CC | Adherens junction | 33/1267 | 93/8465 | 6.99e-07 | 7.31e-06 | 4.32e-06 | 33 |
| hsa0414418 | Cervix | CC | Endocytosis | 64/1267 | 251/8465 | 6.97e-06 | 6.10e-05 | 3.61e-05 | 64 |
| hsa0412015 | Cervix | CC | Ubiquitin mediated proteolysis | 49/1267 | 142/8465 | 4.26e-09 | 7.68e-08 | 4.54e-08 | 49 |
| hsa04520110 | Cervix | CC | Adherens junction | 33/1267 | 93/8465 | 6.99e-07 | 7.31e-06 | 4.32e-06 | 33 |
| hsa0414419 | Cervix | CC | Endocytosis | 64/1267 | 251/8465 | 6.97e-06 | 6.10e-05 | 3.61e-05 | 64 |
| hsa04144 | Colorectum | AD | Endocytosis | 111/2092 | 251/8465 | 5.95e-12 | 1.42e-10 | 9.08e-11 | 111 |
| hsa04520 | Colorectum | AD | Adherens junction | 50/2092 | 93/8465 | 1.52e-09 | 2.83e-08 | 1.81e-08 | 50 |
| hsa04120 | Colorectum | AD | Ubiquitin mediated proteolysis | 58/2092 | 142/8465 | 1.46e-05 | 1.53e-04 | 9.76e-05 | 58 |
| hsa041441 | Colorectum | AD | Endocytosis | 111/2092 | 251/8465 | 5.95e-12 | 1.42e-10 | 9.08e-11 | 111 |
| hsa045201 | Colorectum | AD | Adherens junction | 50/2092 | 93/8465 | 1.52e-09 | 2.83e-08 | 1.81e-08 | 50 |
| hsa041201 | Colorectum | AD | Ubiquitin mediated proteolysis | 58/2092 | 142/8465 | 1.46e-05 | 1.53e-04 | 9.76e-05 | 58 |
| hsa041442 | Colorectum | SER | Endocytosis | 81/1580 | 251/8465 | 1.14e-07 | 2.36e-06 | 1.71e-06 | 81 |
| hsa045202 | Colorectum | SER | Adherens junction | 37/1580 | 93/8465 | 1.54e-06 | 2.35e-05 | 1.71e-05 | 37 |
| hsa041202 | Colorectum | SER | Ubiquitin mediated proteolysis | 39/1580 | 142/8465 | 6.18e-03 | 3.66e-02 | 2.66e-02 | 39 |
| hsa04350 | Colorectum | SER | TGF-beta signaling pathway | 31/1580 | 108/8465 | 7.00e-03 | 3.77e-02 | 2.74e-02 | 31 |
| hsa041443 | Colorectum | SER | Endocytosis | 81/1580 | 251/8465 | 1.14e-07 | 2.36e-06 | 1.71e-06 | 81 |
| hsa045203 | Colorectum | SER | Adherens junction | 37/1580 | 93/8465 | 1.54e-06 | 2.35e-05 | 1.71e-05 | 37 |
| hsa041203 | Colorectum | SER | Ubiquitin mediated proteolysis | 39/1580 | 142/8465 | 6.18e-03 | 3.66e-02 | 2.66e-02 | 39 |
| hsa043501 | Colorectum | SER | TGF-beta signaling pathway | 31/1580 | 108/8465 | 7.00e-03 | 3.77e-02 | 2.74e-02 | 31 |
| Page: 1 2 3 4 5 6 7 |
Top |
Cell-cell communication analysis |
| Identification of potential cell-cell interactions between two cell types and their ligand-receptor pairs for different disease states |
| Ligand | Receptor | LRpair | Pathway | Tissue | Disease Stage |
| Page: 1 |
Top |
Single-cell gene regulatory network inference analysis |
| Find out the significant the regulons (TFs) and the target genes of each regulon across cell types for different disease states |
| TF | Cell Type | Tissue | Disease Stage | Target Gene | RSS | Regulon Activity |
| ∗The dot plots of a searched regulon are shown for all cell subpopulations in each disease state of each tissue based on the regulon specific score inferred using pySCENIC and by calculating the average expression. |
| Page: 1 |
Top |
Somatic mutation of malignant transformation related genes |
| Annotation of somatic variants for genes involved in malignant transformation |
| Hugo Symbol | Variant Class | Variant Classification | dbSNP RS | HGVSc | HGVSp | HGVSp Short | SWISSPROT | BIOTYPE | SIFT | PolyPhen | Tumor Sample Barcode | Tissue | Histology | Sex | Age | Stage | Therapy Types | Drugs | Outcome |
| SMURF1 | SNV | Missense_Mutation | novel | c.1204N>A | p.Glu402Lys | p.E402K | Q9HCE7 | protein_coding | tolerated(0.6) | probably_damaging(0.979) | TCGA-A7-A4SD-01 | Breast | breast invasive carcinoma | Female | <65 | I/II | Chemotherapy | taxotere | CR |
| SMURF1 | SNV | Missense_Mutation | c.1681G>A | p.Ala561Thr | p.A561T | Q9HCE7 | protein_coding | tolerated(0.17) | possibly_damaging(0.728) | TCGA-AN-A046-01 | Breast | breast invasive carcinoma | Female | >=65 | I/II | Unknown | Unknown | SD | |
| SMURF1 | SNV | Missense_Mutation | novel | c.853N>C | p.Phe285Leu | p.F285L | Q9HCE7 | protein_coding | tolerated(0.79) | benign(0) | TCGA-C8-A274-01 | Breast | breast invasive carcinoma | Female | <65 | I/II | Hormone Therapy | tamoxiphen | SD |
| SMURF1 | insertion | Frame_Shift_Ins | novel | c.485_486insAGTGCTCTGGAAAGGAGAGCATGGGGCGAGATGGAGAAGA | p.Tyr163ValfsTer15 | p.Y163Vfs*15 | Q9HCE7 | protein_coding | TCGA-A2-A04Y-01 | Breast | breast invasive carcinoma | Female | <65 | I/II | Chemotherapy | cytoxan | SD | ||
| SMURF1 | insertion | Frame_Shift_Ins | novel | c.1452_1453insA | p.His485ThrfsTer53 | p.H485Tfs*53 | Q9HCE7 | protein_coding | TCGA-A8-A06X-01 | Breast | breast invasive carcinoma | Female | >=65 | I/II | Unknown | Unknown | SD | ||
| SMURF1 | insertion | Frame_Shift_Ins | novel | c.1451_1452insGTCGGGGCTCCTGGTTGTGTCCCATGTGT | p.Asp484GlufsTer70 | p.D484Efs*70 | Q9HCE7 | protein_coding | TCGA-A8-A06X-01 | Breast | breast invasive carcinoma | Female | >=65 | I/II | Unknown | Unknown | SD | ||
| SMURF1 | deletion | Frame_Shift_Del | novel | c.1077delN | p.Ser360ValfsTer19 | p.S360Vfs*19 | Q9HCE7 | protein_coding | TCGA-D8-A27V-01 | Breast | breast invasive carcinoma | Female | <65 | I/II | Hormone Therapy | tamoxiphen | SD | ||
| SMURF1 | SNV | Missense_Mutation | novel | c.1280G>A | p.Arg427Gln | p.R427Q | Q9HCE7 | protein_coding | deleterious(0) | probably_damaging(0.917) | TCGA-2W-A8YY-01 | Cervix | cervical & endocervical cancer | Female | <65 | I/II | Chemotherapy | cisplatin | CR |
| SMURF1 | SNV | Missense_Mutation | novel | c.1400C>T | p.Thr467Met | p.T467M | Q9HCE7 | protein_coding | deleterious(0.02) | probably_damaging(0.909) | TCGA-C5-A7UI-01 | Cervix | cervical & endocervical cancer | Female | <65 | I/II | Unknown | Unknown | SD |
| SMURF1 | SNV | Missense_Mutation | novel | c.85N>C | p.Asp29His | p.D29H | Q9HCE7 | protein_coding | deleterious(0) | probably_damaging(0.991) | TCGA-VS-A8QM-01 | Cervix | cervical & endocervical cancer | Female | <65 | I/II | Chemotherapy | cisplatin | PD |
| Page: 1 2 3 4 5 6 7 8 9 10 |
Top |
Related drugs of malignant transformation related genes |
| Identification of chemicals and drugs interact with genes involved in malignant transfromation |
| (DGIdb 4.0) |
| Entrez ID | Symbol | Category | Interaction Types | Drug Claim Name | Drug Name | PMIDs |
| Page: 1 |

Copyright 2023-Present -The University of Texas Health Science Center at Houston |