| Tissue | Expression Dynamics | Abbreviation |
| Breast | 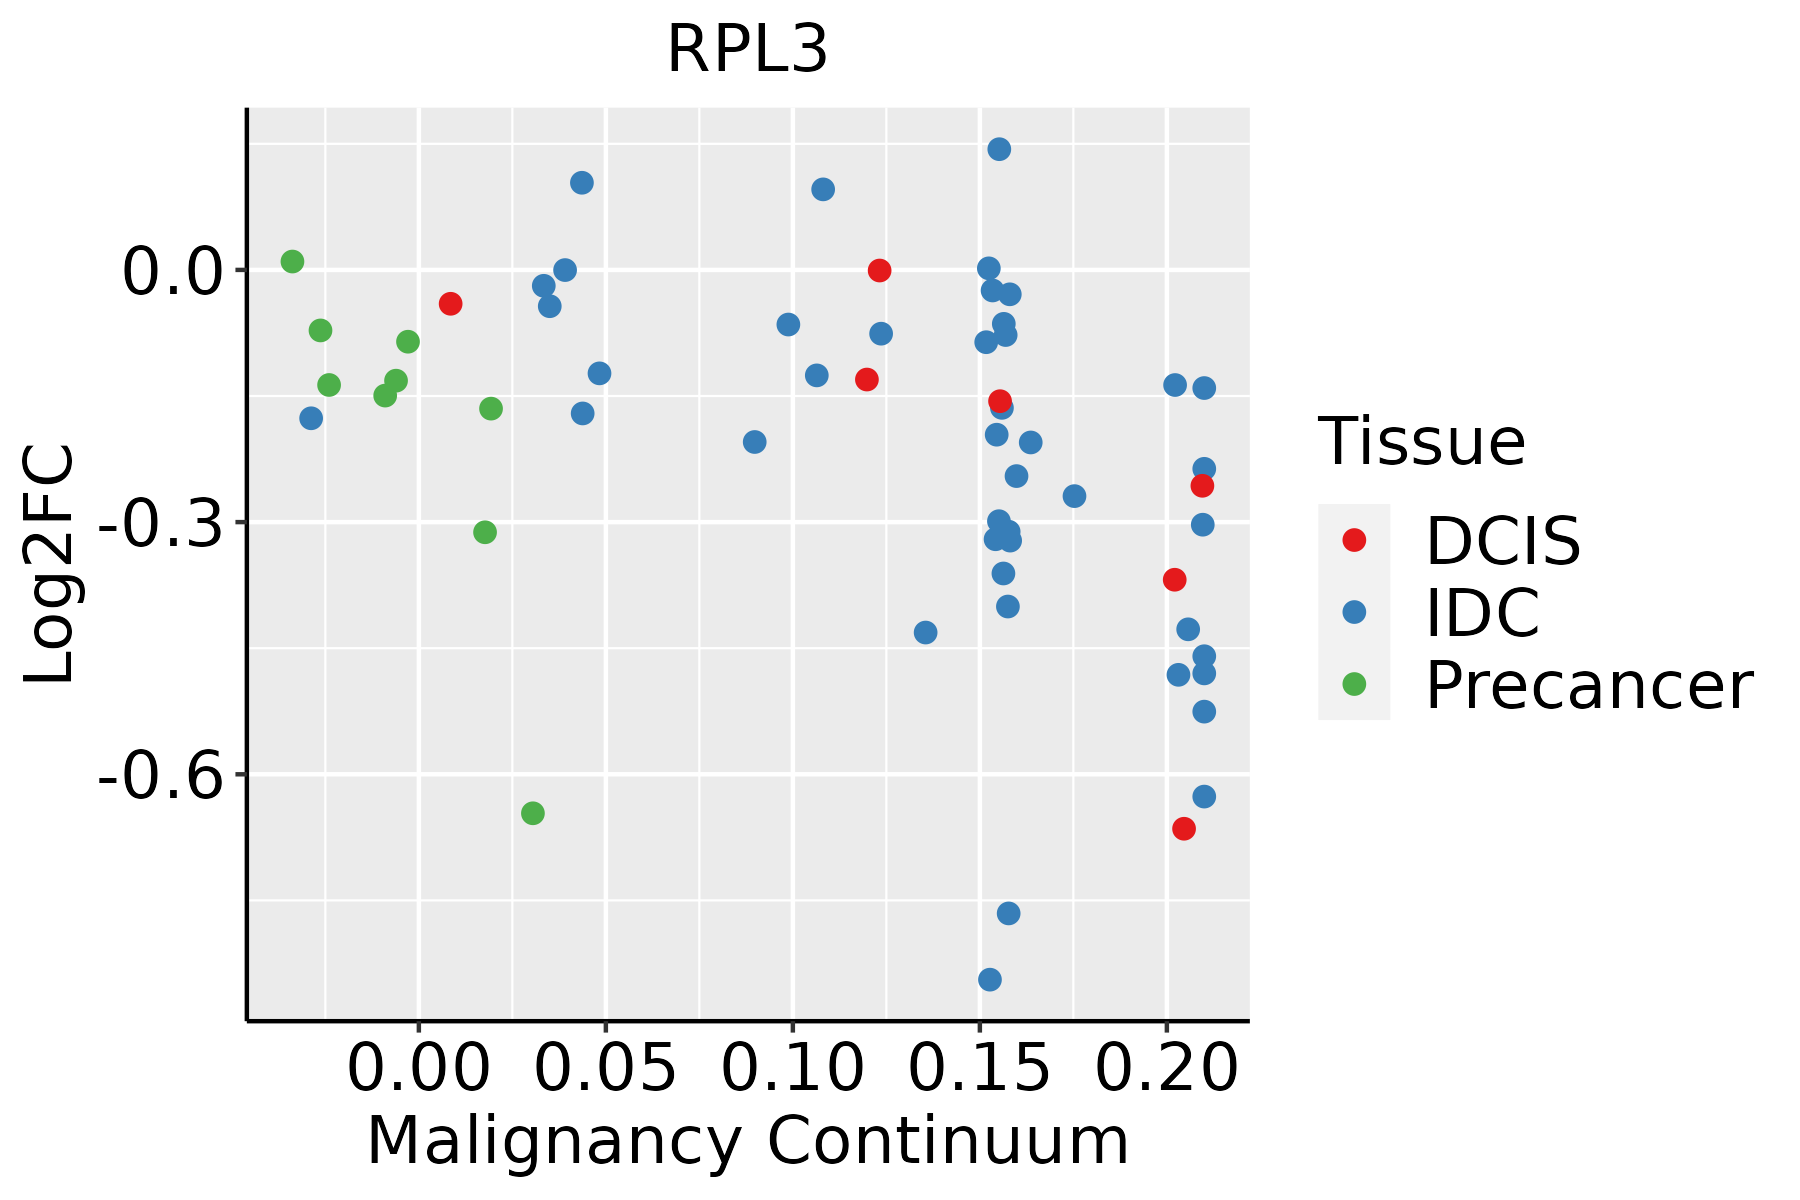 | IDC: Invasive ductal carcinoma |
| DCIS: Ductal carcinoma in situ |
| Precancer(BRCA1-mut): Precancerous lesion from BRCA1 mutation carriers |
| Cervix | 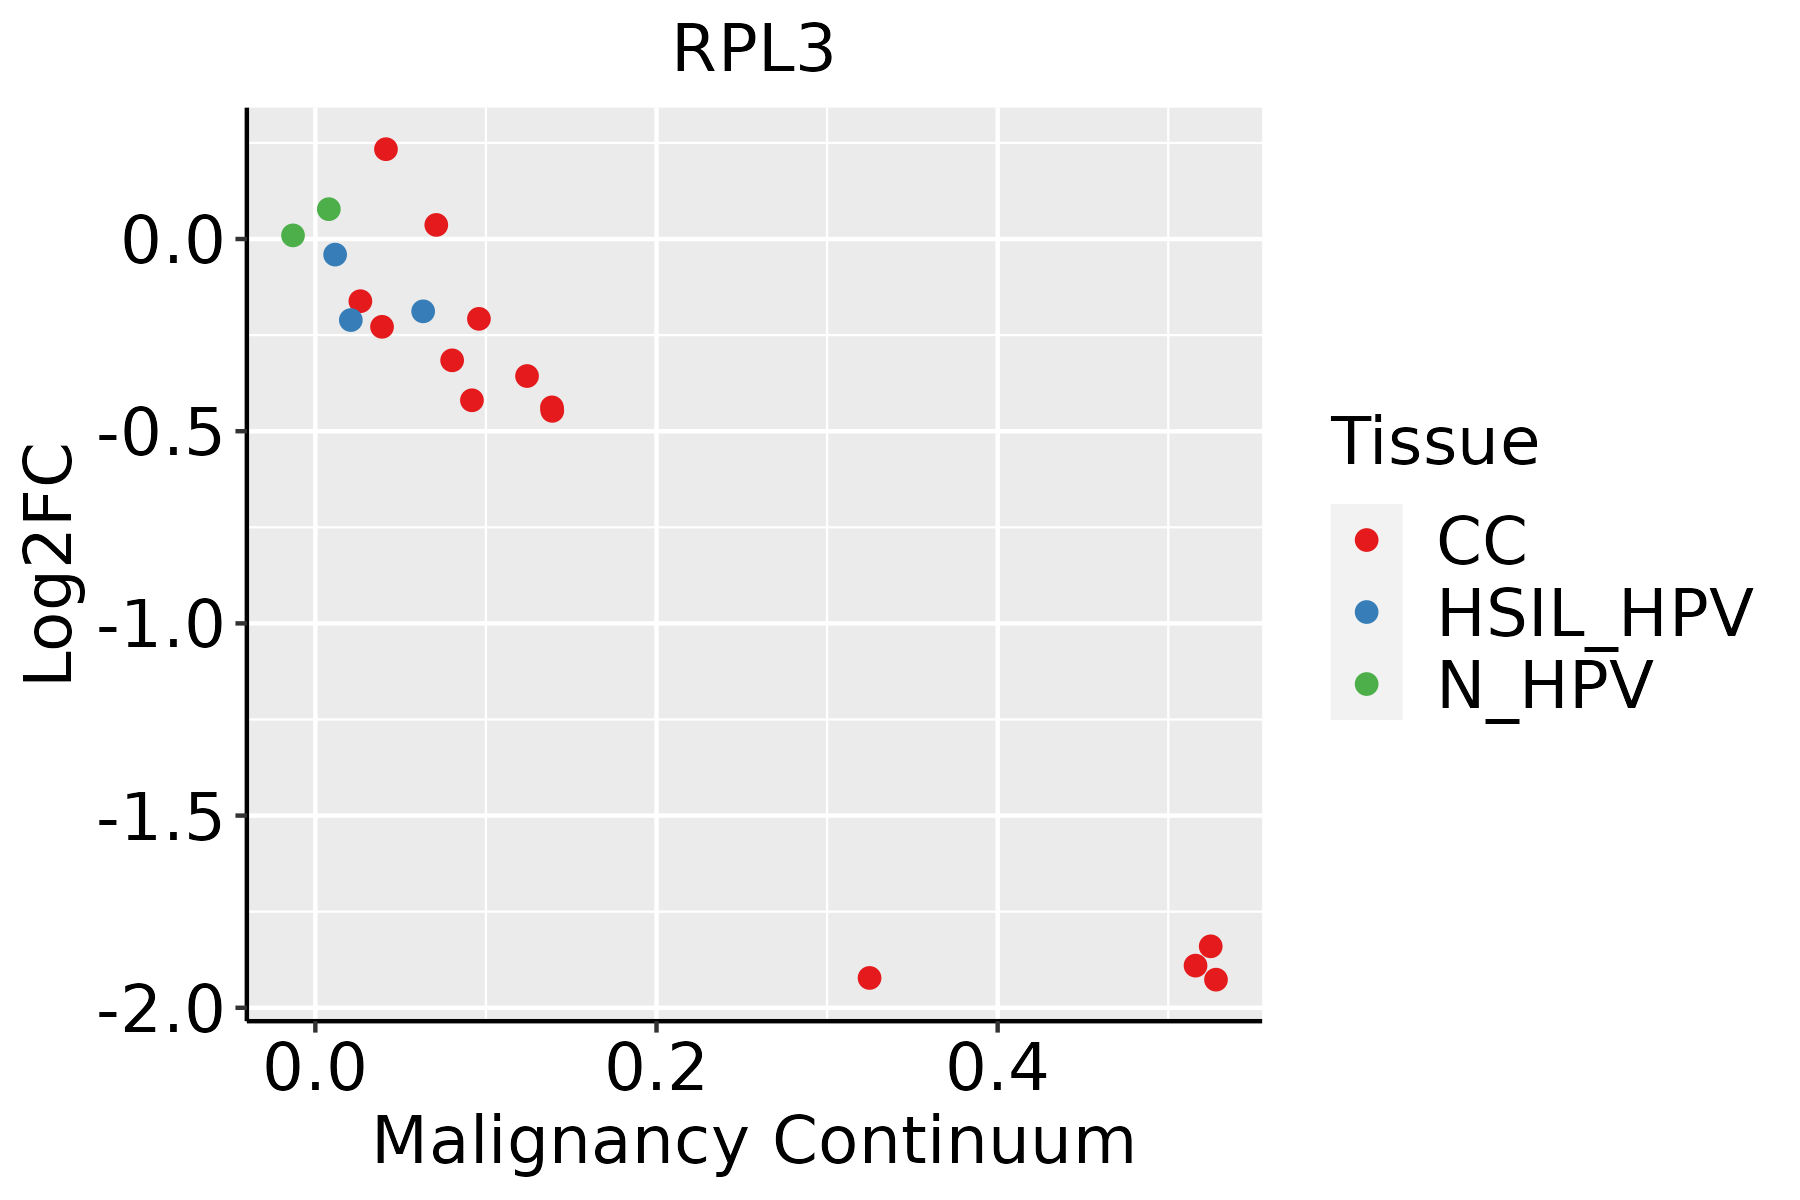 | CC: Cervix cancer |
| HSIL_HPV: HPV-infected high-grade squamous intraepithelial lesions |
| N_HPV: HPV-infected normal cervix |
| Colorectum (GSE201348) | 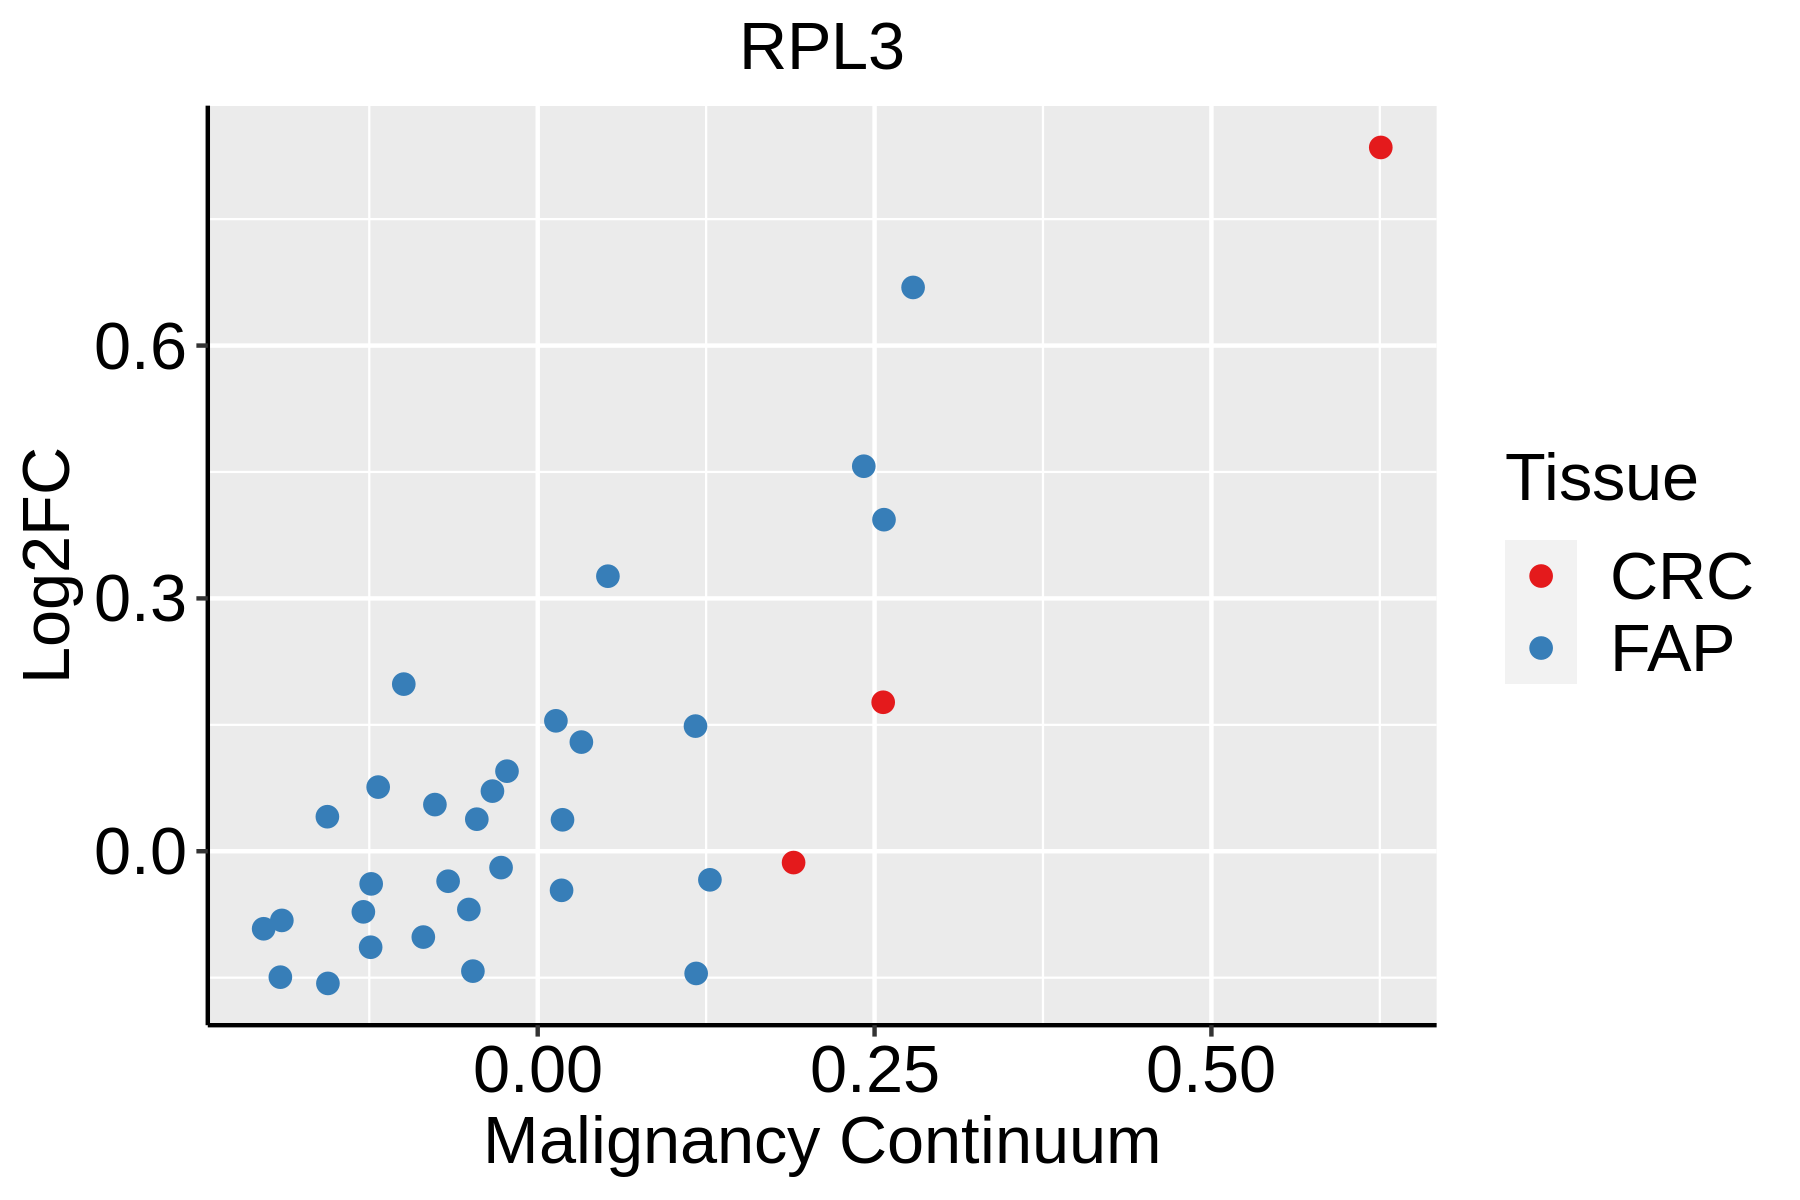 | FAP: Familial adenomatous polyposis |
| CRC: Colorectal cancer |
| Colorectum (HTA11) |  | AD: Adenomas |
| SER: Sessile serrated lesions |
| MSI-H: Microsatellite-high colorectal cancer |
| MSS: Microsatellite stable colorectal cancer |
| Endometrium | 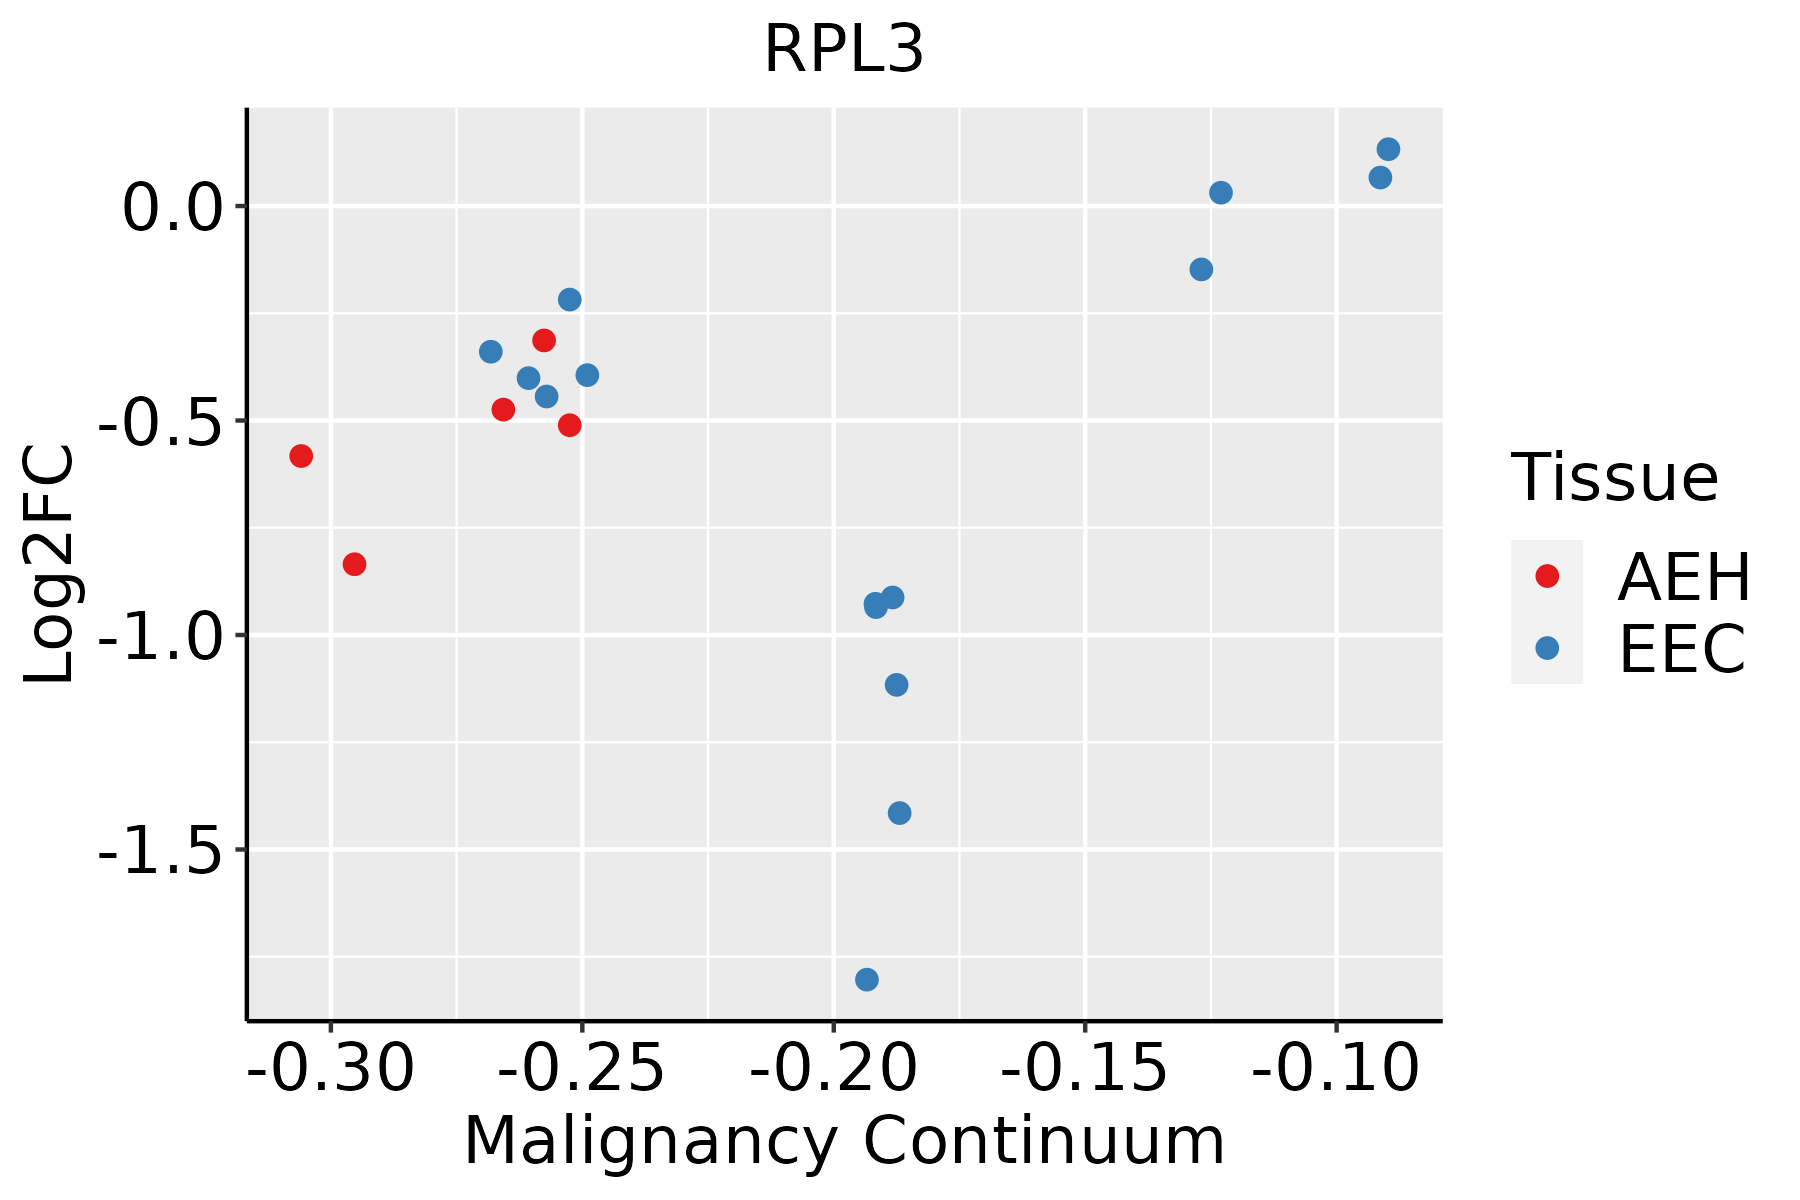 | AEH: Atypical endometrial hyperplasia |
| EEC: Endometrioid Cancer |
| Esophagus | 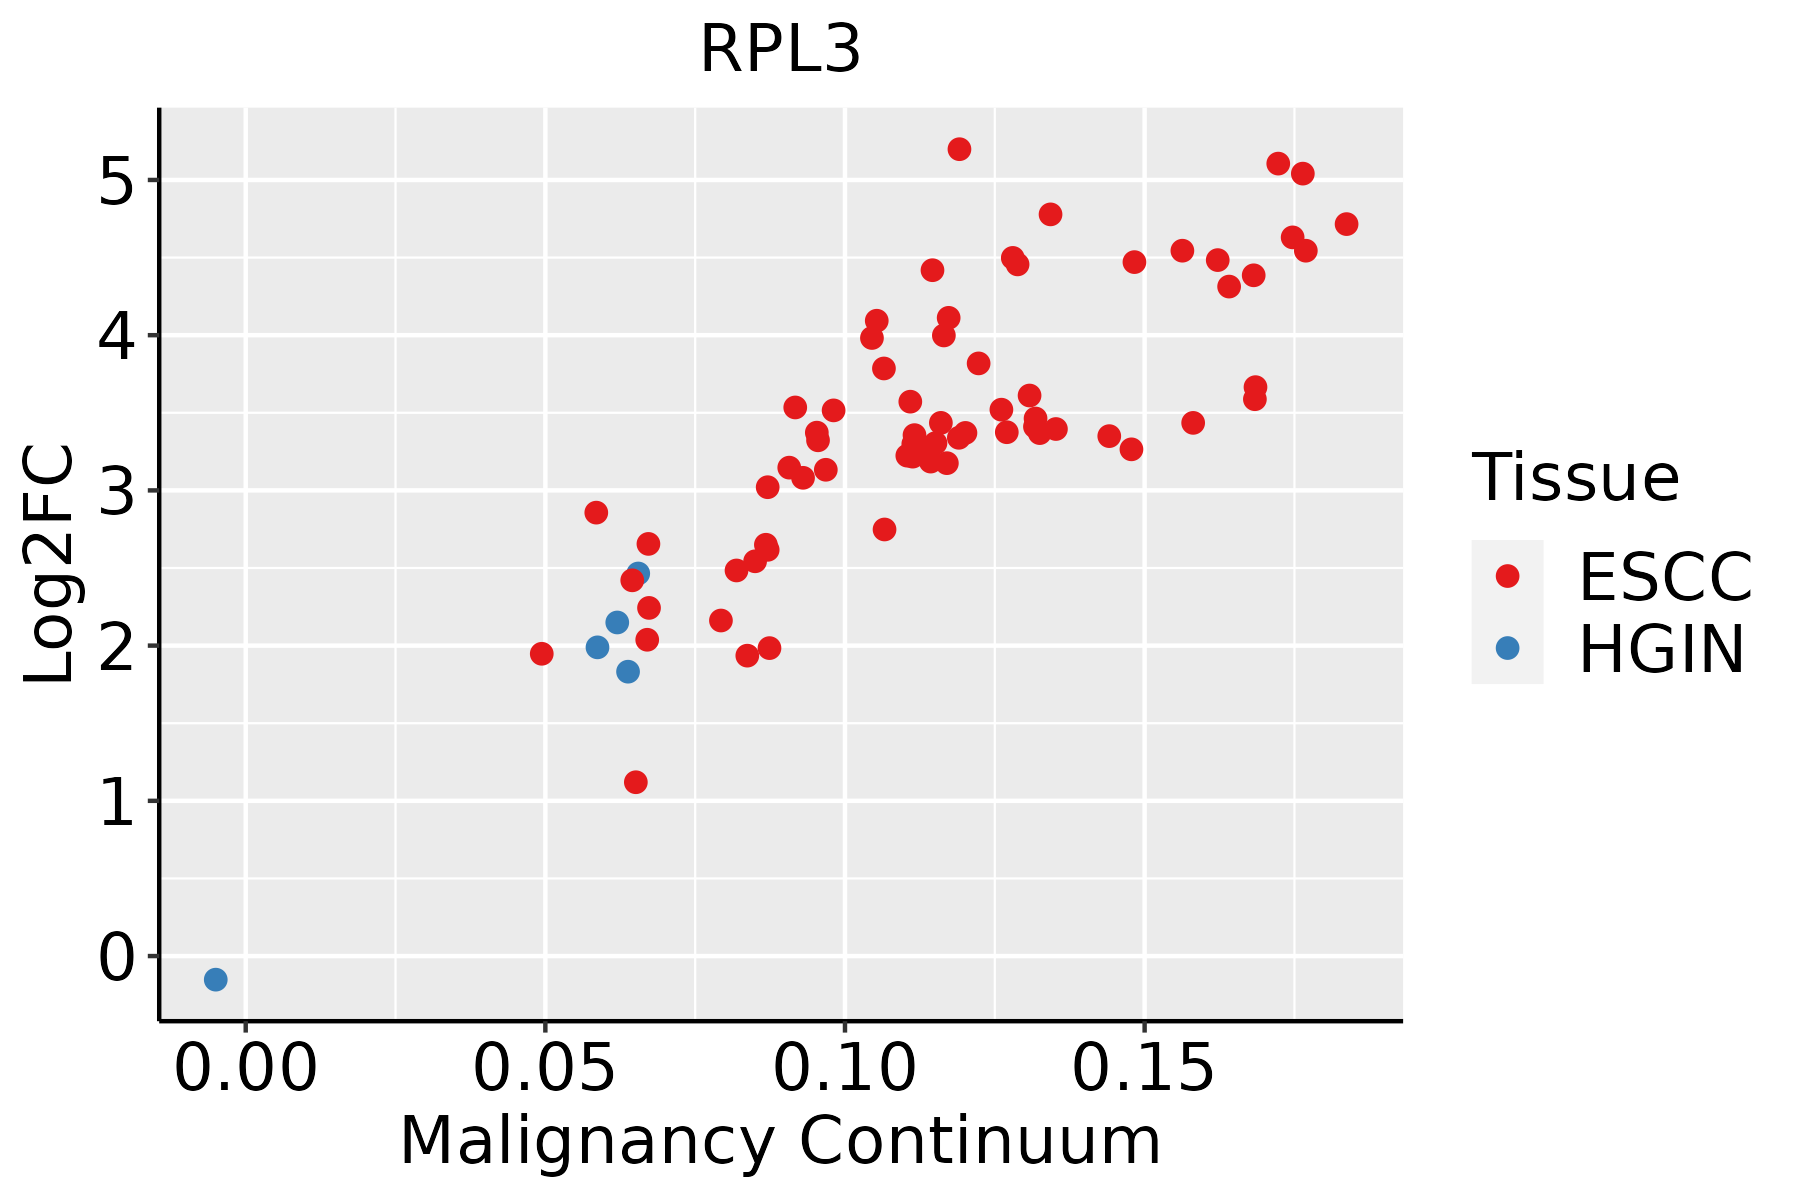 | ESCC: Esophageal squamous cell carcinoma |
| HGIN: High-grade intraepithelial neoplasias |
| LGIN: Low-grade intraepithelial neoplasias |
| Liver | 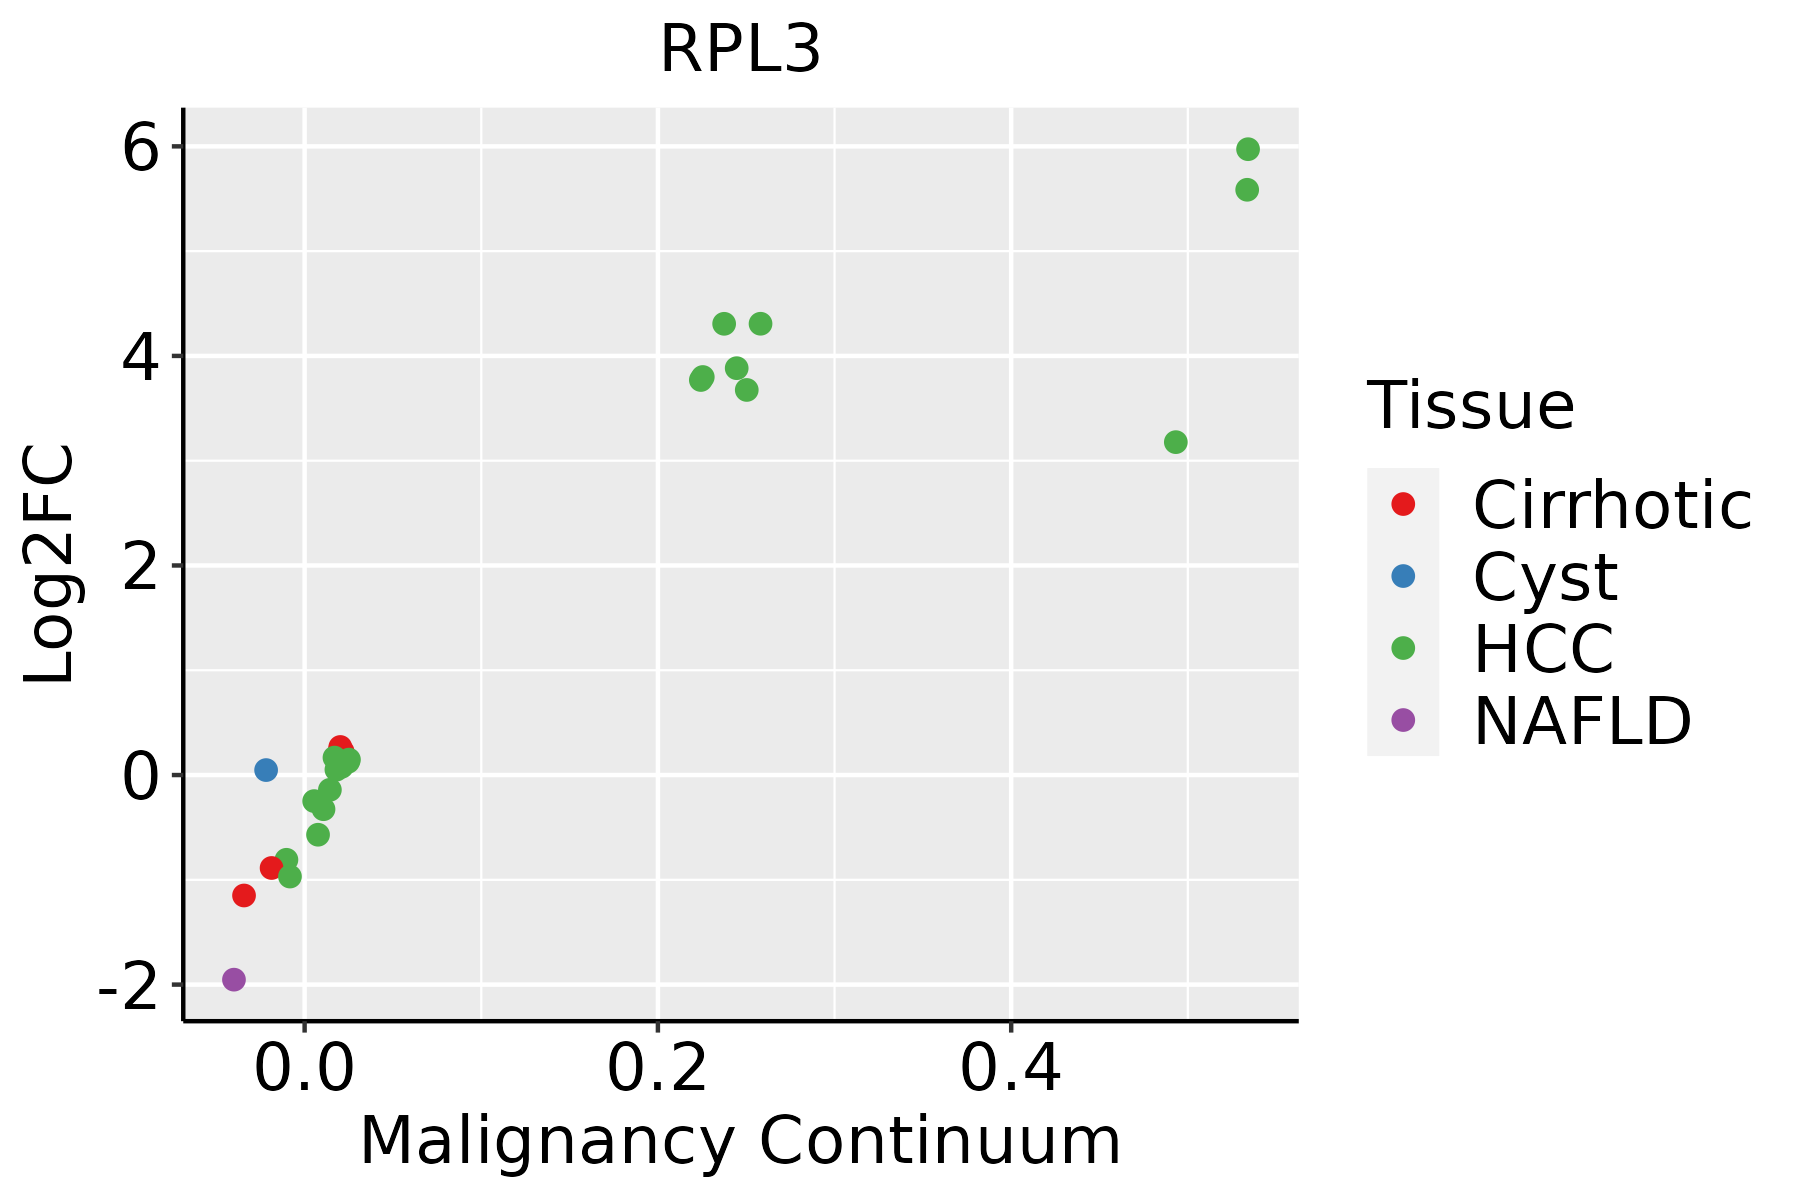 | HCC: Hepatocellular carcinoma |
| NAFLD: Non-alcoholic fatty liver disease |
| Lung | 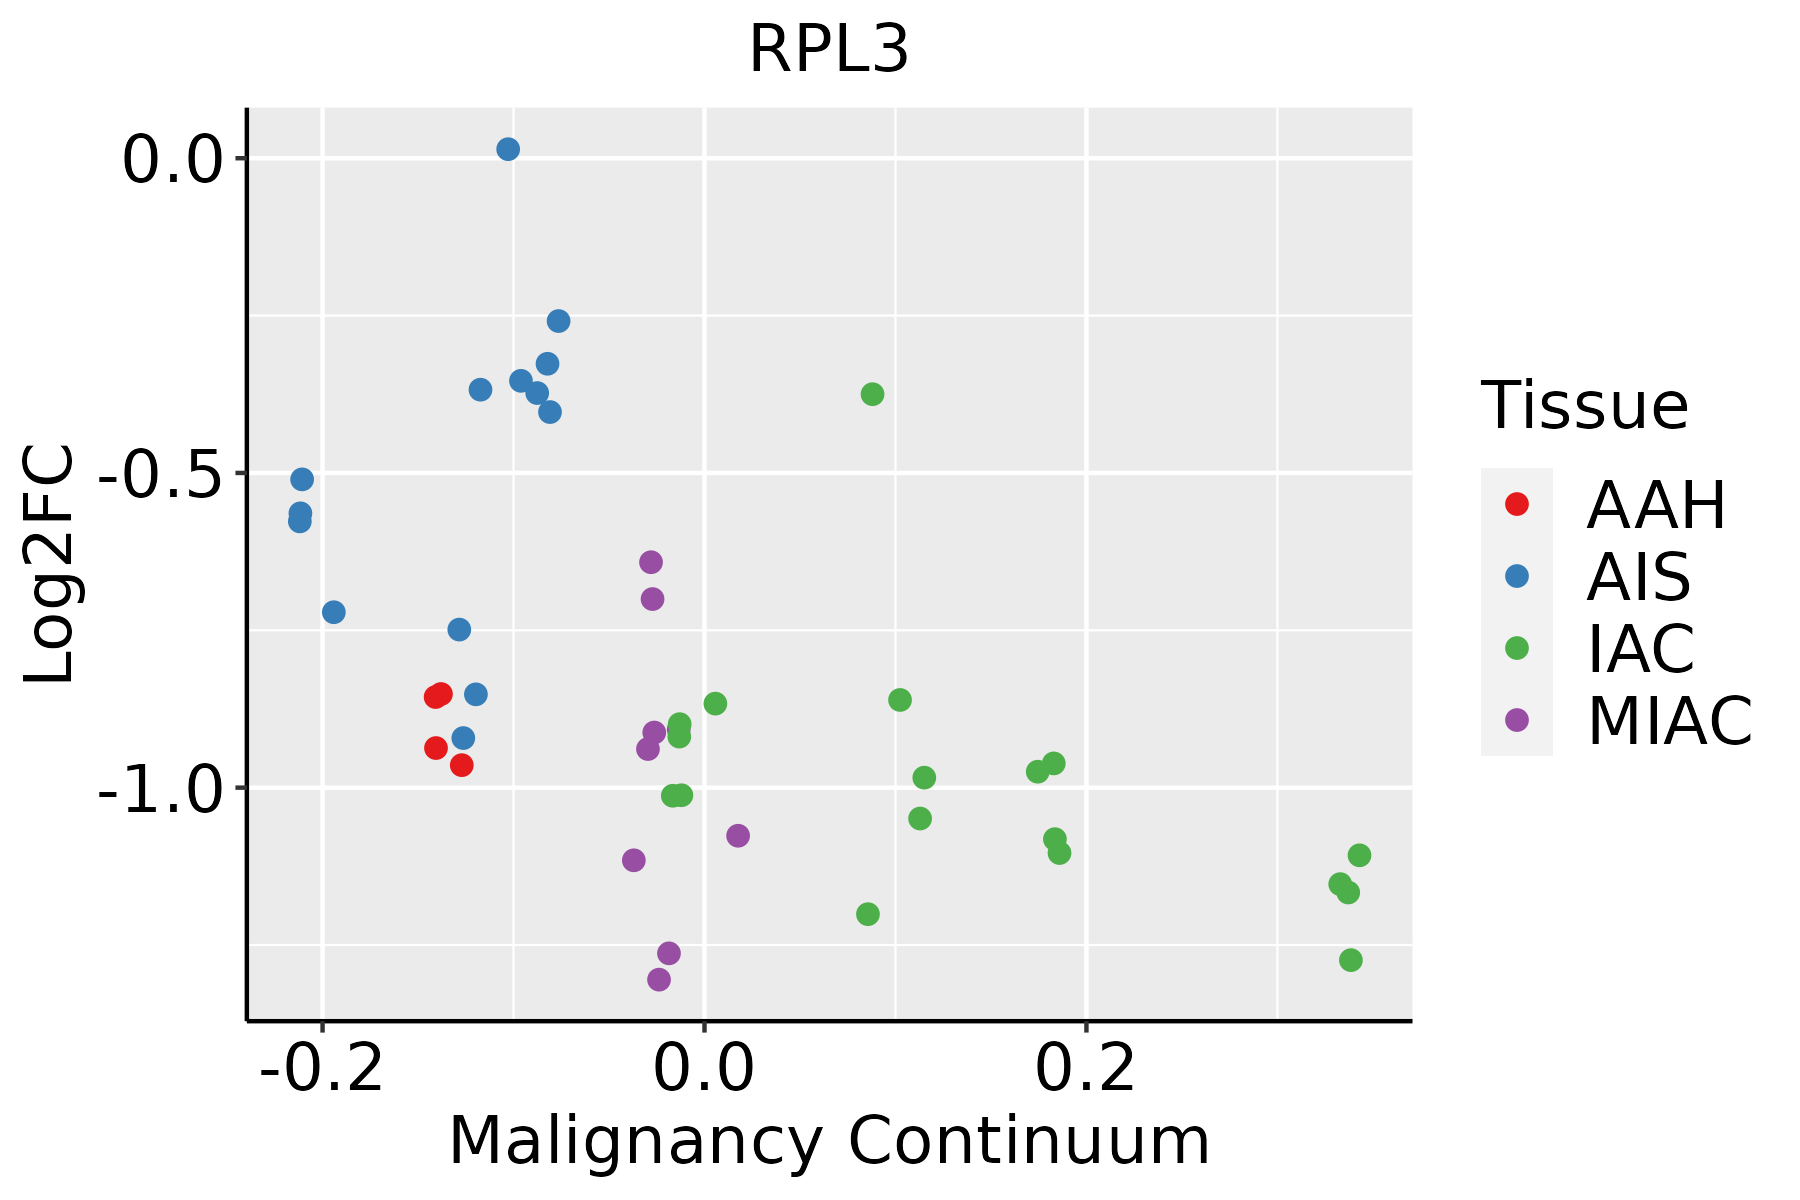 | AAH: Atypical adenomatous hyperplasia |
| AIS: Adenocarcinoma in situ |
| IAC: Invasive lung adenocarcinoma |
| MIA: Minimally invasive adenocarcinoma |
| Oral Cavity | 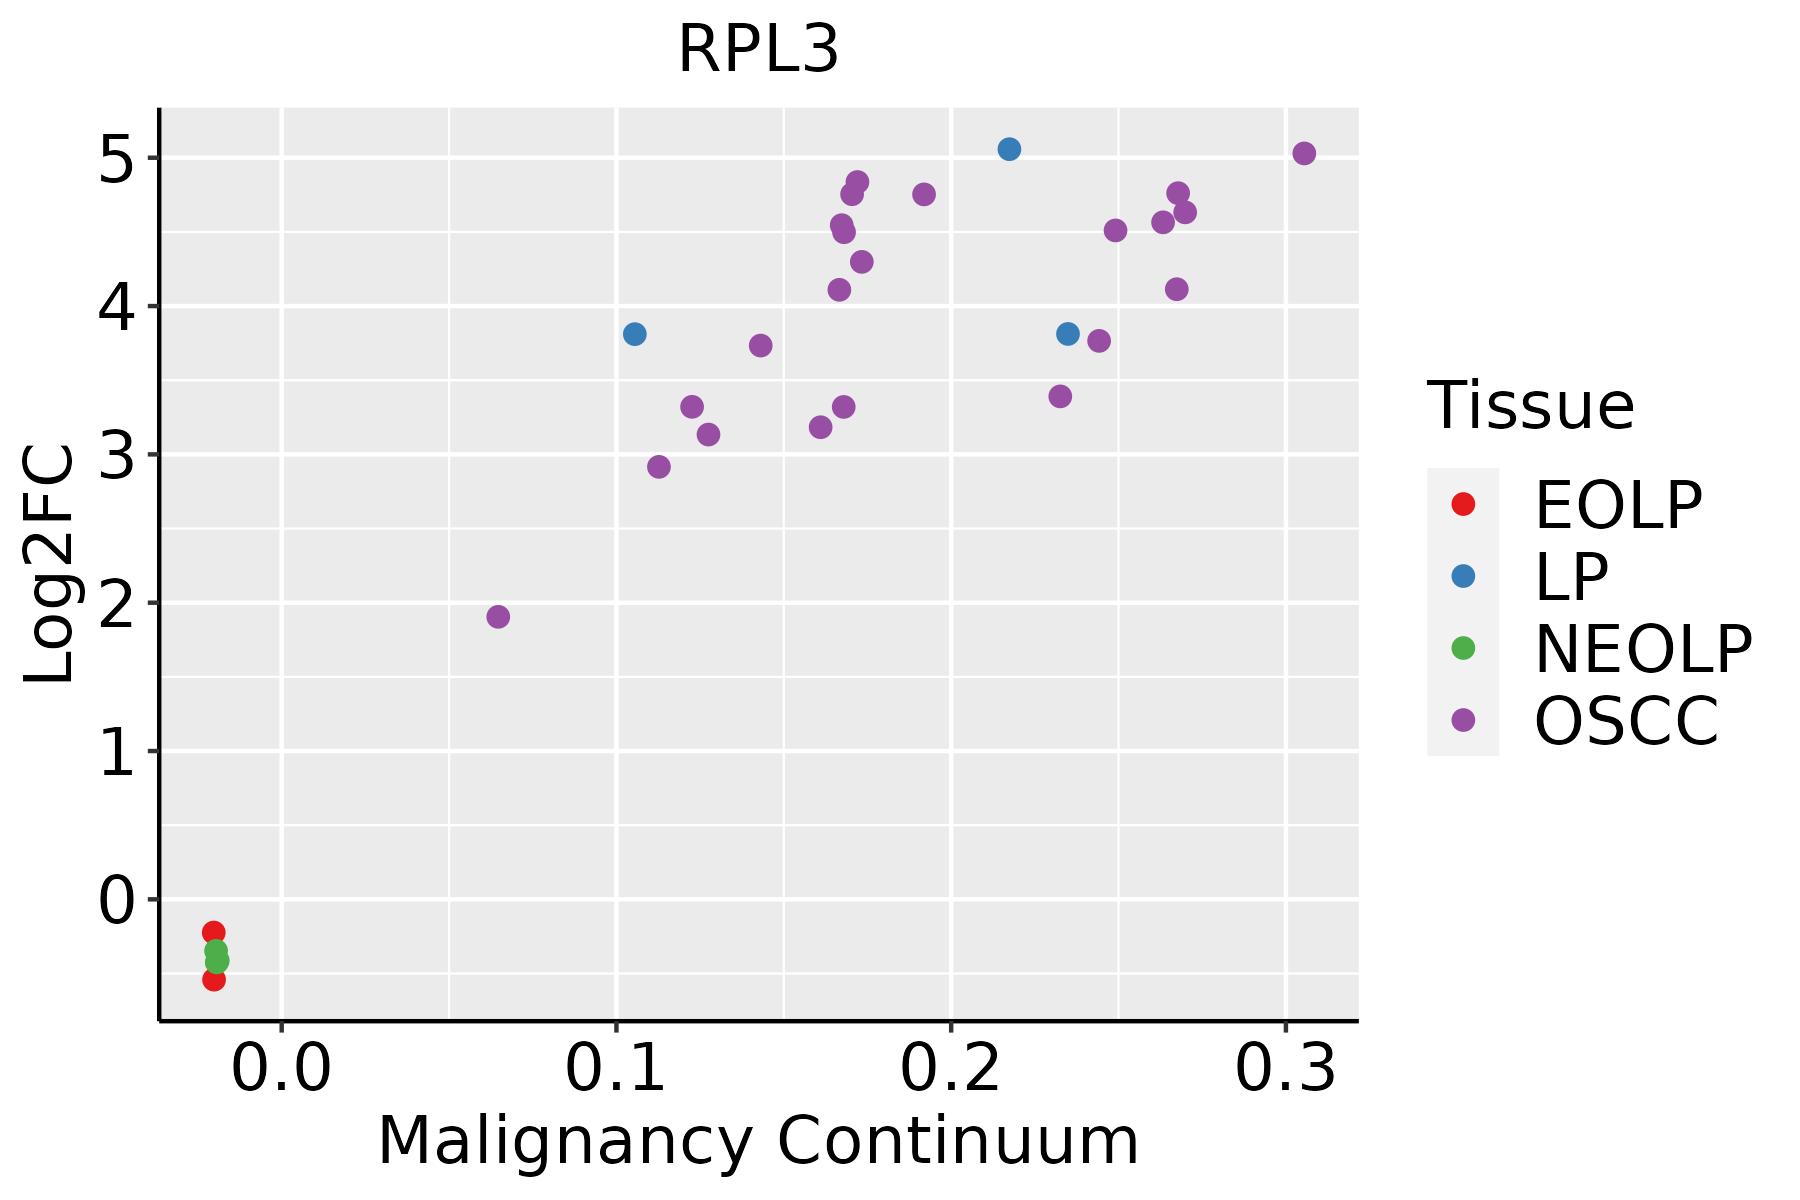 | EOLP: Erosive Oral lichen planus |
| LP: leukoplakia |
| NEOLP: Non-erosive oral lichen planus |
| OSCC: Oral squamous cell carcinoma |
| Prostate | 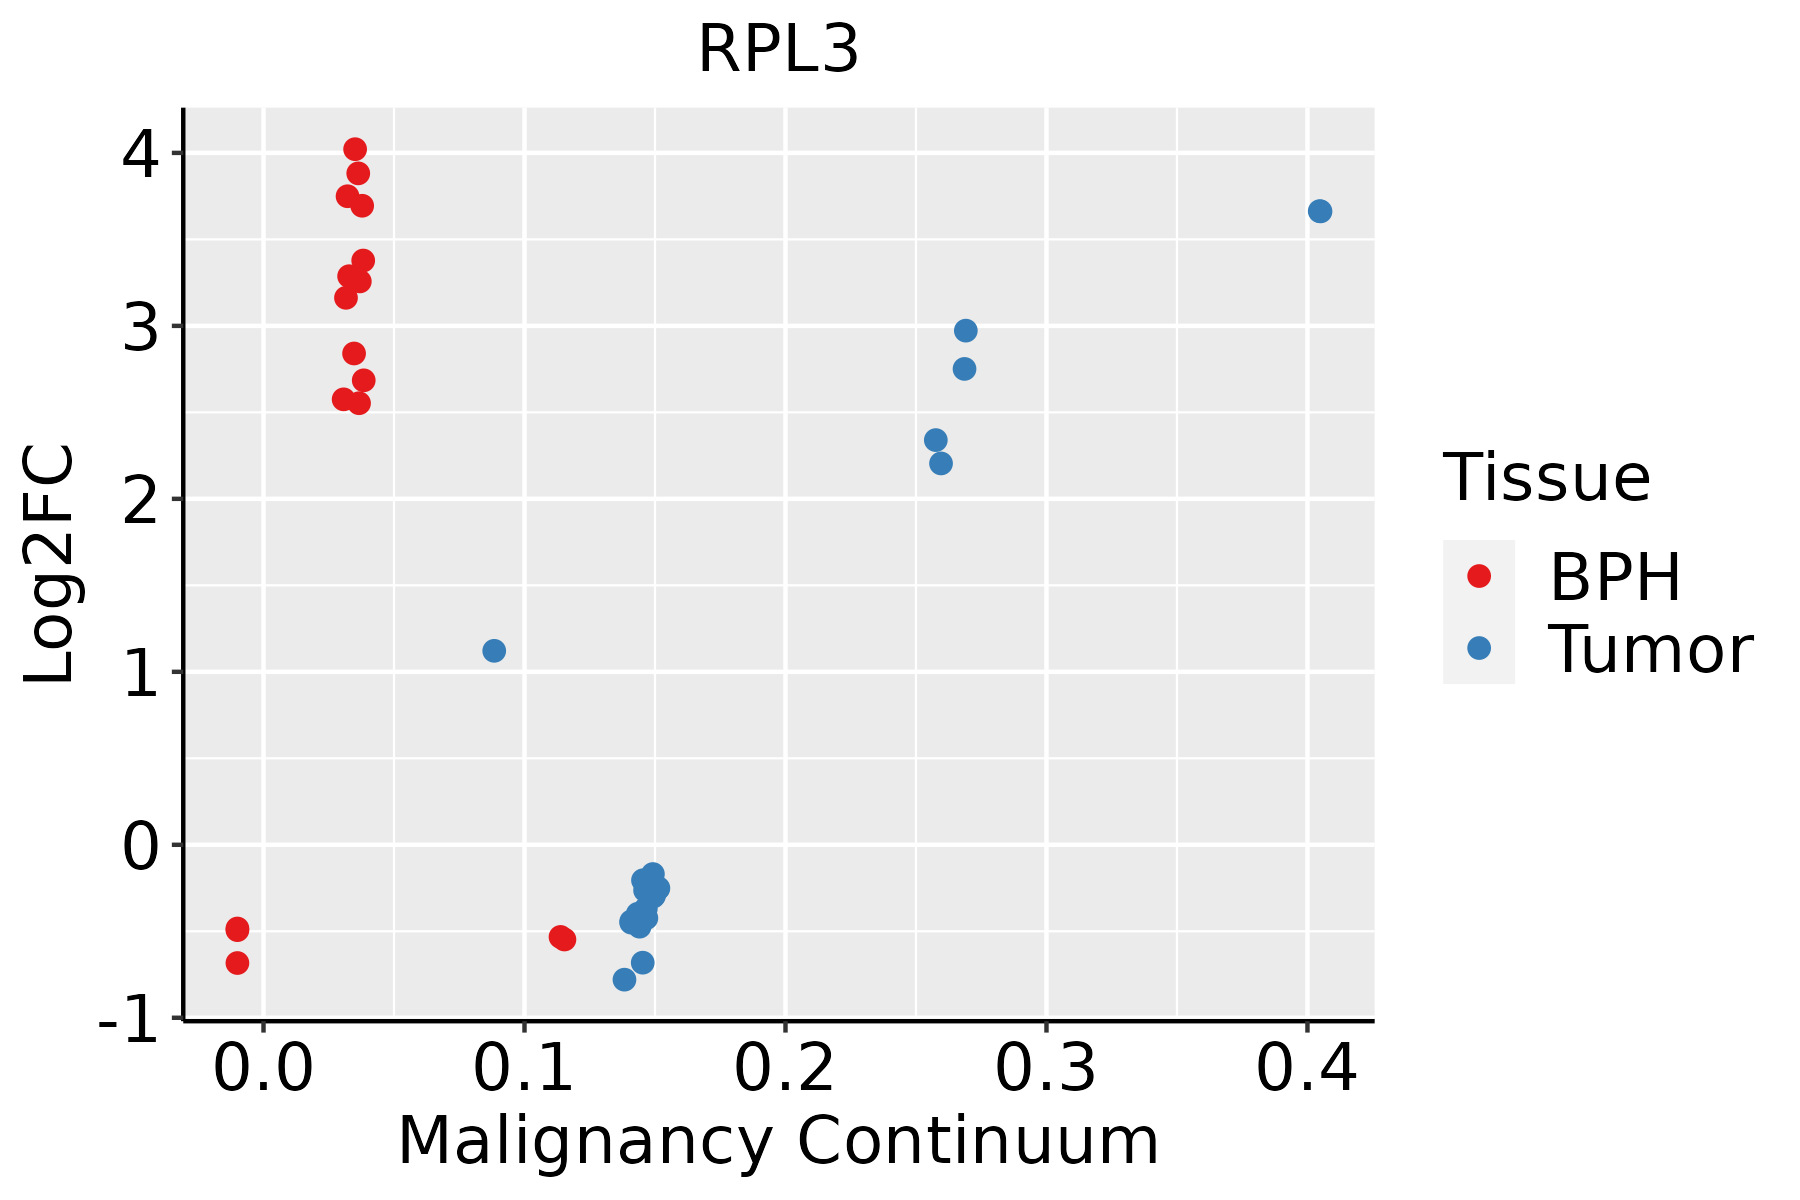 | BPH: Benign Prostatic Hyperplasia |
| Skin |  | AK: Actinic keratosis |
| cSCC: Cutaneous squamous cell carcinoma |
| SCCIS:squamous cell carcinoma in situ |
| Thyroid | 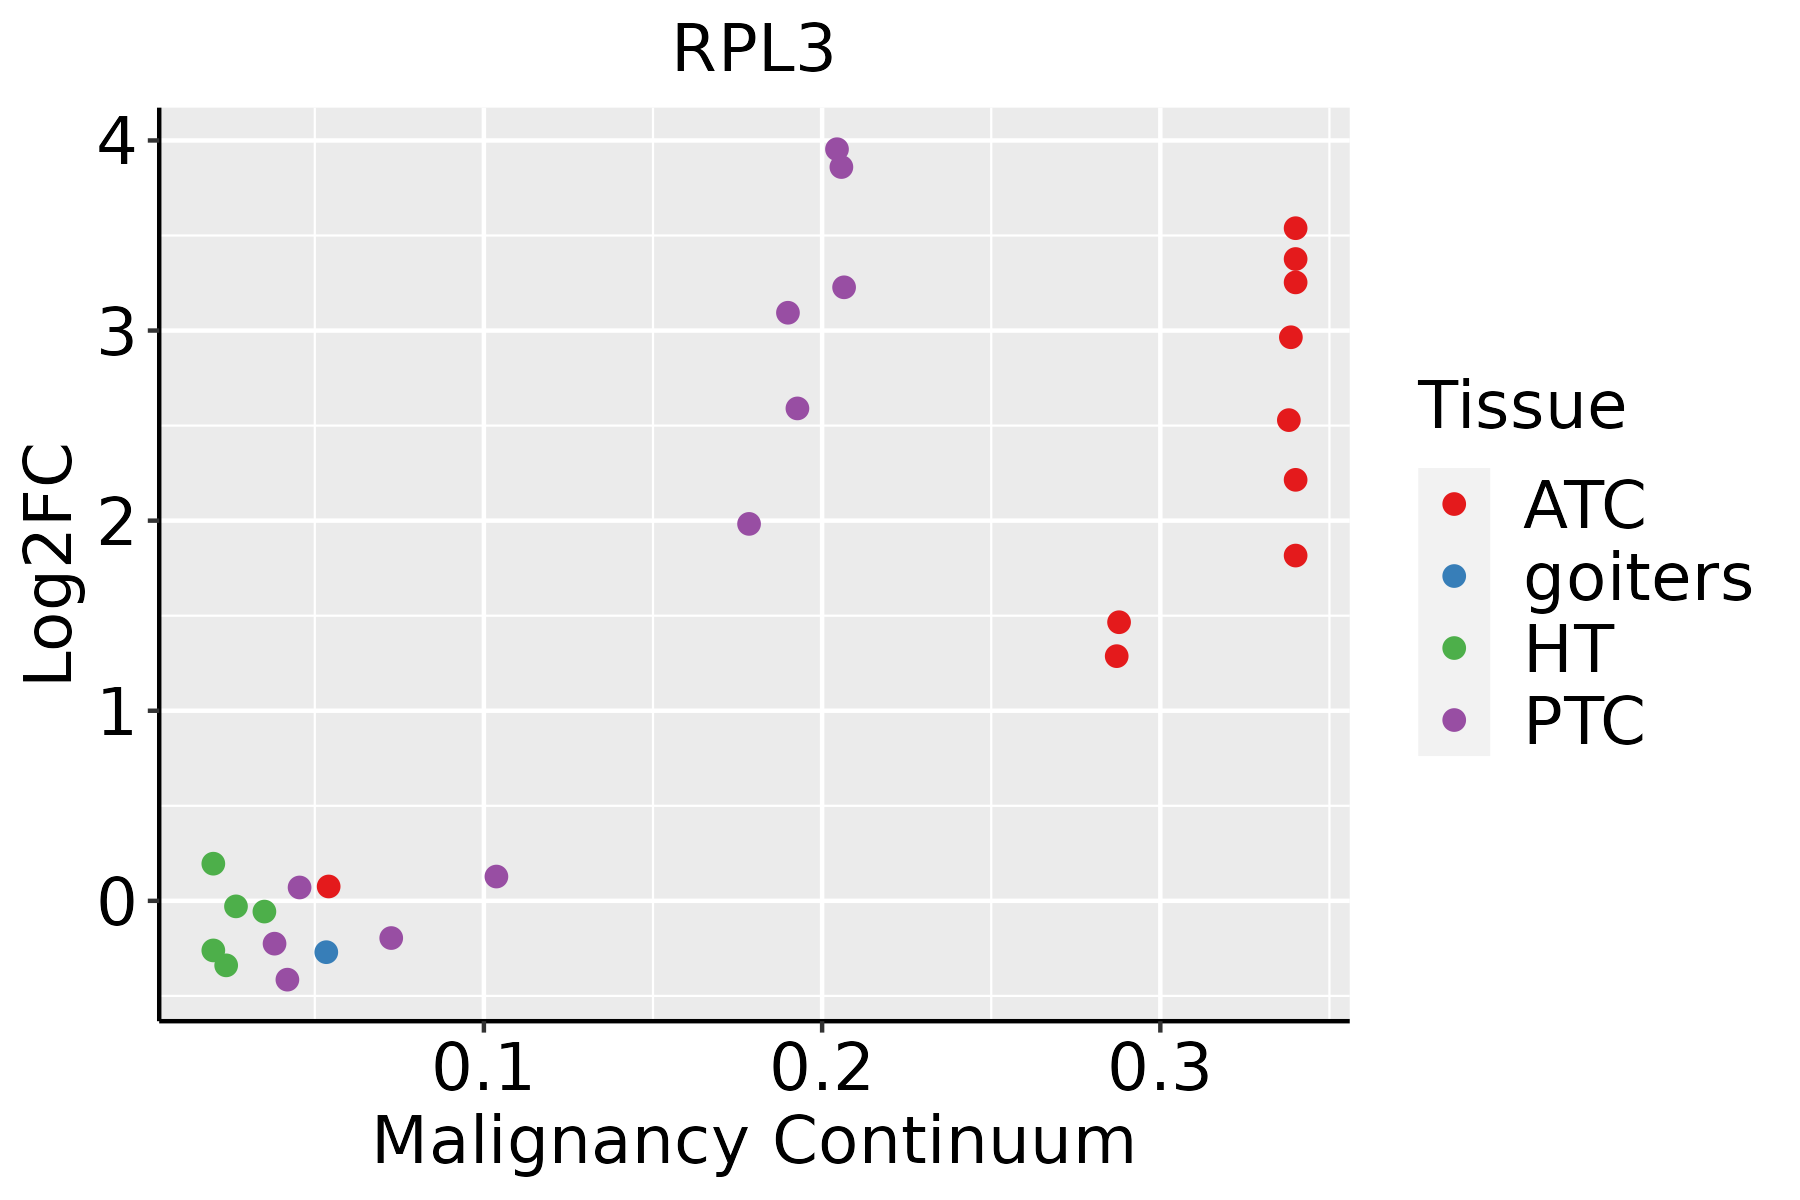 | ATC: Anaplastic thyroid cancer |
| HT: Hashimoto's thyroiditis |
| PTC: Papillary thyroid cancer |
| GO ID | Tissue | Disease Stage | Description | Gene Ratio | Bg Ratio | pvalue | p.adjust | Count |
| GO:004227421 | Stomach | CSG | ribosomal small subunit biogenesis | 15/1034 | 73/18723 | 8.71e-06 | 3.05e-04 | 15 |
| GO:004225421 | Stomach | CSG | ribosome biogenesis | 36/1034 | 299/18723 | 9.35e-06 | 3.26e-04 | 36 |
| GO:002261321 | Stomach | CSG | ribonucleoprotein complex biogenesis | 49/1034 | 463/18723 | 9.79e-06 | 3.36e-04 | 49 |
| GO:002261821 | Stomach | CSG | ribonucleoprotein complex assembly | 29/1034 | 220/18723 | 1.23e-05 | 4.17e-04 | 29 |
| GO:005134821 | Stomach | CSG | negative regulation of transferase activity | 33/1034 | 268/18723 | 1.37e-05 | 4.46e-04 | 33 |
| GO:00197312 | Stomach | CSG | antibacterial humoral response | 12/1034 | 60/18723 | 9.01e-05 | 2.07e-03 | 12 |
| GO:190466721 | Stomach | CSG | negative regulation of ubiquitin protein ligase activity | 5/1034 | 12/18723 | 2.91e-04 | 5.07e-03 | 5 |
| GO:005144421 | Stomach | CSG | negative regulation of ubiquitin-protein transferase activity | 6/1034 | 19/18723 | 4.07e-04 | 6.51e-03 | 6 |
| GO:00427422 | Stomach | CSG | defense response to bacterium | 35/1034 | 350/18723 | 5.14e-04 | 7.88e-03 | 35 |
| GO:000002721 | Stomach | CSG | ribosomal large subunit assembly | 7/1034 | 27/18723 | 5.14e-04 | 7.88e-03 | 7 |
| GO:00019062 | Stomach | CSG | cell killing | 22/1034 | 188/18723 | 7.18e-04 | 1.00e-02 | 22 |
| GO:000641721 | Stomach | CSG | regulation of translation | 43/1034 | 468/18723 | 7.58e-04 | 1.04e-02 | 43 |
| GO:00618442 | Stomach | CSG | antimicrobial humoral immune response mediated by antimicrobial peptide | 12/1034 | 79/18723 | 1.26e-03 | 1.50e-02 | 12 |
| GO:190179621 | Stomach | CSG | regulation of signal transduction by p53 class mediator | 13/1034 | 93/18723 | 1.76e-03 | 1.90e-02 | 13 |
| GO:00160723 | Stomach | CSG | rRNA metabolic process | 23/1034 | 236/18723 | 5.96e-03 | 4.68e-02 | 23 |
| GO:000218131 | Stomach | CAG | cytoplasmic translation | 60/552 | 148/18723 | 9.60e-53 | 4.29e-49 | 60 |
| GO:004225531 | Stomach | CAG | ribosome assembly | 14/552 | 61/18723 | 2.00e-09 | 3.66e-07 | 14 |
| GO:002261331 | Stomach | CAG | ribonucleoprotein complex biogenesis | 39/552 | 463/18723 | 4.33e-09 | 6.72e-07 | 39 |
| GO:004225431 | Stomach | CAG | ribosome biogenesis | 29/552 | 299/18723 | 2.08e-08 | 2.58e-06 | 29 |
| GO:004227431 | Stomach | CAG | ribosomal small subunit biogenesis | 14/552 | 73/18723 | 2.38e-08 | 2.87e-06 | 14 |
| Pathway ID | Tissue | Disease Stage | Description | Gene Ratio | Bg Ratio | pvalue | p.adjust | qvalue | Count |
| hsa0301018 | Breast | Precancer | Ribosome | 80/684 | 167/8465 | 7.33e-44 | 2.32e-41 | 1.77e-41 | 80 |
| hsa0517118 | Breast | Precancer | Coronavirus disease - COVID-19 | 81/684 | 232/8465 | 3.74e-32 | 2.36e-30 | 1.81e-30 | 81 |
| hsa0301019 | Breast | Precancer | Ribosome | 80/684 | 167/8465 | 7.33e-44 | 2.32e-41 | 1.77e-41 | 80 |
| hsa0517119 | Breast | Precancer | Coronavirus disease - COVID-19 | 81/684 | 232/8465 | 3.74e-32 | 2.36e-30 | 1.81e-30 | 81 |
| hsa0301024 | Breast | IDC | Ribosome | 83/867 | 167/8465 | 6.07e-39 | 9.87e-37 | 7.38e-37 | 83 |
| hsa0517124 | Breast | IDC | Coronavirus disease - COVID-19 | 86/867 | 232/8465 | 1.50e-28 | 9.72e-27 | 7.27e-27 | 86 |
| hsa0301034 | Breast | IDC | Ribosome | 83/867 | 167/8465 | 6.07e-39 | 9.87e-37 | 7.38e-37 | 83 |
| hsa0517134 | Breast | IDC | Coronavirus disease - COVID-19 | 86/867 | 232/8465 | 1.50e-28 | 9.72e-27 | 7.27e-27 | 86 |
| hsa0301044 | Breast | DCIS | Ribosome | 82/846 | 167/8465 | 8.69e-39 | 1.40e-36 | 1.03e-36 | 82 |
| hsa0517144 | Breast | DCIS | Coronavirus disease - COVID-19 | 86/846 | 232/8465 | 2.42e-29 | 1.56e-27 | 1.15e-27 | 86 |
| hsa0301054 | Breast | DCIS | Ribosome | 82/846 | 167/8465 | 8.69e-39 | 1.40e-36 | 1.03e-36 | 82 |
| hsa0517154 | Breast | DCIS | Coronavirus disease - COVID-19 | 86/846 | 232/8465 | 2.42e-29 | 1.56e-27 | 1.15e-27 | 86 |
| hsa0517120 | Cervix | CC | Coronavirus disease - COVID-19 | 111/1267 | 232/8465 | 1.82e-33 | 5.90e-31 | 3.49e-31 | 111 |
| hsa0301020 | Cervix | CC | Ribosome | 85/1267 | 167/8465 | 3.17e-28 | 5.14e-26 | 3.04e-26 | 85 |
| hsa05171110 | Cervix | CC | Coronavirus disease - COVID-19 | 111/1267 | 232/8465 | 1.82e-33 | 5.90e-31 | 3.49e-31 | 111 |
| hsa03010110 | Cervix | CC | Ribosome | 85/1267 | 167/8465 | 3.17e-28 | 5.14e-26 | 3.04e-26 | 85 |
| hsa0301025 | Cervix | HSIL_HPV | Ribosome | 80/459 | 167/8465 | 9.61e-58 | 2.82e-55 | 2.28e-55 | 80 |
| hsa0517125 | Cervix | HSIL_HPV | Coronavirus disease - COVID-19 | 91/459 | 232/8465 | 2.14e-56 | 3.13e-54 | 2.53e-54 | 91 |
| hsa0301035 | Cervix | HSIL_HPV | Ribosome | 80/459 | 167/8465 | 9.61e-58 | 2.82e-55 | 2.28e-55 | 80 |
| hsa0517135 | Cervix | HSIL_HPV | Coronavirus disease - COVID-19 | 91/459 | 232/8465 | 2.14e-56 | 3.13e-54 | 2.53e-54 | 91 |
| Hugo Symbol | Variant Class | Variant Classification | dbSNP RS | HGVSc | HGVSp | HGVSp Short | SWISSPROT | BIOTYPE | SIFT | PolyPhen | Tumor Sample Barcode | Tissue | Histology | Sex | Age | Stage | Therapy Types | Drugs | Outcome |
| RPL3 | insertion | Nonsense_Mutation | novel | c.451_452insAATGCCTGCCTGAAAGTCGGTTGTGAG | p.Ser151delinsLysCysLeuProGluSerArgLeuTerGly | p.S151delinsKCLPESRL*G | P39023 | protein_coding | | | TCGA-A8-A09C-01 | Breast | breast invasive carcinoma | Female | >=65 | I/II | Unknown | Unknown | SD |
| RPL3 | insertion | Nonsense_Mutation | novel | c.481_482insACCAGTAACACTGAAATGCCTGCCTGAAAGTCGGTTGTGAG | p.Arg161HisfsTer3 | p.R161Hfs*3 | P39023 | protein_coding | | | TCGA-A8-A0A1-01 | Breast | breast invasive carcinoma | Female | >=65 | I/II | Hormone Therapy | tamoxiphen | SD |
| RPL3 | insertion | Frame_Shift_Ins | novel | c.114_115insT | p.Lys39Ter | p.K39* | P39023 | protein_coding | | | TCGA-AN-A041-01 | Breast | breast invasive carcinoma | Female | <65 | I/II | Unknown | Unknown | SD |
| RPL3 | insertion | Frame_Shift_Ins | novel | c.415_416insCTTCTCCCTT | p.Asp139AlafsTer5 | p.D139Afs*5 | P39023 | protein_coding | | | TCGA-AO-A0J4-01 | Breast | breast invasive carcinoma | Female | <65 | I/II | Chemotherapy | doxorubicin | SD |
| RPL3 | insertion | Nonsense_Mutation | novel | c.446_447insATTCAACTGGTGACTCACCAGTAACACTGAAATGCCTGC | p.Asp149delinsGluPheAsnTrpTerLeuThrSerAsnThrGluMetProAla | p.D149delinsEFNW*LTSNTEMPA | P39023 | protein_coding | | | TCGA-B6-A0RE-01 | Breast | breast invasive carcinoma | Female | <65 | I/II | Unknown | Unknown | SD |
| RPL3 | deletion | Frame_Shift_Del | novel | c.481delC | p.Arg161ValfsTer20 | p.R161Vfs*20 | P39023 | protein_coding | | | TCGA-EW-A2FV-01 | Breast | breast invasive carcinoma | Female | <65 | III/IV | Chemotherapy | docetaxel | SD |
| RPL3 | SNV | Missense_Mutation | | c.1183N>A | p.Asp395Asn | p.D395N | P39023 | protein_coding | deleterious(0.03) | benign(0.041) | TCGA-FU-A3EO-01 | Cervix | cervical & endocervical cancer | Female | <65 | I/II | Unknown | Unknown | SD |
| RPL3 | SNV | Missense_Mutation | | c.1086N>C | p.Lys362Asn | p.K362N | P39023 | protein_coding | tolerated(0.2) | benign(0.001) | TCGA-FU-A3YQ-01 | Cervix | cervical & endocervical cancer | Female | <65 | I/II | Unknown | Unknown | SD |
| RPL3 | SNV | Missense_Mutation | novel | c.90G>T | p.Lys30Asn | p.K30N | P39023 | protein_coding | deleterious(0) | possibly_damaging(0.776) | TCGA-MY-A5BF-01 | Cervix | cervical & endocervical cancer | Female | >=65 | I/II | Chemotherapy | cisplatin | CR |
| RPL3 | SNV | Missense_Mutation | novel | c.1036A>G | p.Thr346Ala | p.T346A | P39023 | protein_coding | deleterious(0.05) | possibly_damaging(0.803) | TCGA-AA-3715-01 | Colorectum | colon adenocarcinoma | Male | >=65 | I/II | Unknown | Unknown | PD |


