| Tissue | Expression Dynamics | Abbreviation |
| Cervix |  | CC: Cervix cancer |
| HSIL_HPV: HPV-infected high-grade squamous intraepithelial lesions |
| N_HPV: HPV-infected normal cervix |
| Esophagus |  | ESCC: Esophageal squamous cell carcinoma |
| HGIN: High-grade intraepithelial neoplasias |
| LGIN: Low-grade intraepithelial neoplasias |
| Liver | 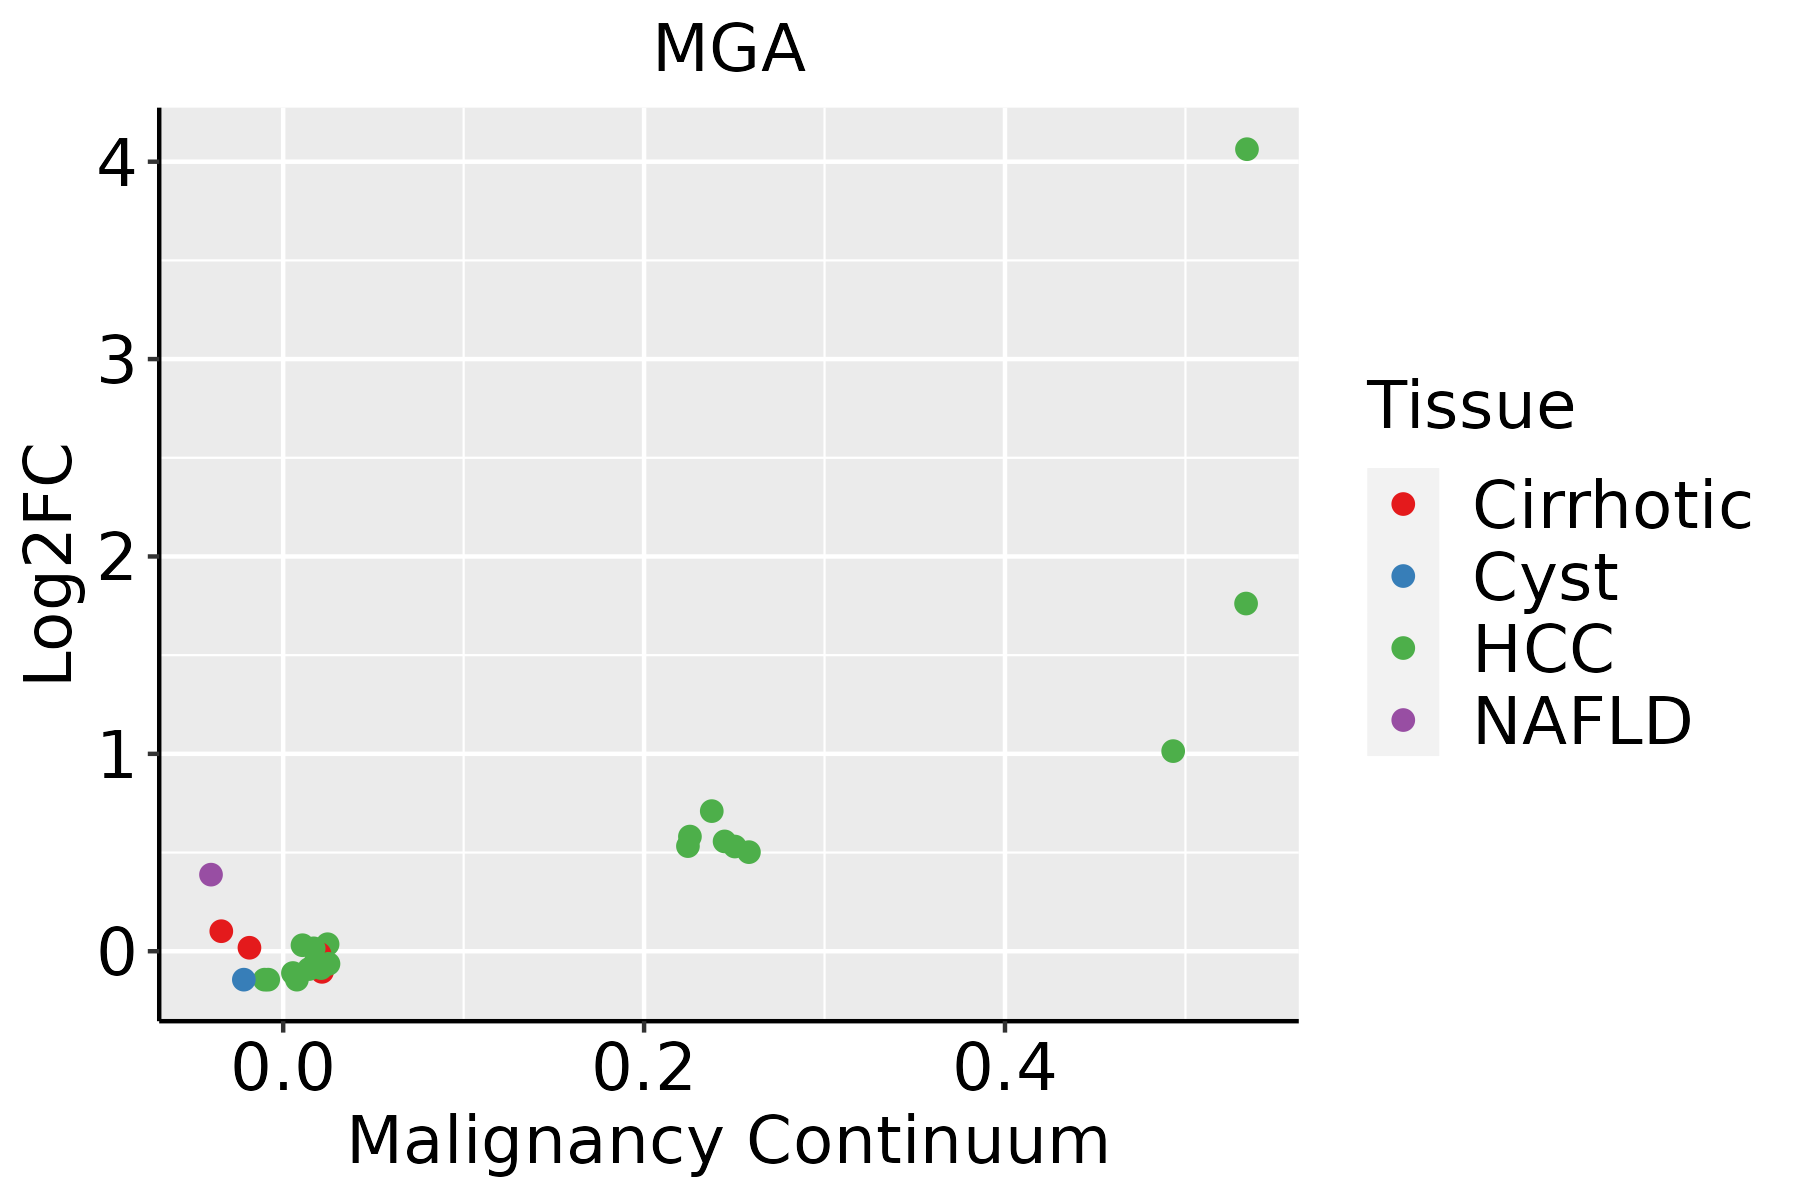 | HCC: Hepatocellular carcinoma |
| NAFLD: Non-alcoholic fatty liver disease |
| Prostate | 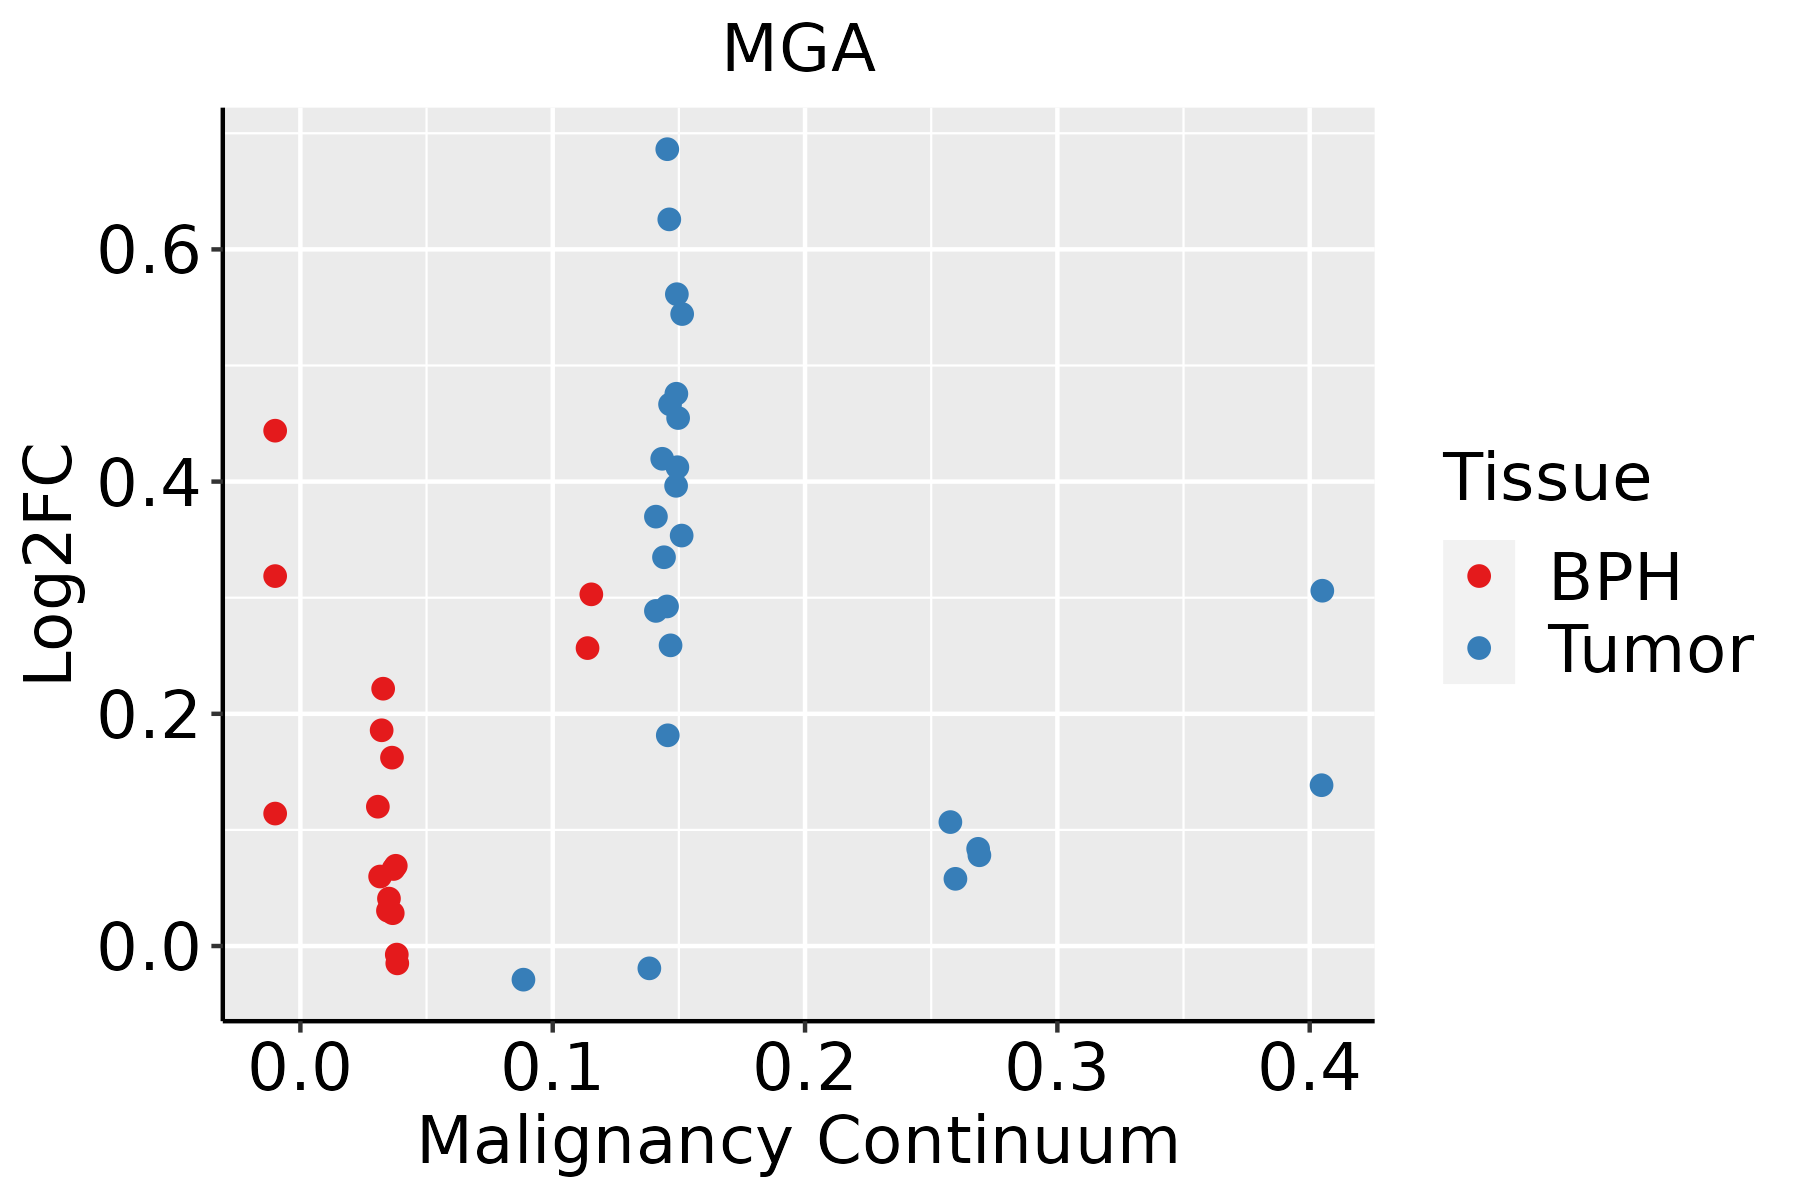 | BPH: Benign Prostatic Hyperplasia |
| Thyroid |  | ATC: Anaplastic thyroid cancer |
| HT: Hashimoto's thyroiditis |
| PTC: Papillary thyroid cancer |
| GO ID | Tissue | Disease Stage | Description | Gene Ratio | Bg Ratio | pvalue | p.adjust | Count |
| GO:005134621 | Stomach | CSG | negative regulation of hydrolase activity | 44/1034 | 379/18723 | 2.62e-06 | 1.16e-04 | 44 |
| GO:00096152 | Stomach | CSG | response to virus | 36/1034 | 367/18723 | 6.16e-04 | 8.96e-03 | 36 |
| GO:000756821 | Stomach | CSG | aging | 33/1034 | 339/18723 | 1.16e-03 | 1.42e-02 | 33 |
| GO:004593621 | Stomach | CSG | negative regulation of phosphate metabolic process | 40/1034 | 441/18723 | 1.45e-03 | 1.67e-02 | 40 |
| GO:001056321 | Stomach | CSG | negative regulation of phosphorus metabolic process | 40/1034 | 442/18723 | 1.51e-03 | 1.71e-02 | 40 |
| GO:003530421 | Stomach | CSG | regulation of protein dephosphorylation | 12/1034 | 90/18723 | 3.87e-03 | 3.40e-02 | 12 |
| GO:004366621 | Stomach | CSG | regulation of phosphoprotein phosphatase activity | 9/1034 | 58/18723 | 4.28e-03 | 3.68e-02 | 9 |
| GO:002241111 | Stomach | CSG | cellular component disassembly | 38/1034 | 443/18723 | 4.84e-03 | 4.04e-02 | 38 |
| GO:001092111 | Stomach | CSG | regulation of phosphatase activity | 11/1034 | 84/18723 | 6.37e-03 | 4.92e-02 | 11 |
| GO:00075683 | Stomach | CAG | aging | 23/552 | 339/18723 | 1.95e-04 | 4.23e-03 | 23 |
| GO:0007569 | Stomach | CAG | cell aging | 10/552 | 132/18723 | 5.76e-03 | 4.73e-02 | 10 |
| GO:00075684 | Stomach | WIM | aging | 18/426 | 339/18723 | 8.14e-04 | 1.28e-02 | 18 |
| GO:00075685 | Stomach | SIM | aging | 27/708 | 339/18723 | 2.33e-04 | 4.64e-03 | 27 |
| GO:00096153 | Stomach | SIM | response to virus | 26/708 | 367/18723 | 1.70e-03 | 1.96e-02 | 26 |
| GO:0016032113 | Thyroid | PTC | viral process | 236/5968 | 415/18723 | 2.48e-26 | 8.24e-24 | 236 |
| GO:0022411113 | Thyroid | PTC | cellular component disassembly | 232/5968 | 443/18723 | 1.36e-19 | 1.75e-17 | 232 |
| GO:0051098113 | Thyroid | PTC | regulation of binding | 195/5968 | 363/18723 | 3.21e-18 | 3.37e-16 | 195 |
| GO:001657010 | Thyroid | PTC | histone modification | 235/5968 | 463/18723 | 1.17e-17 | 1.15e-15 | 235 |
| GO:0034655112 | Thyroid | PTC | nucleobase-containing compound catabolic process | 211/5968 | 407/18723 | 2.72e-17 | 2.52e-15 | 211 |
| GO:0046700111 | Thyroid | PTC | heterocycle catabolic process | 221/5968 | 445/18723 | 2.43e-15 | 1.72e-13 | 221 |
| TF | Cell Type | Tissue | Disease Stage | Target Gene | RSS | Regulon Activity |
| MGA | CD8TEFF | Breast | ADJ | NUP107,TUBGCP2,HIST2H2AC, etc. | 1.77e-01 |  |
| MGA | CD8TEXINT | Breast | DCIS | NUP107,TUBGCP2,HIST2H2AC, etc. | 1.50e-01 |  |
| MGA | CD8TEFF | Breast | DCIS | NUP107,TUBGCP2,HIST2H2AC, etc. | 1.27e-01 | |
| MGA | CD8TEFF | Breast | Healthy | NUP107,TUBGCP2,HIST2H2AC, etc. | 6.35e-02 |  |
| MGA | CD8TEFF | Breast | IDC | NUP107,TUBGCP2,HIST2H2AC, etc. | 9.26e-02 |  |
| MGA | TH1 | Colorectum | MSI-H | PARP9,WDFY1,MRPS9, etc. | 2.42e-02 |  |
| MGA | PERI | Colorectum | MSI-H | ERO1B,POLG,RFC3, etc. | 2.53e-01 | |
| MGA | CD8TEFF | Lung | AAH | HEXIM1,ST8SIA6,PTPRA, etc. | 1.97e-01 |  |
| MGA | NEUT | Lung | AIS | AC010260.1,LNX2,AP002762.2, etc. | 1.80e-02 |  |
| MGA | CD8TEXP | Oral cavity | EOLP | TYW1B,MBNL3,ZNF266, etc. | 1.80e-01 |  |
| Hugo Symbol | Variant Class | Variant Classification | dbSNP RS | HGVSc | HGVSp | HGVSp Short | SWISSPROT | BIOTYPE | SIFT | PolyPhen | Tumor Sample Barcode | Tissue | Histology | Sex | Age | Stage | Therapy Types | Drugs | Outcome |
| MGA | SNV | Missense_Mutation | | c.7534N>G | p.Lys2512Glu | p.K2512E | Q8IWI9 | protein_coding | deleterious(0) | probably_damaging(0.995) | TCGA-A1-A0SE-01 | Breast | breast invasive carcinoma | Female | <65 | I/II | Unknown | Unknown | SD |
| MGA | SNV | Missense_Mutation | rs367727094 | c.4180N>T | p.Arg1394Cys | p.R1394C | Q8IWI9 | protein_coding | deleterious(0) | probably_damaging(0.996) | TCGA-A1-A0SN-01 | Breast | breast invasive carcinoma | Female | <65 | I/II | Chemotherapy | ac | SD |
| MGA | SNV | Missense_Mutation | novel | c.7933T>G | p.Leu2645Val | p.L2645V | Q8IWI9 | protein_coding | tolerated(0.16) | possibly_damaging(0.76) | TCGA-A7-A5ZX-01 | Breast | breast invasive carcinoma | Female | <65 | III/IV | Chemotherapy | doxorubicin | CR |
| MGA | SNV | Missense_Mutation | | c.1279C>G | p.Leu427Val | p.L427V | Q8IWI9 | protein_coding | deleterious(0.03) | probably_damaging(0.94) | TCGA-A8-A082-01 | Breast | breast invasive carcinoma | Female | <65 | I/II | Chemotherapy | 5-fluorouracil | CR |
| MGA | SNV | Missense_Mutation | novel | c.4252N>C | p.Asp1418His | p.D1418H | Q8IWI9 | protein_coding | deleterious(0) | probably_damaging(0.921) | TCGA-A8-A08L-01 | Breast | breast invasive carcinoma | Female | >=65 | III/IV | Unknown | Unknown | SD |
| MGA | SNV | Missense_Mutation | rs773922303 | c.2789C>G | p.Ser930Cys | p.S930C | Q8IWI9 | protein_coding | deleterious(0) | benign(0.009) | TCGA-A8-A09I-01 | Breast | breast invasive carcinoma | Female | >=65 | I/II | Hormone Therapy | anastrozole | SD |
| MGA | SNV | Missense_Mutation | | c.7384C>G | p.Leu2462Val | p.L2462V | Q8IWI9 | protein_coding | deleterious(0.04) | benign(0.366) | TCGA-AC-A23H-01 | Breast | breast invasive carcinoma | Female | >=65 | I/II | Unknown | Unknown | PD |
| MGA | SNV | Missense_Mutation | novel | c.1663G>A | p.Asp555Asn | p.D555N | Q8IWI9 | protein_coding | tolerated_low_confidence(0.62) | benign(0.046) | TCGA-AC-A5XS-01 | Breast | breast invasive carcinoma | Female | >=65 | I/II | Hormone Therapy | femara | SD |
| MGA | SNV | Missense_Mutation | novel | c.7330G>A | p.Glu2444Lys | p.E2444K | Q8IWI9 | protein_coding | deleterious(0.04) | probably_damaging(0.98) | TCGA-AC-A5XS-01 | Breast | breast invasive carcinoma | Female | >=65 | I/II | Hormone Therapy | femara | SD |
| MGA | SNV | Missense_Mutation | novel | c.383C>A | p.Ser128Tyr | p.S128Y | Q8IWI9 | protein_coding | deleterious(0) | probably_damaging(0.988) | TCGA-AN-A046-01 | Breast | breast invasive carcinoma | Female | >=65 | I/II | Unknown | Unknown | SD |


