
|
|||||
|
 | |
| |
| |
| |
| |
| |
|
Gene: MAP2 |
Gene summary for MAP2 |
| Gene information | Species | Human | Gene symbol | MAP2 | Gene ID | 4133 |
| Gene name | microtubule associated protein 2 | |
| Gene Alias | MAP-2 | |
| Cytomap | 2q34 | |
| Gene Type | protein-coding | GO ID | GO:0000226 | UniProtAcc | P11137 |
Top |
Malignant transformation analysis |
| Identification of the aberrant gene expression in precancerous and cancerous lesions by comparing the gene expression of stem-like cells in diseased tissues with normal stem cells |
| Entrez ID | Symbol | Replicates | Species | Organ | Tissue | Adj P-value | Log2FC | Malignancy |
| 4133 | MAP2 | LZE4T | Human | Esophagus | ESCC | 7.93e-16 | 5.39e-01 | 0.0811 |
| 4133 | MAP2 | LZE7T | Human | Esophagus | ESCC | 1.27e-09 | 6.53e-01 | 0.0667 |
| 4133 | MAP2 | P5T-E | Human | Esophagus | ESCC | 8.79e-05 | 6.41e-02 | 0.1327 |
| 4133 | MAP2 | P9T-E | Human | Esophagus | ESCC | 1.96e-08 | 2.07e-01 | 0.1131 |
| 4133 | MAP2 | P11T-E | Human | Esophagus | ESCC | 3.36e-02 | 1.76e-01 | 0.1426 |
| 4133 | MAP2 | P12T-E | Human | Esophagus | ESCC | 9.39e-07 | 1.71e-01 | 0.1122 |
| 4133 | MAP2 | P15T-E | Human | Esophagus | ESCC | 1.77e-13 | 2.75e-01 | 0.1149 |
| 4133 | MAP2 | P16T-E | Human | Esophagus | ESCC | 1.13e-12 | 4.01e-02 | 0.1153 |
| 4133 | MAP2 | P28T-E | Human | Esophagus | ESCC | 7.08e-07 | 1.36e-01 | 0.1149 |
| 4133 | MAP2 | P37T-E | Human | Esophagus | ESCC | 8.26e-10 | 1.77e-01 | 0.1371 |
| 4133 | MAP2 | P39T-E | Human | Esophagus | ESCC | 9.62e-04 | 4.87e-02 | 0.0894 |
| 4133 | MAP2 | P49T-E | Human | Esophagus | ESCC | 7.51e-08 | 5.77e-01 | 0.1768 |
| 4133 | MAP2 | P52T-E | Human | Esophagus | ESCC | 7.12e-05 | 9.14e-02 | 0.1555 |
| 4133 | MAP2 | P74T-E | Human | Esophagus | ESCC | 2.98e-06 | 1.44e-01 | 0.1479 |
| 4133 | MAP2 | P76T-E | Human | Esophagus | ESCC | 3.34e-03 | 1.16e-01 | 0.1207 |
| 4133 | MAP2 | P79T-E | Human | Esophagus | ESCC | 3.29e-03 | 2.52e-01 | 0.1154 |
| 4133 | MAP2 | P107T-E | Human | Esophagus | ESCC | 1.35e-28 | 5.78e-01 | 0.171 |
| 4133 | MAP2 | S42 | Human | Liver | HCC | 6.69e-03 | 5.00e-01 | -0.0103 |
| 4133 | MAP2 | HCC1_Meng | Human | Liver | HCC | 4.42e-34 | -7.14e-02 | 0.0246 |
| 4133 | MAP2 | HCC1 | Human | Liver | HCC | 1.49e-02 | 3.15e+00 | 0.5336 |
| Page: 1 2 |
| Tissue | Expression Dynamics | Abbreviation |
| Esophagus |  | ESCC: Esophageal squamous cell carcinoma |
| HGIN: High-grade intraepithelial neoplasias | ||
| LGIN: Low-grade intraepithelial neoplasias | ||
| Liver | 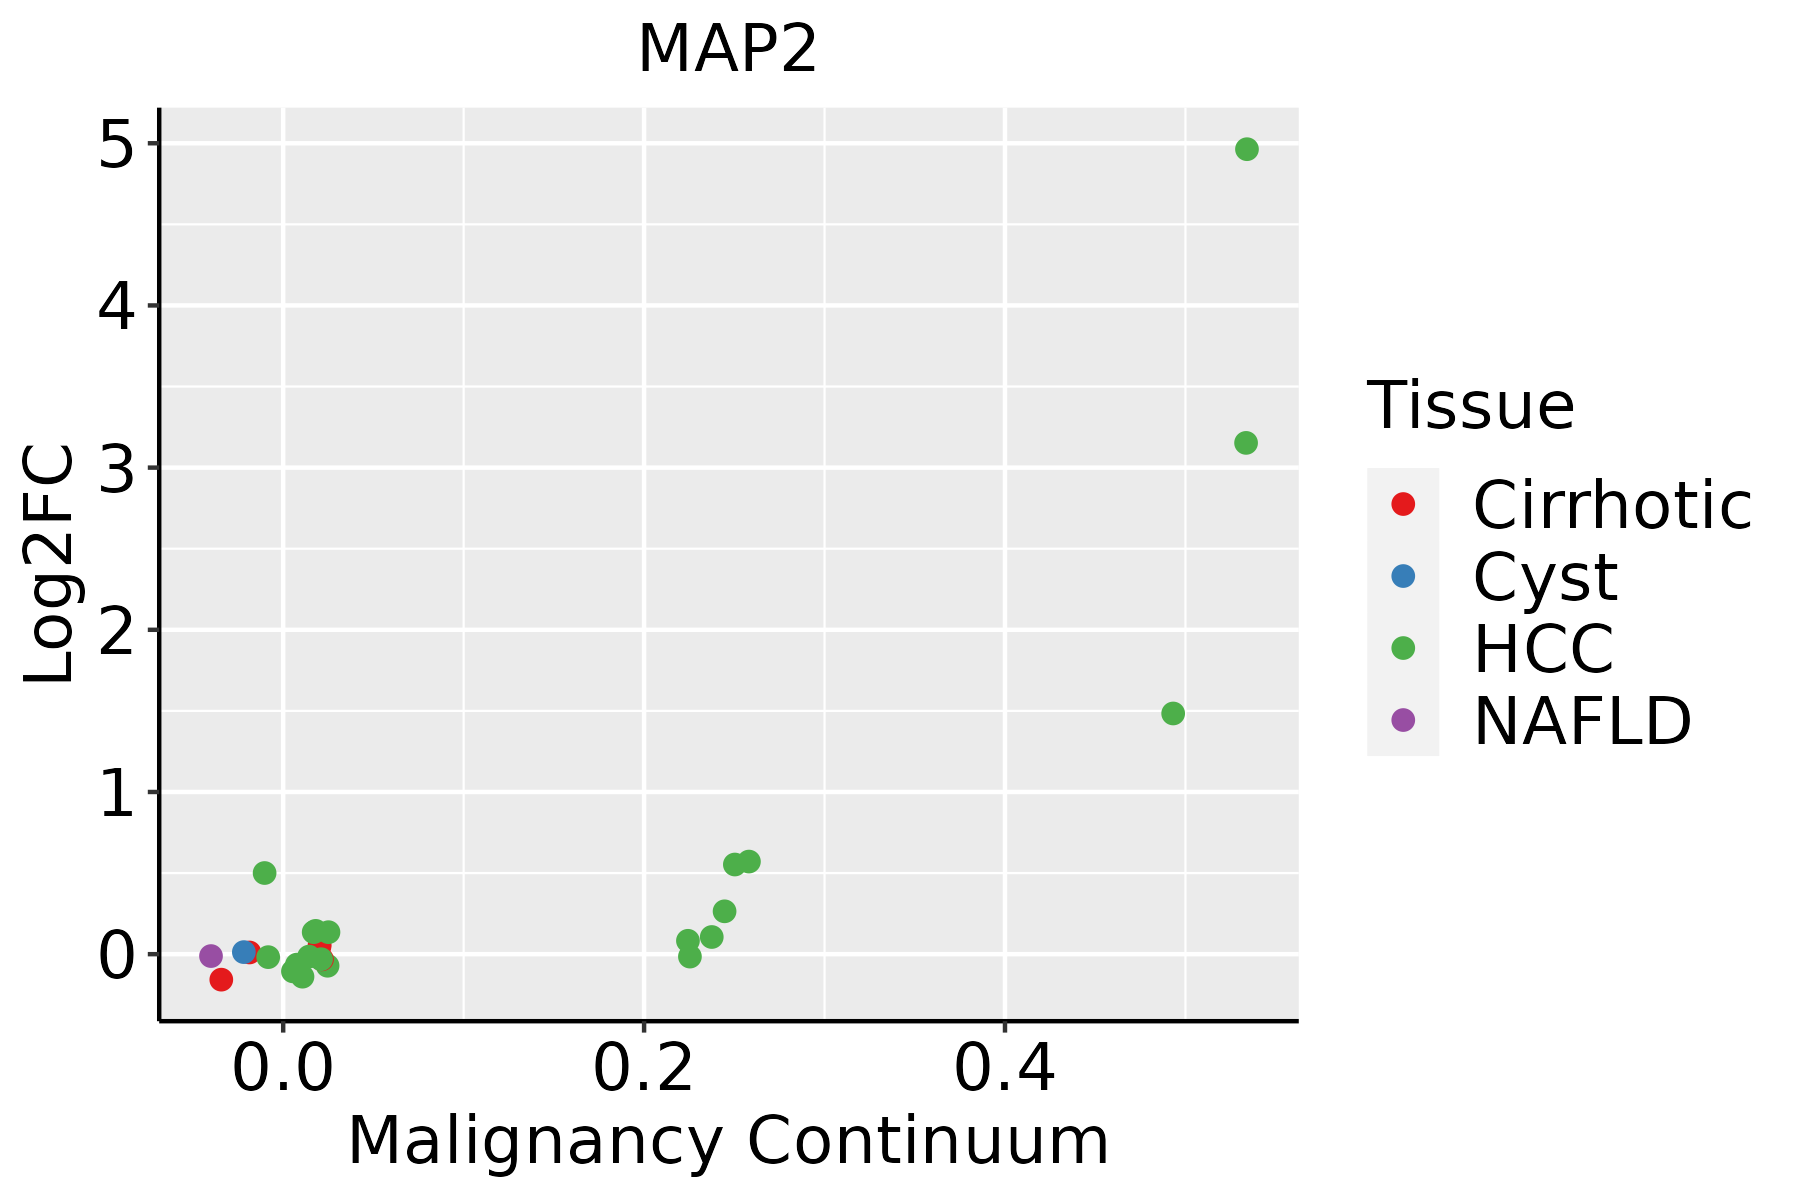 | HCC: Hepatocellular carcinoma |
| NAFLD: Non-alcoholic fatty liver disease | ||
| Prostate |  | BPH: Benign Prostatic Hyperplasia |
| Thyroid | 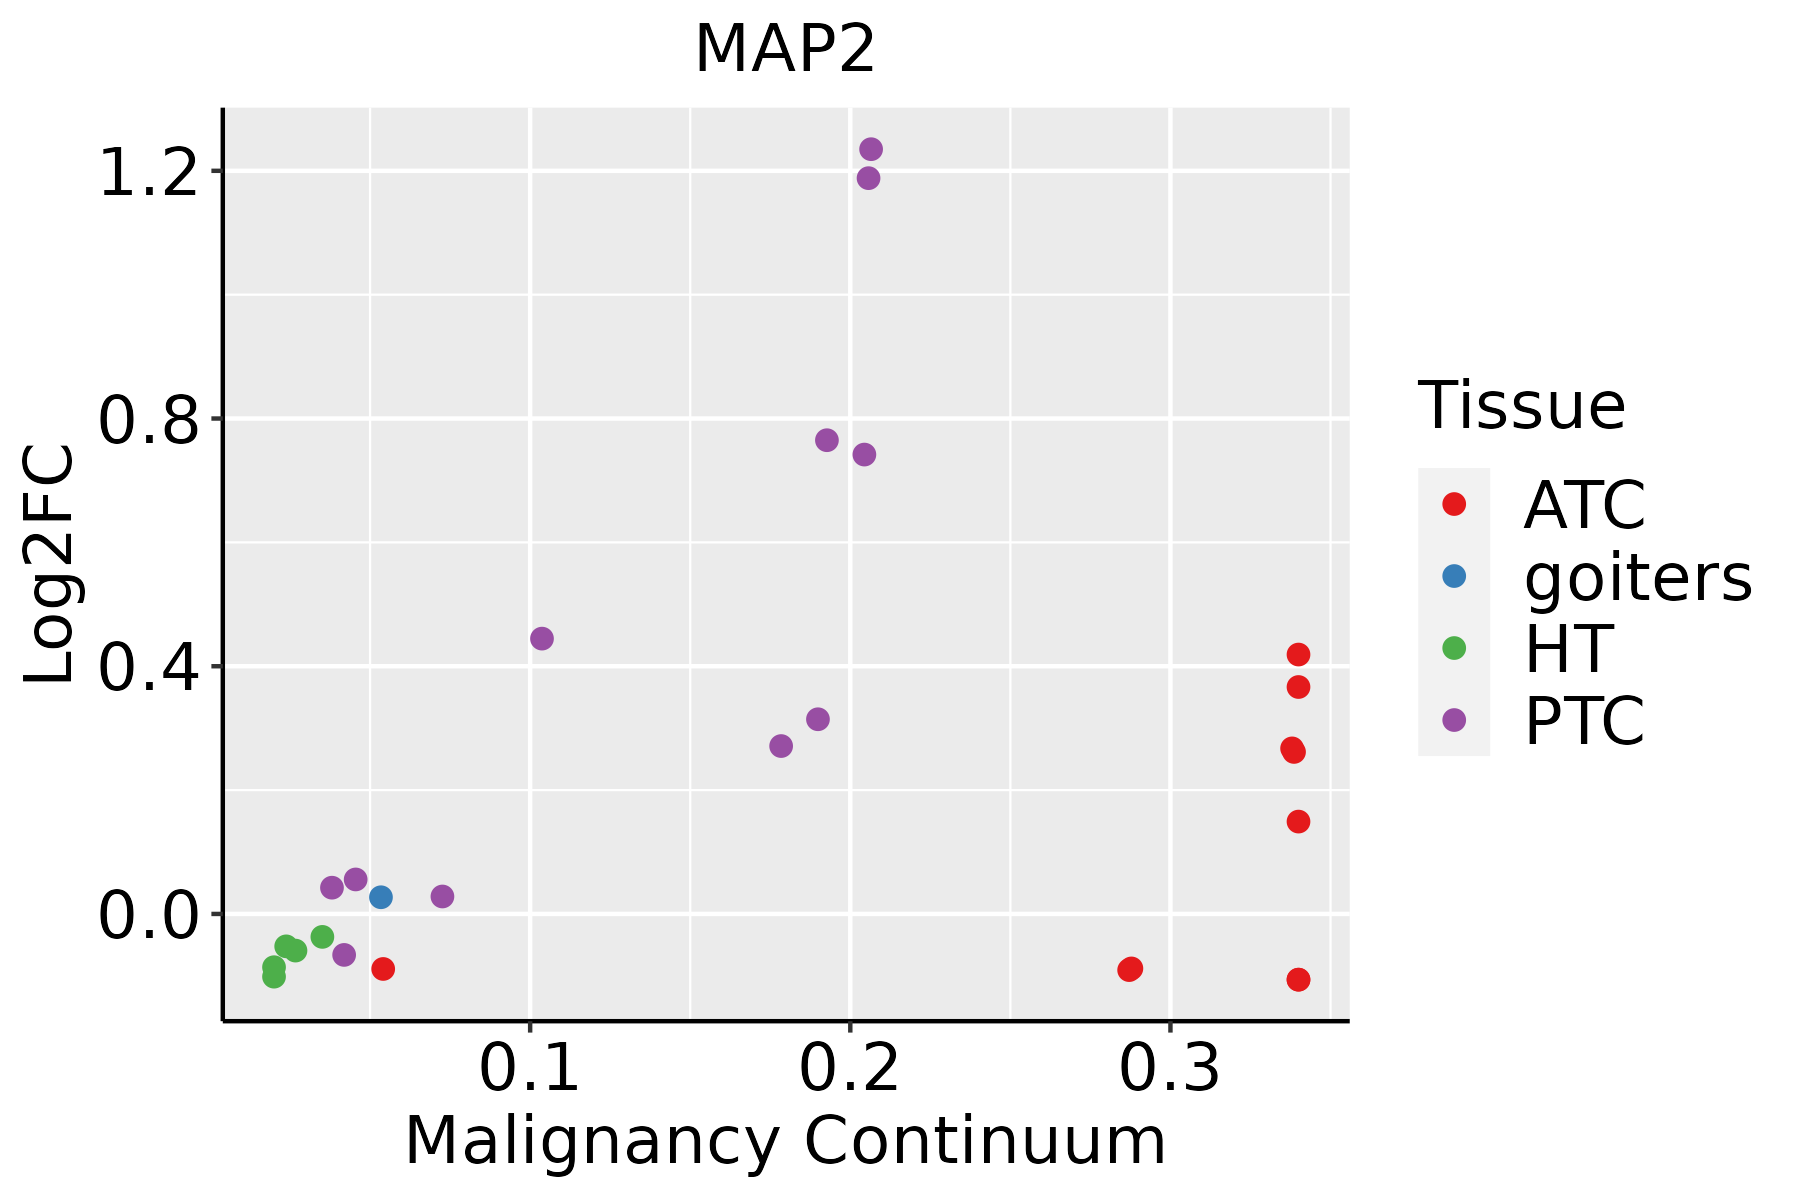 | ATC: Anaplastic thyroid cancer |
| HT: Hashimoto's thyroiditis | ||
| PTC: Papillary thyroid cancer |
| ∗log2FC in expression of this searched gene in stem-like cells from each diseased tissue sample relative to stem-like cells in normal samples in each tissue plotted against the malignancy continuum. Samples are colored based on if they are from different disease stage. |
Top |
Malignant transformation related pathway analysis |
| Find out the enriched GO biological processes and KEGG pathways involved in transition from healthy to precancer to cancer |
| Tissue | Disease Stage | Enriched GO biological Processes |
| Colorectum | AD |  |
| Colorectum | SER |  |
| Colorectum | MSS |  |
| Colorectum | MSI-H |  |
| Colorectum | FAP |  |
| ∗Top 15 enriched GO BP terms are showed in the bar plot of each disease state in each tissue. Each row represents a significant GO biological process which is colored according to the -log10(p.adjust). |
| Page: 1 2 3 4 5 6 7 8 9 |
| GO ID | Tissue | Disease Stage | Description | Gene Ratio | Bg Ratio | pvalue | p.adjust | Count |
| GO:00712146 | Lung | IAC | cellular response to abiotic stimulus | 58/2061 | 331/18723 | 2.30e-04 | 3.96e-03 | 58 |
| GO:01040046 | Lung | IAC | cellular response to environmental stimulus | 58/2061 | 331/18723 | 2.30e-04 | 3.96e-03 | 58 |
| GO:00303076 | Lung | IAC | positive regulation of cell growth | 34/2061 | 166/18723 | 2.52e-04 | 4.24e-03 | 34 |
| GO:00434103 | Lung | IAC | positive regulation of MAPK cascade | 78/2061 | 480/18723 | 2.72e-04 | 4.50e-03 | 78 |
| GO:0042692 | Lung | IAC | muscle cell differentiation | 65/2061 | 384/18723 | 2.75e-04 | 4.54e-03 | 65 |
| GO:19012168 | Lung | IAC | positive regulation of neuron death | 23/2061 | 97/18723 | 2.79e-04 | 4.56e-03 | 23 |
| GO:00434052 | Lung | IAC | regulation of MAP kinase activity | 35/2061 | 177/18723 | 4.15e-04 | 6.23e-03 | 35 |
| GO:00097438 | Lung | IAC | response to carbohydrate | 46/2061 | 253/18723 | 4.28e-04 | 6.37e-03 | 46 |
| GO:00075693 | Lung | IAC | cell aging | 28/2061 | 132/18723 | 4.73e-04 | 6.92e-03 | 28 |
| GO:00458618 | Lung | IAC | negative regulation of proteolysis | 58/2061 | 351/18723 | 1.04e-03 | 1.24e-02 | 58 |
| GO:00096125 | Lung | IAC | response to mechanical stimulus | 39/2061 | 216/18723 | 1.29e-03 | 1.45e-02 | 39 |
| GO:00030124 | Lung | IAC | muscle system process | 71/2061 | 452/18723 | 1.29e-03 | 1.45e-02 | 71 |
| GO:00514028 | Lung | IAC | neuron apoptotic process | 43/2061 | 246/18723 | 1.46e-03 | 1.57e-02 | 43 |
| GO:2001239 | Lung | IAC | regulation of extrinsic apoptotic signaling pathway in absence of ligand | 12/2061 | 43/18723 | 1.80e-03 | 1.85e-02 | 12 |
| GO:00506735 | Lung | IAC | epithelial cell proliferation | 68/2061 | 437/18723 | 2.05e-03 | 2.05e-02 | 68 |
| GO:1901099 | Lung | IAC | negative regulation of signal transduction in absence of ligand | 10/2061 | 33/18723 | 2.18e-03 | 2.15e-02 | 10 |
| GO:2001240 | Lung | IAC | negative regulation of extrinsic apoptotic signaling pathway in absence of ligand | 10/2061 | 33/18723 | 2.18e-03 | 2.15e-02 | 10 |
| GO:20001178 | Lung | IAC | negative regulation of cysteine-type endopeptidase activity | 19/2061 | 86/18723 | 2.22e-03 | 2.18e-02 | 19 |
| GO:00380932 | Lung | IAC | Fc receptor signaling pathway | 13/2061 | 50/18723 | 2.38e-03 | 2.30e-02 | 13 |
| GO:00511462 | Lung | IAC | striated muscle cell differentiation | 47/2061 | 283/18723 | 2.66e-03 | 2.45e-02 | 47 |
| Page: 1 2 3 4 5 6 7 8 9 10 11 12 13 14 15 16 17 18 19 20 21 22 23 24 25 26 27 28 29 30 31 32 33 34 35 36 37 38 39 40 41 42 43 44 45 46 47 48 49 50 51 52 53 54 55 56 57 58 59 60 61 62 63 64 65 66 67 68 69 70 71 72 73 74 75 76 77 78 79 80 81 82 83 84 85 86 87 88 89 90 91 92 93 94 95 96 97 98 99 100 101 102 |
| Pathway ID | Tissue | Disease Stage | Description | Gene Ratio | Bg Ratio | pvalue | p.adjust | qvalue | Count |
| Page: 1 |
Top |
Cell-cell communication analysis |
| Identification of potential cell-cell interactions between two cell types and their ligand-receptor pairs for different disease states |
| Ligand | Receptor | LRpair | Pathway | Tissue | Disease Stage |
| Page: 1 |
Top |
Single-cell gene regulatory network inference analysis |
| Find out the significant the regulons (TFs) and the target genes of each regulon across cell types for different disease states |
| TF | Cell Type | Tissue | Disease Stage | Target Gene | RSS | Regulon Activity |
| ∗The dot plots of a searched regulon are shown for all cell subpopulations in each disease state of each tissue based on the regulon specific score inferred using pySCENIC and by calculating the average expression. |
| Page: 1 |
Top |
Somatic mutation of malignant transformation related genes |
| Annotation of somatic variants for genes involved in malignant transformation |
| Hugo Symbol | Variant Class | Variant Classification | dbSNP RS | HGVSc | HGVSp | HGVSp Short | SWISSPROT | BIOTYPE | SIFT | PolyPhen | Tumor Sample Barcode | Tissue | Histology | Sex | Age | Stage | Therapy Types | Drugs | Outcome |
| MAP2 | SNV | Missense_Mutation | c.5158G>A | p.Gly1720Ser | p.G1720S | P11137 | protein_coding | deleterious(0) | probably_damaging(1) | TCGA-A2-A04W-01 | Breast | breast invasive carcinoma | Female | <65 | I/II | Chemotherapy | cytoxan | SD | |
| MAP2 | SNV | Missense_Mutation | novel | c.5438N>G | p.Thr1813Ser | p.T1813S | P11137 | protein_coding | deleterious(0) | probably_damaging(0.993) | TCGA-A2-A04Y-01 | Breast | breast invasive carcinoma | Female | <65 | I/II | Chemotherapy | cytoxan | SD |
| MAP2 | SNV | Missense_Mutation | c.1633N>C | p.Asp545His | p.D545H | P11137 | protein_coding | deleterious_low_confidence(0) | possibly_damaging(0.771) | TCGA-A7-A26H-01 | Breast | breast invasive carcinoma | Female | >=65 | I/II | Hormone Therapy | anastrozole | PD | |
| MAP2 | SNV | Missense_Mutation | rs780652765 | c.4724G>A | p.Arg1575Gln | p.R1575Q | P11137 | protein_coding | deleterious(0) | probably_damaging(0.995) | TCGA-A7-A426-01 | Breast | breast invasive carcinoma | Female | <65 | III/IV | Chemotherapy | adriamycin | SD |
| MAP2 | SNV | Missense_Mutation | c.2813A>G | p.His938Arg | p.H938R | P11137 | protein_coding | tolerated_low_confidence(0.89) | benign(0.038) | TCGA-A8-A06Q-01 | Breast | breast invasive carcinoma | Female | <65 | III/IV | Unknown | Unknown | SD | |
| MAP2 | SNV | Missense_Mutation | c.2342N>T | p.Gln781Leu | p.Q781L | P11137 | protein_coding | deleterious(0) | benign(0.129) | TCGA-A8-A08F-01 | Breast | breast invasive carcinoma | Female | <65 | III/IV | Chemotherapy | 5-fluorouracil | CR | |
| MAP2 | SNV | Missense_Mutation | novel | c.2427N>T | p.Met809Ile | p.M809I | P11137 | protein_coding | deleterious(0) | probably_damaging(0.931) | TCGA-A8-A09A-01 | Breast | breast invasive carcinoma | Female | <65 | I/II | Hormone Therapy | tamoxiphen | SD |
| MAP2 | SNV | Missense_Mutation | novel | c.4259N>T | p.Ser1420Leu | p.S1420L | P11137 | protein_coding | deleterious(0) | benign(0.015) | TCGA-AC-A23C-01 | Breast | breast invasive carcinoma | Female | <65 | I/II | Chemotherapy | chemo | CR |
| MAP2 | SNV | Missense_Mutation | c.1849N>A | p.Asp617Asn | p.D617N | P11137 | protein_coding | deleterious_low_confidence(0.01) | benign(0.31) | TCGA-AC-A23H-01 | Breast | breast invasive carcinoma | Female | >=65 | I/II | Unknown | Unknown | PD | |
| MAP2 | SNV | Missense_Mutation | novel | c.343N>G | p.Gln115Glu | p.Q115E | P11137 | protein_coding | deleterious_low_confidence(0.03) | probably_damaging(0.977) | TCGA-AC-A5XS-01 | Breast | breast invasive carcinoma | Female | >=65 | I/II | Hormone Therapy | femara | SD |
| Page: 1 2 3 4 5 6 7 8 9 10 11 12 13 14 15 16 17 18 19 20 21 22 23 24 25 26 27 28 29 30 31 32 33 |
Top |
Related drugs of malignant transformation related genes |
| Identification of chemicals and drugs interact with genes involved in malignant transfromation |
| (DGIdb 4.0) |
| Entrez ID | Symbol | Category | Interaction Types | Drug Claim Name | Drug Name | PMIDs |
| 4133 | MAP2 | NA | MELATONIN | MELATONIN | 8829136 | |
| 4133 | MAP2 | NA | COLCHICINE | COLCHICINE | 7511033 |
| Page: 1 |

Copyright 2023-Present -The University of Texas Health Science Center at Houston |