
|
|||||
|
 | |
| |
| |
| |
| |
| |
|
Gene: GCLC |
Gene summary for GCLC |
| Gene information | Species | Human | Gene symbol | GCLC | Gene ID | 2729 |
| Gene name | glutamate-cysteine ligase catalytic subunit | |
| Gene Alias | GCL | |
| Cytomap | 6p12.1 | |
| Gene Type | protein-coding | GO ID | GO:0000096 | UniProtAcc | E1CEI4 |
Top |
Malignant transformation analysis |
| Identification of the aberrant gene expression in precancerous and cancerous lesions by comparing the gene expression of stem-like cells in diseased tissues with normal stem cells |
| Entrez ID | Symbol | Replicates | Species | Organ | Tissue | Adj P-value | Log2FC | Malignancy |
| 2729 | GCLC | AEH-subject3 | Human | Endometrium | AEH | 7.12e-07 | 4.20e-01 | -0.2576 |
| 2729 | GCLC | AEH-subject5 | Human | Endometrium | AEH | 2.63e-03 | -2.05e-01 | -0.2953 |
| 2729 | GCLC | EEC-subject1 | Human | Endometrium | EEC | 2.29e-08 | 3.95e-01 | -0.2682 |
| 2729 | GCLC | EEC-subject2 | Human | Endometrium | EEC | 2.56e-02 | -1.50e-01 | -0.2607 |
| 2729 | GCLC | EEC-subject3 | Human | Endometrium | EEC | 6.21e-09 | -1.87e-01 | -0.2525 |
| 2729 | GCLC | EEC-subject4 | Human | Endometrium | EEC | 3.18e-03 | -2.29e-01 | -0.2571 |
| 2729 | GCLC | GSM5276934 | Human | Endometrium | EEC | 3.02e-06 | -2.58e-01 | -0.0913 |
| 2729 | GCLC | GSM5276935 | Human | Endometrium | EEC | 5.44e-04 | -2.66e-01 | -0.123 |
| 2729 | GCLC | GSM6177620_NYU_UCEC1_lib1_lib1 | Human | Endometrium | EEC | 8.28e-07 | -1.87e-01 | -0.1869 |
| 2729 | GCLC | GSM6177620_NYU_UCEC1_lib2_lib2 | Human | Endometrium | EEC | 4.34e-06 | -2.81e-01 | -0.1875 |
| 2729 | GCLC | GSM6177620_NYU_UCEC1_lib3_lib3 | Human | Endometrium | EEC | 5.18e-06 | -2.76e-01 | -0.1883 |
| 2729 | GCLC | GSM6177621_NYU_UCEC2_lib1_lib1 | Human | Endometrium | EEC | 8.64e-08 | -5.66e-02 | -0.1934 |
| 2729 | GCLC | GSM6177622_NYU_UCEC3_lib1_lib1 | Human | Endometrium | EEC | 2.90e-22 | -3.02e-01 | -0.1917 |
| 2729 | GCLC | GSM6177622_NYU_UCEC3_lib2_lib2 | Human | Endometrium | EEC | 1.68e-16 | -3.19e-01 | -0.1916 |
| 2729 | GCLC | GSM6177623_NYU_UCEC3_Vis | Human | Endometrium | EEC | 7.12e-05 | -2.15e-01 | -0.1269 |
| 2729 | GCLC | LZE2T | Human | Esophagus | ESCC | 1.47e-15 | 2.51e+00 | 0.082 |
| 2729 | GCLC | LZE4T | Human | Esophagus | ESCC | 7.03e-07 | 4.40e-01 | 0.0811 |
| 2729 | GCLC | LZE7T | Human | Esophagus | ESCC | 1.75e-10 | 9.94e-01 | 0.0667 |
| 2729 | GCLC | LZE24T | Human | Esophagus | ESCC | 1.59e-12 | 6.65e-01 | 0.0596 |
| 2729 | GCLC | LZE21T | Human | Esophagus | ESCC | 1.45e-07 | 8.55e-01 | 0.0655 |
| Page: 1 2 3 4 5 6 |
| Tissue | Expression Dynamics | Abbreviation |
| Endometrium | 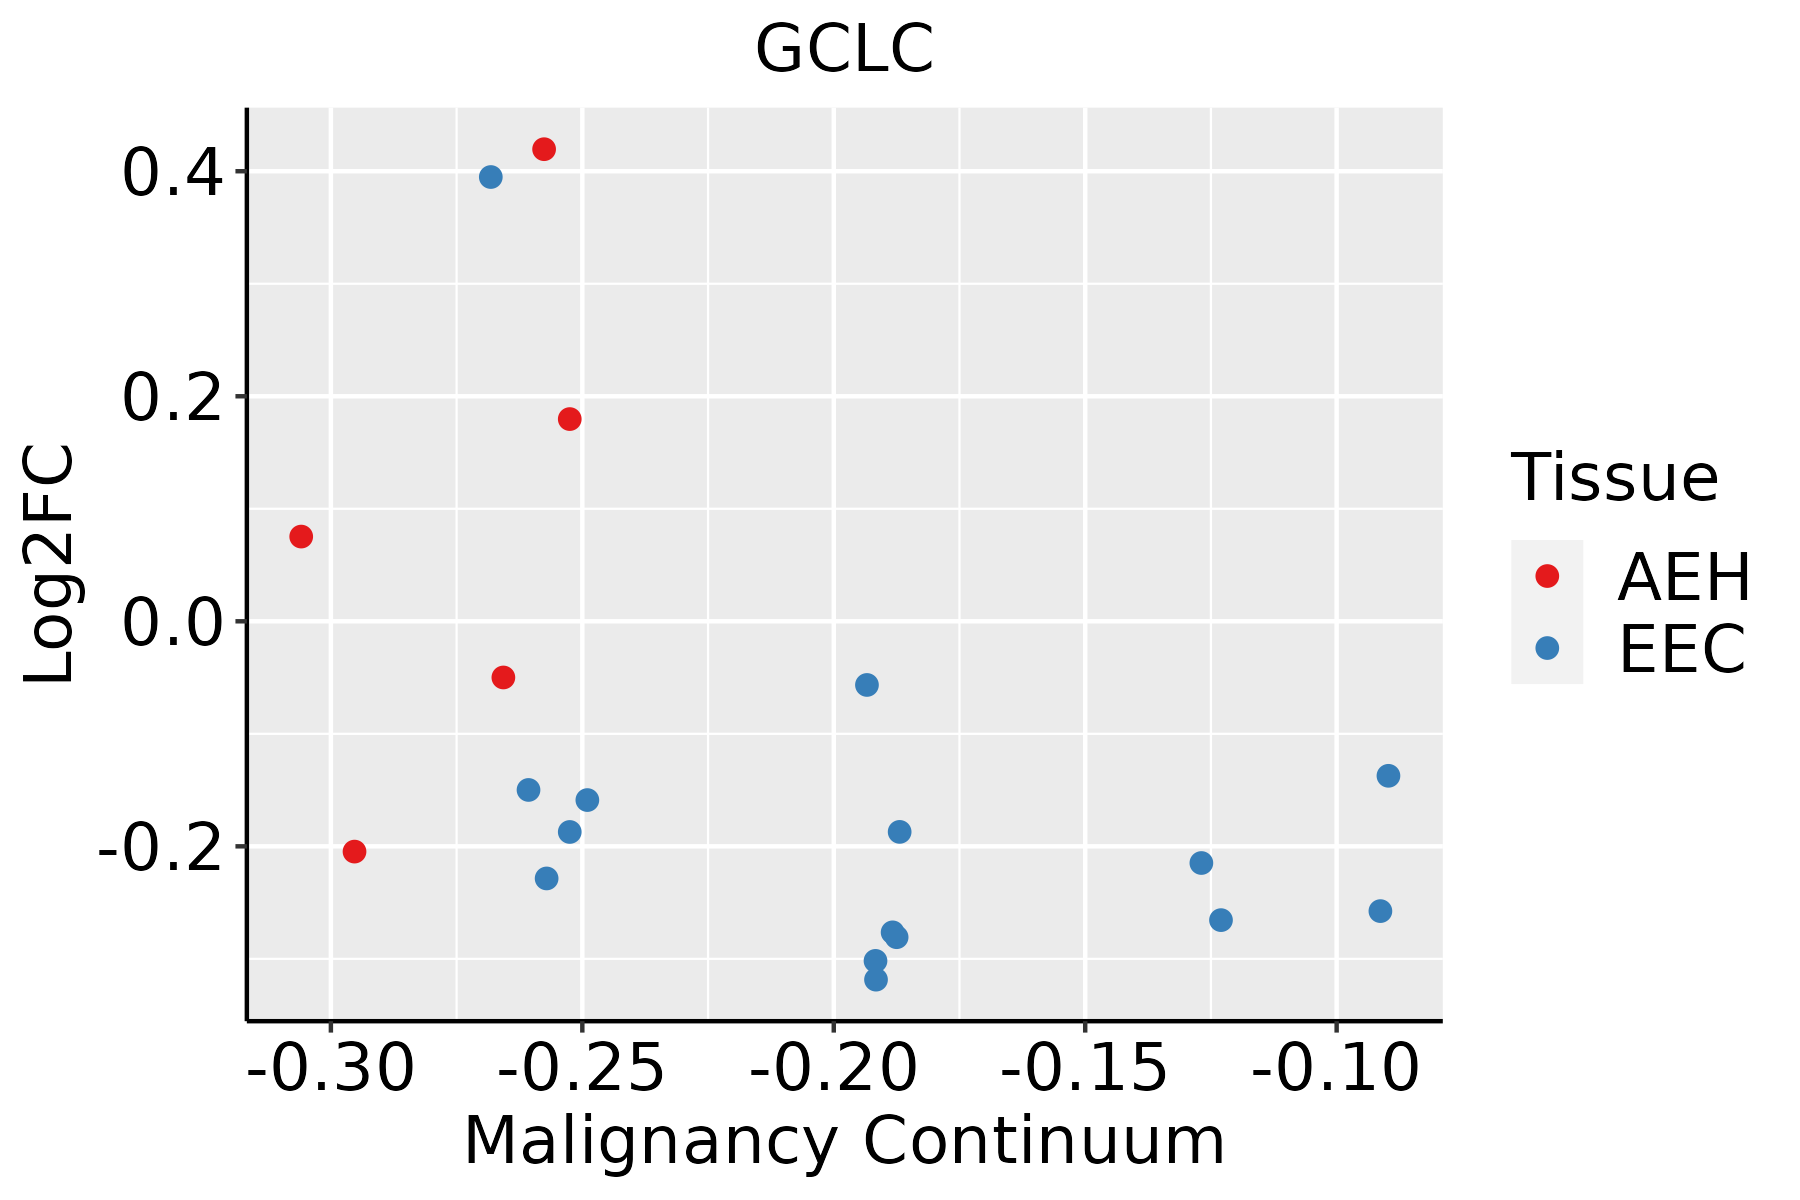 | AEH: Atypical endometrial hyperplasia |
| EEC: Endometrioid Cancer | ||
| Esophagus | 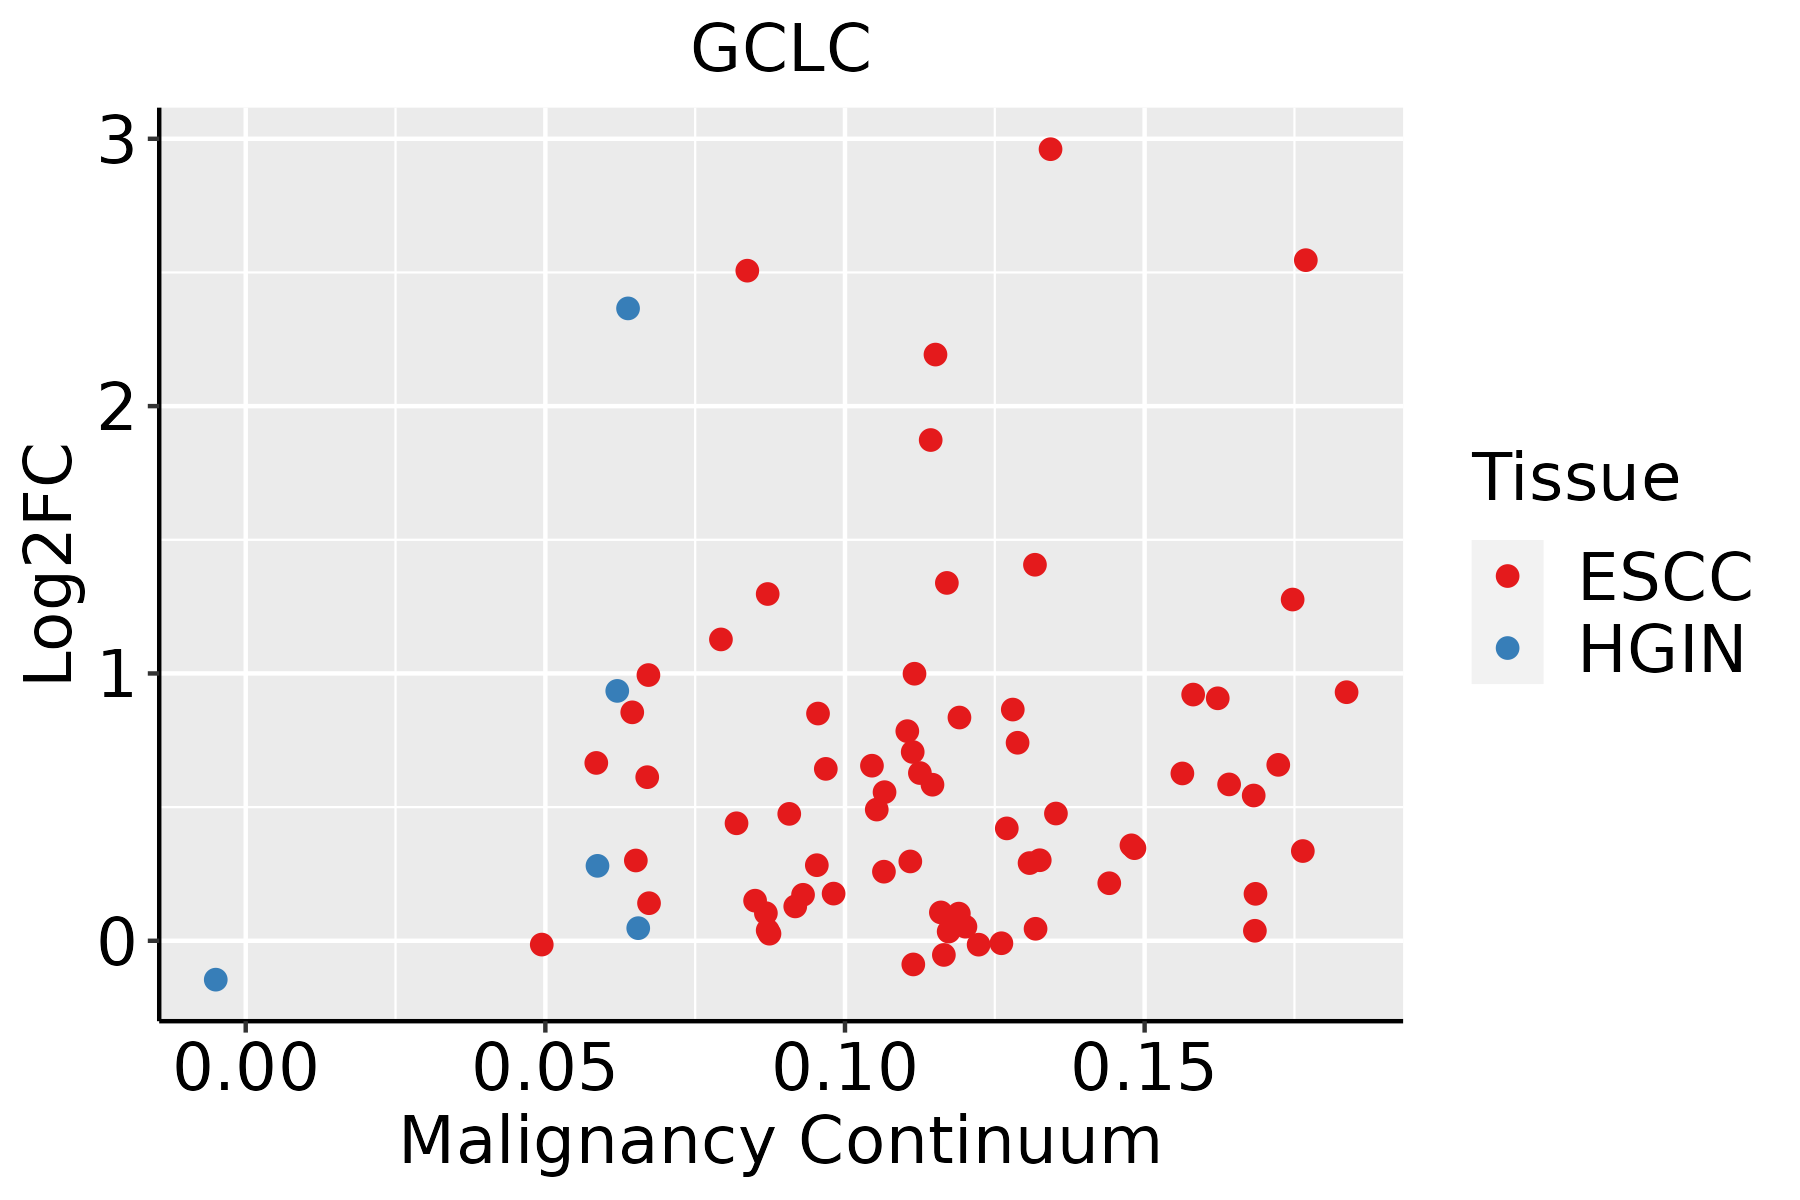 | ESCC: Esophageal squamous cell carcinoma |
| HGIN: High-grade intraepithelial neoplasias | ||
| LGIN: Low-grade intraepithelial neoplasias | ||
| GC |  | CAG: Chronic atrophic gastritis |
| CAG with IM: Chronic atrophic gastritis with intestinal metaplasia | ||
| CSG: Chronic superficial gastritis | ||
| GC: Gastric cancer | ||
| SIM: Severe intestinal metaplasia | ||
| WIM: Wild intestinal metaplasia | ||
| Liver | 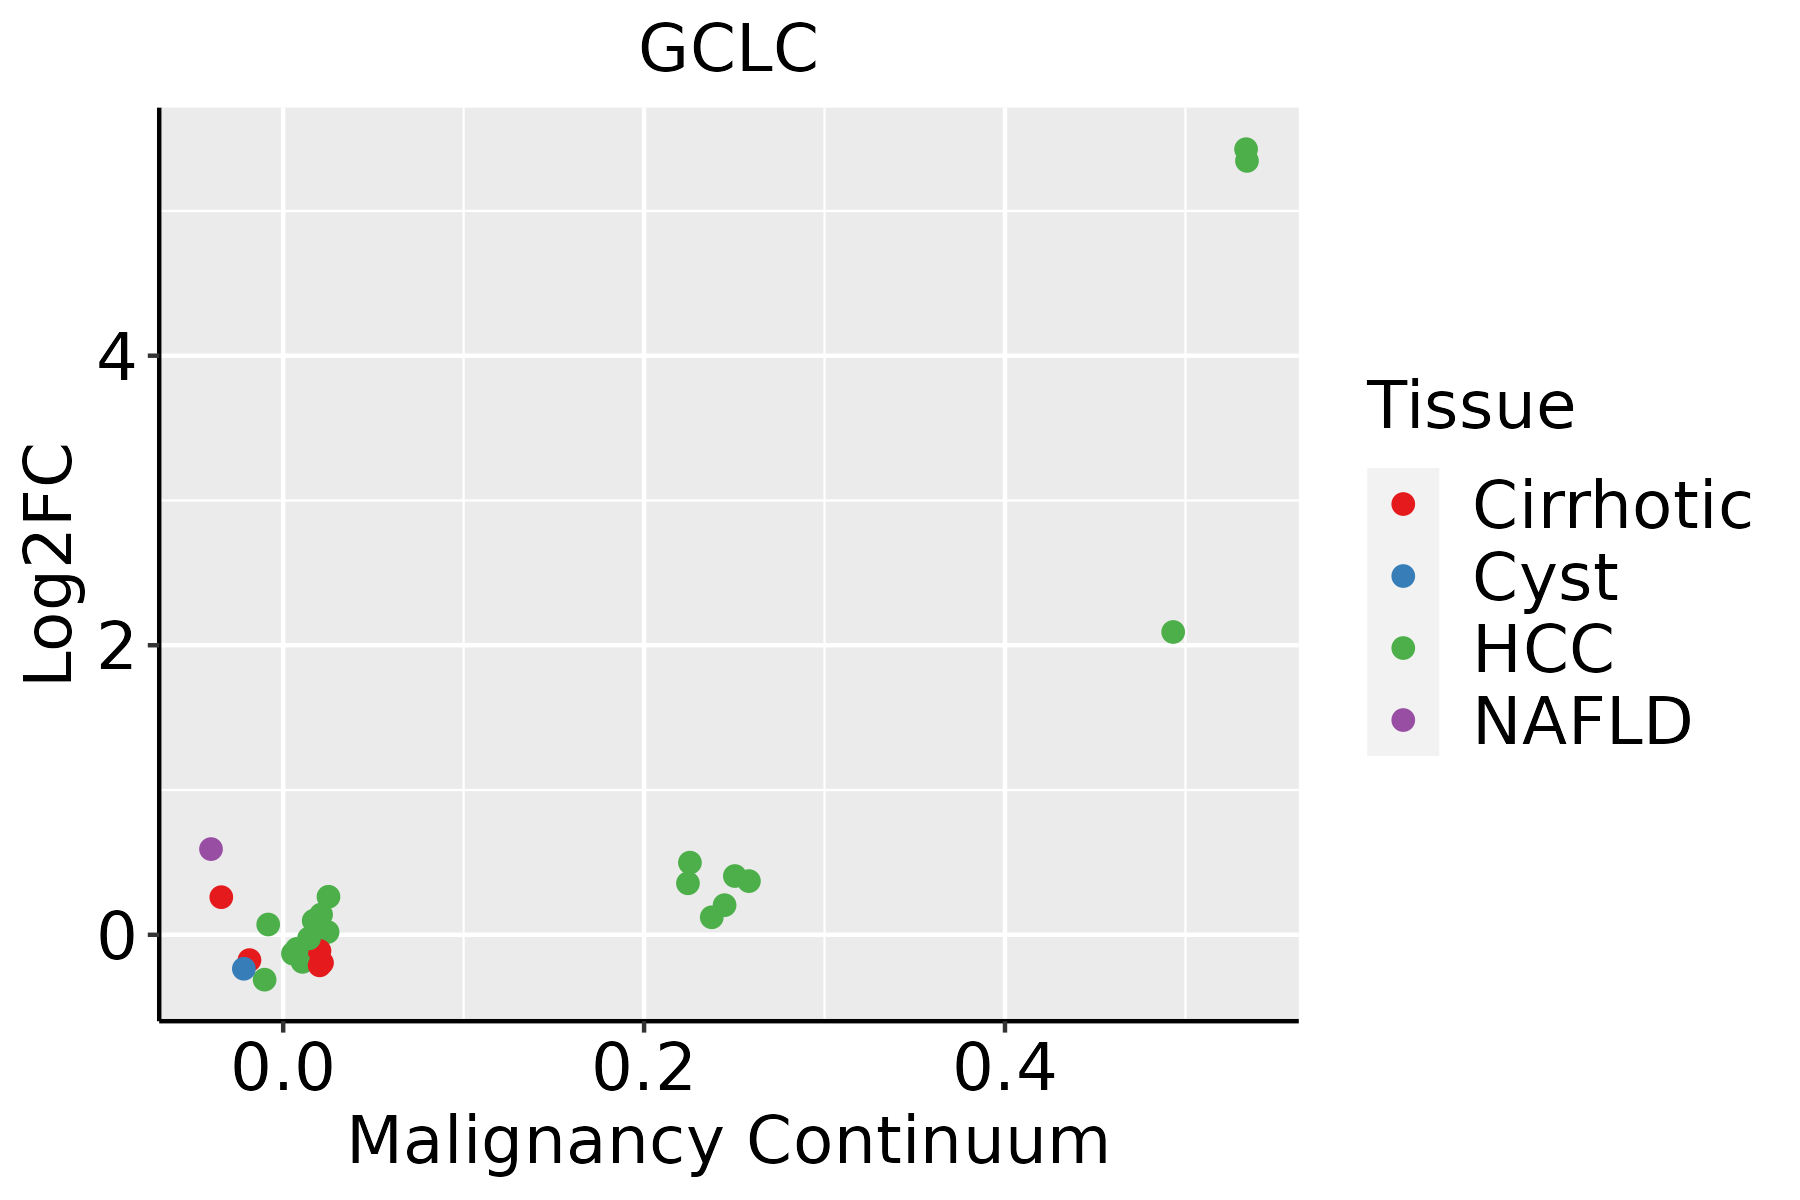 | HCC: Hepatocellular carcinoma |
| NAFLD: Non-alcoholic fatty liver disease | ||
| Oral Cavity | 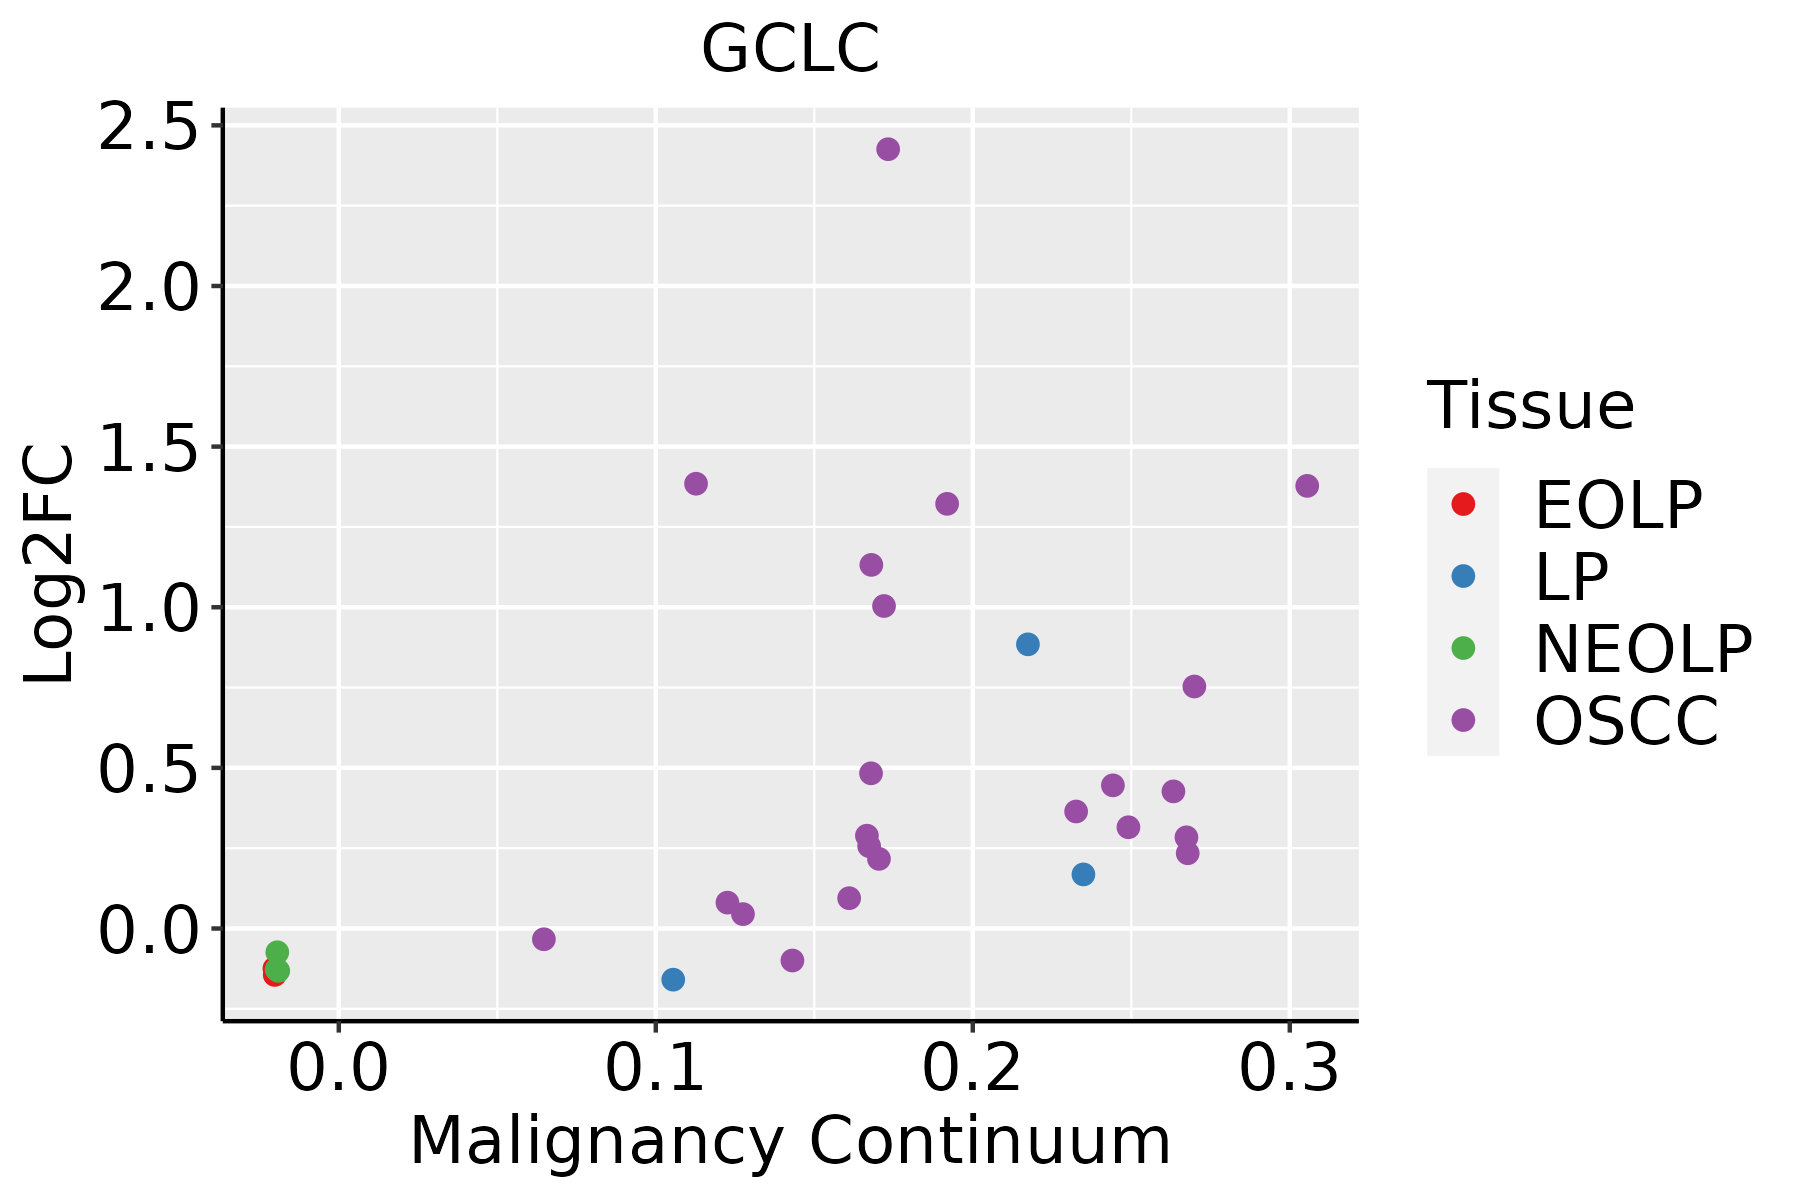 | EOLP: Erosive Oral lichen planus |
| LP: leukoplakia | ||
| NEOLP: Non-erosive oral lichen planus | ||
| OSCC: Oral squamous cell carcinoma | ||
| Skin |  | AK: Actinic keratosis |
| cSCC: Cutaneous squamous cell carcinoma | ||
| SCCIS:squamous cell carcinoma in situ | ||
| Thyroid | 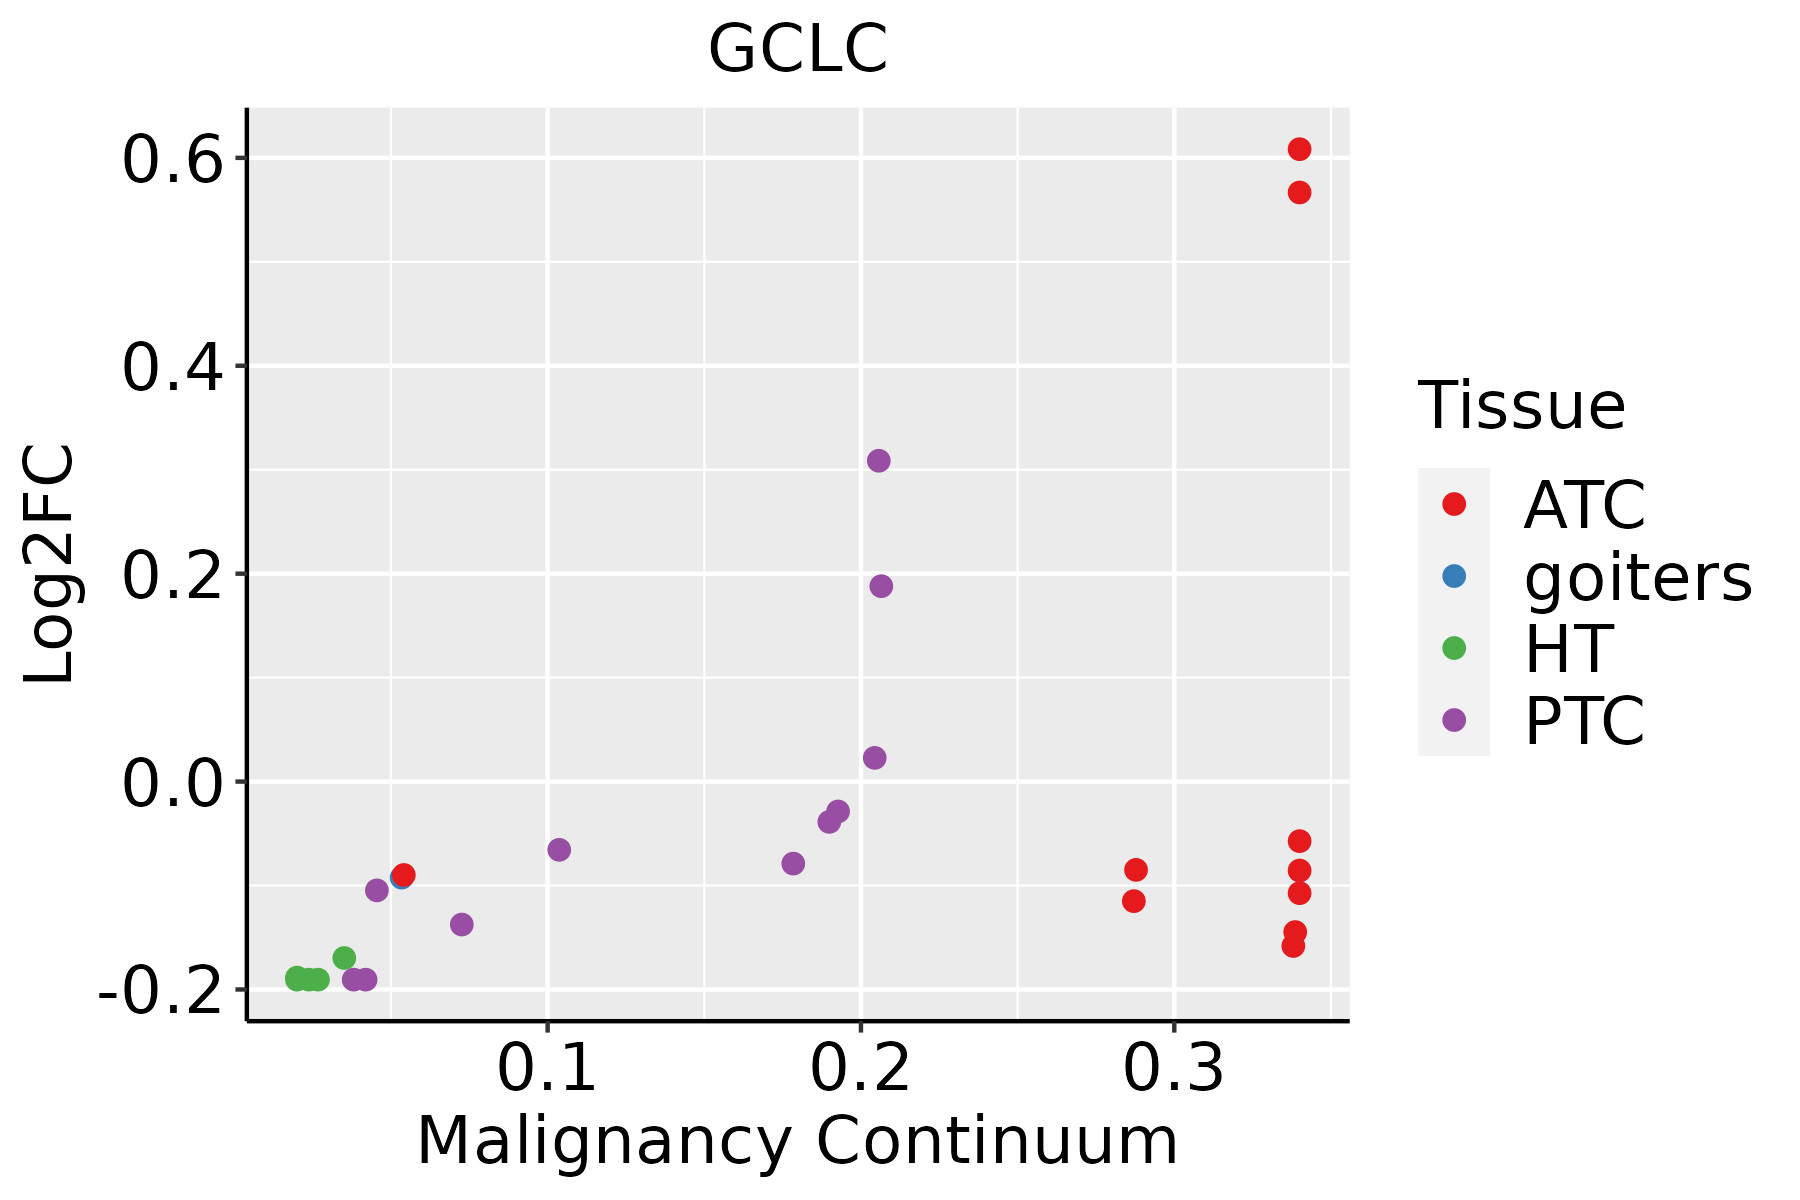 | ATC: Anaplastic thyroid cancer |
| HT: Hashimoto's thyroiditis | ||
| PTC: Papillary thyroid cancer |
| ∗log2FC in expression of this searched gene in stem-like cells from each diseased tissue sample relative to stem-like cells in normal samples in each tissue plotted against the malignancy continuum. Samples are colored based on if they are from different disease stage. |
Top |
Malignant transformation related pathway analysis |
| Find out the enriched GO biological processes and KEGG pathways involved in transition from healthy to precancer to cancer |
| Tissue | Disease Stage | Enriched GO biological Processes |
| Colorectum | AD |  |
| Colorectum | SER |  |
| Colorectum | MSS |  |
| Colorectum | MSI-H |  |
| Colorectum | FAP |  |
| ∗Top 15 enriched GO BP terms are showed in the bar plot of each disease state in each tissue. Each row represents a significant GO biological process which is colored according to the -log10(p.adjust). |
| Page: 1 2 3 4 5 6 7 8 9 |
| GO ID | Tissue | Disease Stage | Description | Gene Ratio | Bg Ratio | pvalue | p.adjust | Count |
| GO:004668621 | Stomach | CSG | response to cadmium ion | 14/1034 | 68/18723 | 1.69e-05 | 5.19e-04 | 14 |
| GO:003166721 | Stomach | CSG | response to nutrient levels | 49/1034 | 474/18723 | 1.83e-05 | 5.57e-04 | 49 |
| GO:004586221 | Stomach | CSG | positive regulation of proteolysis | 41/1034 | 372/18723 | 2.00e-05 | 5.98e-04 | 41 |
| GO:001082121 | Stomach | CSG | regulation of mitochondrion organization | 21/1034 | 144/18723 | 4.29e-05 | 1.12e-03 | 21 |
| GO:001082321 | Stomach | CSG | negative regulation of mitochondrion organization | 11/1034 | 49/18723 | 5.80e-05 | 1.46e-03 | 11 |
| GO:000700621 | Stomach | CSG | mitochondrial membrane organization | 18/1034 | 116/18723 | 6.51e-05 | 1.61e-03 | 18 |
| GO:200123721 | Stomach | CSG | negative regulation of extrinsic apoptotic signaling pathway | 16/1034 | 97/18723 | 7.75e-05 | 1.84e-03 | 16 |
| GO:007133321 | Stomach | CSG | cellular response to glucose stimulus | 21/1034 | 151/18723 | 8.68e-05 | 2.03e-03 | 21 |
| GO:19010282 | Stomach | CSG | regulation of mitochondrial outer membrane permeabilization involved in apoptotic signaling pathway | 7/1034 | 21/18723 | 9.01e-05 | 2.07e-03 | 7 |
| GO:004259321 | Stomach | CSG | glucose homeostasis | 30/1034 | 258/18723 | 9.62e-05 | 2.18e-03 | 30 |
| GO:200005821 | Stomach | CSG | regulation of ubiquitin-dependent protein catabolic process | 22/1034 | 164/18723 | 1.03e-04 | 2.27e-03 | 22 |
| GO:003350021 | Stomach | CSG | carbohydrate homeostasis | 30/1034 | 259/18723 | 1.03e-04 | 2.28e-03 | 30 |
| GO:007133121 | Stomach | CSG | cellular response to hexose stimulus | 21/1034 | 153/18723 | 1.05e-04 | 2.29e-03 | 21 |
| GO:007132621 | Stomach | CSG | cellular response to monosaccharide stimulus | 21/1034 | 154/18723 | 1.15e-04 | 2.47e-03 | 21 |
| GO:003243421 | Stomach | CSG | regulation of proteasomal ubiquitin-dependent protein catabolic process | 19/1034 | 134/18723 | 1.43e-04 | 2.97e-03 | 19 |
| GO:004690221 | Stomach | CSG | regulation of mitochondrial membrane permeability | 12/1034 | 63/18723 | 1.48e-04 | 3.03e-03 | 12 |
| GO:00067492 | Stomach | CSG | glutathione metabolic process | 12/1034 | 64/18723 | 1.73e-04 | 3.37e-03 | 12 |
| GO:003133121 | Stomach | CSG | positive regulation of cellular catabolic process | 42/1034 | 427/18723 | 2.13e-04 | 4.04e-03 | 42 |
| GO:001063921 | Stomach | CSG | negative regulation of organelle organization | 36/1034 | 348/18723 | 2.25e-04 | 4.25e-03 | 36 |
| GO:190305021 | Stomach | CSG | regulation of proteolysis involved in cellular protein catabolic process | 26/1034 | 221/18723 | 2.27e-04 | 4.26e-03 | 26 |
| Page: 1 2 3 4 5 6 7 8 9 10 11 12 13 14 15 16 17 18 19 20 21 22 23 24 25 26 27 28 29 30 31 32 33 34 35 36 37 38 39 40 41 42 43 44 45 46 47 48 49 50 51 52 53 54 55 56 57 58 59 60 61 62 63 64 65 |
| Pathway ID | Tissue | Disease Stage | Description | Gene Ratio | Bg Ratio | pvalue | p.adjust | qvalue | Count |
| hsa0421625 | Endometrium | EEC | Ferroptosis | 16/1237 | 41/8465 | 1.09e-04 | 1.08e-03 | 8.08e-04 | 16 |
| hsa002704 | Endometrium | EEC | Cysteine and methionine metabolism | 15/1237 | 52/8465 | 6.02e-03 | 3.12e-02 | 2.33e-02 | 15 |
| hsa0421635 | Endometrium | EEC | Ferroptosis | 16/1237 | 41/8465 | 1.09e-04 | 1.08e-03 | 8.08e-04 | 16 |
| hsa0027011 | Endometrium | EEC | Cysteine and methionine metabolism | 15/1237 | 52/8465 | 6.02e-03 | 3.12e-02 | 2.33e-02 | 15 |
| hsa0048018 | Esophagus | ESCC | Glutathione metabolism | 44/4205 | 57/8465 | 1.81e-05 | 9.03e-05 | 4.63e-05 | 44 |
| hsa0421629 | Esophagus | ESCC | Ferroptosis | 33/4205 | 41/8465 | 4.58e-05 | 1.99e-04 | 1.02e-04 | 33 |
| hsa012405 | Esophagus | ESCC | Biosynthesis of cofactors | 97/4205 | 153/8465 | 3.88e-04 | 1.35e-03 | 6.94e-04 | 97 |
| hsa0048019 | Esophagus | ESCC | Glutathione metabolism | 44/4205 | 57/8465 | 1.81e-05 | 9.03e-05 | 4.63e-05 | 44 |
| hsa0421638 | Esophagus | ESCC | Ferroptosis | 33/4205 | 41/8465 | 4.58e-05 | 1.99e-04 | 1.02e-04 | 33 |
| hsa0124012 | Esophagus | ESCC | Biosynthesis of cofactors | 97/4205 | 153/8465 | 3.88e-04 | 1.35e-03 | 6.94e-04 | 97 |
| hsa042168 | Liver | NAFLD | Ferroptosis | 12/1043 | 41/8465 | 2.98e-03 | 2.96e-02 | 2.39e-02 | 12 |
| hsa0421611 | Liver | NAFLD | Ferroptosis | 12/1043 | 41/8465 | 2.98e-03 | 2.96e-02 | 2.39e-02 | 12 |
| hsa004809 | Liver | Cirrhotic | Glutathione metabolism | 30/2530 | 57/8465 | 2.63e-04 | 1.72e-03 | 1.06e-03 | 30 |
| hsa01240 | Liver | Cirrhotic | Biosynthesis of cofactors | 66/2530 | 153/8465 | 3.11e-04 | 1.99e-03 | 1.23e-03 | 66 |
| hsa0421621 | Liver | Cirrhotic | Ferroptosis | 23/2530 | 41/8465 | 4.09e-04 | 2.57e-03 | 1.58e-03 | 23 |
| hsa00270 | Liver | Cirrhotic | Cysteine and methionine metabolism | 27/2530 | 52/8465 | 6.98e-04 | 4.15e-03 | 2.56e-03 | 27 |
| hsa0048012 | Liver | Cirrhotic | Glutathione metabolism | 30/2530 | 57/8465 | 2.63e-04 | 1.72e-03 | 1.06e-03 | 30 |
| hsa012401 | Liver | Cirrhotic | Biosynthesis of cofactors | 66/2530 | 153/8465 | 3.11e-04 | 1.99e-03 | 1.23e-03 | 66 |
| hsa0421631 | Liver | Cirrhotic | Ferroptosis | 23/2530 | 41/8465 | 4.09e-04 | 2.57e-03 | 1.58e-03 | 23 |
| hsa002701 | Liver | Cirrhotic | Cysteine and methionine metabolism | 27/2530 | 52/8465 | 6.98e-04 | 4.15e-03 | 2.56e-03 | 27 |
| Page: 1 2 |
Top |
Cell-cell communication analysis |
| Identification of potential cell-cell interactions between two cell types and their ligand-receptor pairs for different disease states |
| Ligand | Receptor | LRpair | Pathway | Tissue | Disease Stage |
| Page: 1 |
Top |
Single-cell gene regulatory network inference analysis |
| Find out the significant the regulons (TFs) and the target genes of each regulon across cell types for different disease states |
| TF | Cell Type | Tissue | Disease Stage | Target Gene | RSS | Regulon Activity |
| ∗The dot plots of a searched regulon are shown for all cell subpopulations in each disease state of each tissue based on the regulon specific score inferred using pySCENIC and by calculating the average expression. |
| Page: 1 |
Top |
Somatic mutation of malignant transformation related genes |
| Annotation of somatic variants for genes involved in malignant transformation |
| Hugo Symbol | Variant Class | Variant Classification | dbSNP RS | HGVSc | HGVSp | HGVSp Short | SWISSPROT | BIOTYPE | SIFT | PolyPhen | Tumor Sample Barcode | Tissue | Histology | Sex | Age | Stage | Therapy Types | Drugs | Outcome |
| GCLC | SNV | Missense_Mutation | c.832G>C | p.Ala278Pro | p.A278P | P48506 | protein_coding | deleterious(0) | probably_damaging(0.995) | TCGA-A7-A13D-01 | Breast | breast invasive carcinoma | Female | <65 | I/II | Chemotherapy | cytoxan | SD | |
| GCLC | SNV | Missense_Mutation | c.1018N>C | p.Gly340Arg | p.G340R | P48506 | protein_coding | tolerated(1) | probably_damaging(0.959) | TCGA-BH-A18V-01 | Breast | breast invasive carcinoma | Female | <65 | I/II | Unknown | Unknown | SD | |
| GCLC | SNV | Missense_Mutation | novel | c.1180N>C | p.Glu394Gln | p.E394Q | P48506 | protein_coding | tolerated(0.18) | possibly_damaging(0.502) | TCGA-LL-A73Y-01 | Breast | breast invasive carcinoma | Female | >=65 | I/II | Chemotherapy | taxotere | SD |
| GCLC | insertion | In_Frame_Ins | novel | c.1398_1399insATC | p.Val466_Asp467insIle | p.V466_D467insI | P48506 | protein_coding | TCGA-AN-A04C-01 | Breast | breast invasive carcinoma | Female | <65 | I/II | Unknown | Unknown | SD | ||
| GCLC | insertion | Nonsense_Mutation | novel | c.1396_1397insCATCTTAGATGATGAAATGGCATCTGGATTGCTTAC | p.Val466delinsAlaSerTerMetMetLysTrpHisLeuAspCysLeuLeu | p.V466delinsAS*MMKWHLDCLL | P48506 | protein_coding | TCGA-AN-A04C-01 | Breast | breast invasive carcinoma | Female | <65 | I/II | Unknown | Unknown | SD | ||
| GCLC | SNV | Missense_Mutation | novel | c.737G>A | p.Gly246Asp | p.G246D | P48506 | protein_coding | deleterious(0) | probably_damaging(1) | TCGA-2W-A8YY-01 | Cervix | cervical & endocervical cancer | Female | <65 | I/II | Chemotherapy | cisplatin | CR |
| GCLC | SNV | Missense_Mutation | novel | c.1037T>C | p.Ile346Thr | p.I346T | P48506 | protein_coding | tolerated(0.34) | probably_damaging(0.94) | TCGA-5M-AAT6-01 | Colorectum | colon adenocarcinoma | Female | <65 | III/IV | Unknown | Unknown | PD |
| GCLC | SNV | Missense_Mutation | novel | c.755N>C | p.Val252Ala | p.V252A | P48506 | protein_coding | deleterious(0) | benign(0.231) | TCGA-AA-3877-01 | Colorectum | colon adenocarcinoma | Female | >=65 | I/II | Unknown | Unknown | SD |
| GCLC | SNV | Missense_Mutation | novel | c.1787N>C | p.Glu596Ala | p.E596A | P48506 | protein_coding | tolerated(0.15) | benign(0.003) | TCGA-AA-3984-01 | Colorectum | colon adenocarcinoma | Female | <65 | I/II | Unknown | Unknown | SD |
| GCLC | SNV | Missense_Mutation | c.784N>A | p.Ala262Thr | p.A262T | P48506 | protein_coding | deleterious(0) | benign(0.228) | TCGA-AA-A010-01 | Colorectum | colon adenocarcinoma | Female | <65 | I/II | Chemotherapy | folinic | CR |
| Page: 1 2 3 4 5 6 |
Top |
Related drugs of malignant transformation related genes |
| Identification of chemicals and drugs interact with genes involved in malignant transfromation |
| (DGIdb 4.0) |
| Entrez ID | Symbol | Category | Interaction Types | Drug Claim Name | Drug Name | PMIDs |
| 2729 | GCLC | DRUGGABLE GENOME, ENZYME | BSO | 9660546 | ||
| 2729 | GCLC | DRUGGABLE GENOME, ENZYME | BUTHIONINE SULPHOXIMINE | 11705692 | ||
| 2729 | GCLC | DRUGGABLE GENOME, ENZYME | CISPLATIN | CISPLATIN | 9660546 | |
| 2729 | GCLC | DRUGGABLE GENOME, ENZYME | ETHANOL | ALCOHOL | 10385658 | |
| 2729 | GCLC | DRUGGABLE GENOME, ENZYME | sulfamethoxazole | SULFAMETHOXAZOLE | 22824134 | |
| 2729 | GCLC | DRUGGABLE GENOME, ENZYME | ANTIOXIDANT | 15485876 | ||
| 2729 | GCLC | DRUGGABLE GENOME, ENZYME | CBDCA | CARBOPLATIN | 11911273 | |
| 2729 | GCLC | DRUGGABLE GENOME, ENZYME | BUTHIONINE SULFOXIMINE | 8101766,9610371 | ||
| 2729 | GCLC | DRUGGABLE GENOME, ENZYME | L-BUTHIONINE SULFOXIMINE | 9660546 |
| Page: 1 |

Copyright 2023-Present -The University of Texas Health Science Center at Houston |