
|
|||||
|
 | |
| |
| |
| |
| |
| |
|
Gene: ZNF703 |
Gene summary for ZNF703 |
| Gene information | Species | Human | Gene symbol | ZNF703 | Gene ID | 80139 |
| Gene name | zinc finger protein 703 | |
| Gene Alias | NLZ1 | |
| Cytomap | 8p11.23 | |
| Gene Type | protein-coding | GO ID | GO:0001837 | UniProtAcc | Q9H7S9 |
Top |
Malignant transformation analysis |
| Identification of the aberrant gene expression in precancerous and cancerous lesions by comparing the gene expression of stem-like cells in diseased tissues with normal stem cells |
| Entrez ID | Symbol | Replicates | Species | Organ | Tissue | Adj P-value | Log2FC | Malignancy |
| 80139 | ZNF703 | GSM4909286 | Human | Breast | IDC | 3.32e-03 | -1.22e-01 | 0.1081 |
| 80139 | ZNF703 | GSM4909297 | Human | Breast | IDC | 2.19e-06 | 3.88e-01 | 0.1517 |
| 80139 | ZNF703 | GSM4909298 | Human | Breast | IDC | 5.65e-09 | 2.47e-01 | 0.1551 |
| 80139 | ZNF703 | GSM4909301 | Human | Breast | IDC | 1.79e-03 | 2.44e-01 | 0.1577 |
| 80139 | ZNF703 | GSM4909303 | Human | Breast | IDC | 3.29e-02 | 3.28e-01 | 0.0438 |
| 80139 | ZNF703 | GSM4909304 | Human | Breast | IDC | 1.09e-15 | 4.76e-01 | 0.1636 |
| 80139 | ZNF703 | GSM4909305 | Human | Breast | IDC | 5.70e-05 | 3.07e-01 | 0.0436 |
| 80139 | ZNF703 | GSM4909306 | Human | Breast | IDC | 2.20e-15 | 4.80e-01 | 0.1564 |
| 80139 | ZNF703 | GSM4909307 | Human | Breast | IDC | 2.41e-05 | 3.32e-01 | 0.1569 |
| 80139 | ZNF703 | GSM4909308 | Human | Breast | IDC | 4.12e-26 | 5.67e-01 | 0.158 |
| 80139 | ZNF703 | GSM4909309 | Human | Breast | IDC | 2.10e-02 | 2.74e-01 | 0.0483 |
| 80139 | ZNF703 | GSM4909317 | Human | Breast | IDC | 5.80e-27 | 6.38e-01 | 0.1355 |
| 80139 | ZNF703 | GSM4909318 | Human | Breast | IDC | 3.54e-15 | 9.85e-01 | 0.2031 |
| 80139 | ZNF703 | GSM4909319 | Human | Breast | IDC | 1.00e-04 | 7.92e-02 | 0.1563 |
| 80139 | ZNF703 | M1 | Human | Breast | IDC | 4.54e-05 | 3.45e-01 | 0.1577 |
| 80139 | ZNF703 | NCCBC2 | Human | Breast | DCIS | 3.50e-22 | 1.25e+00 | 0.1554 |
| 80139 | ZNF703 | DCIS2 | Human | Breast | DCIS | 6.30e-10 | -4.17e-02 | 0.0085 |
| 80139 | ZNF703 | HTA11_3410_2000001011 | Human | Colorectum | AD | 4.97e-37 | 8.29e-01 | 0.0155 |
| 80139 | ZNF703 | HTA11_2487_2000001011 | Human | Colorectum | SER | 2.07e-18 | 6.89e-01 | -0.1808 |
| 80139 | ZNF703 | HTA11_2951_2000001011 | Human | Colorectum | AD | 6.08e-14 | 1.07e+00 | 0.0216 |
| Page: 1 2 3 4 5 6 7 |
| Tissue | Expression Dynamics | Abbreviation |
| Breast | 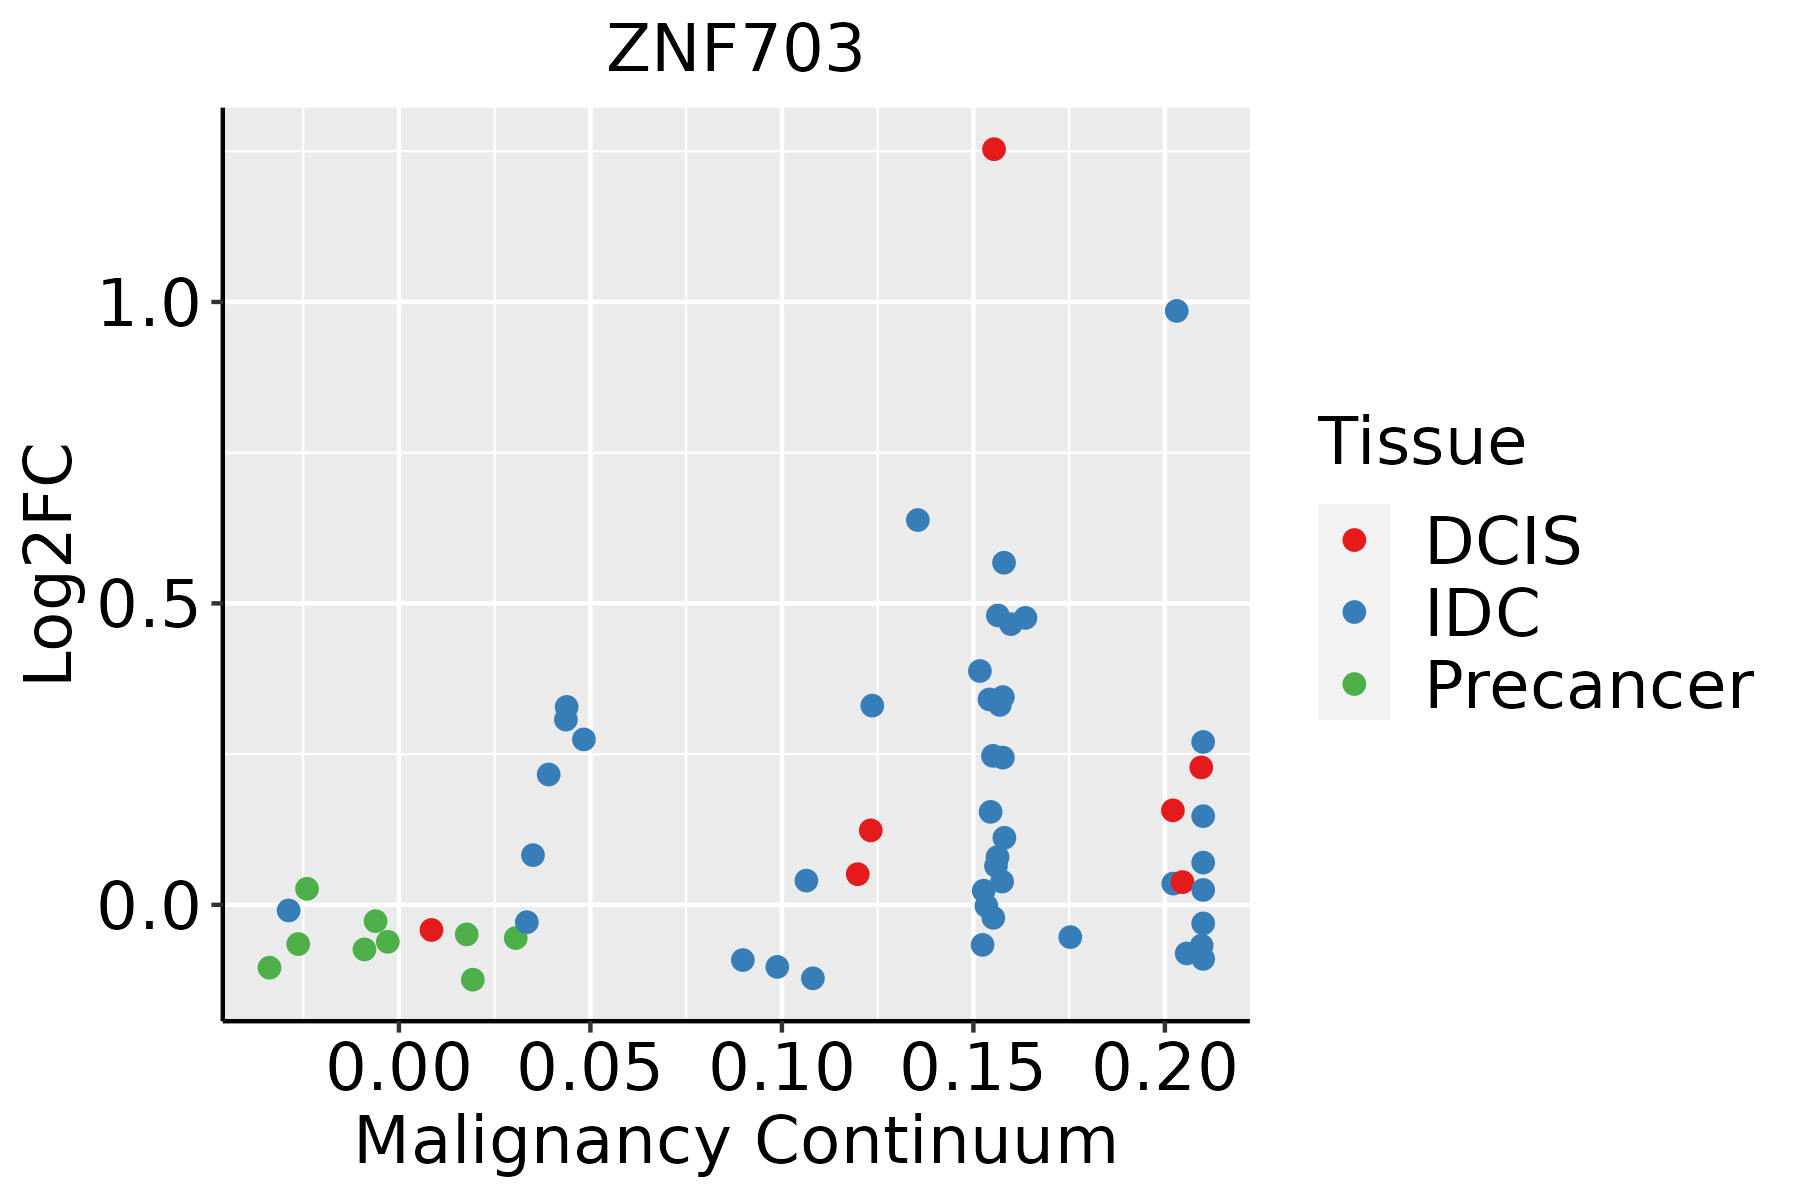 | IDC: Invasive ductal carcinoma |
| DCIS: Ductal carcinoma in situ | ||
| Precancer(BRCA1-mut): Precancerous lesion from BRCA1 mutation carriers | ||
| Colorectum (GSE201348) |  | FAP: Familial adenomatous polyposis |
| CRC: Colorectal cancer | ||
| Colorectum (HTA11) |  | AD: Adenomas |
| SER: Sessile serrated lesions | ||
| MSI-H: Microsatellite-high colorectal cancer | ||
| MSS: Microsatellite stable colorectal cancer | ||
| Esophagus |  | ESCC: Esophageal squamous cell carcinoma |
| HGIN: High-grade intraepithelial neoplasias | ||
| LGIN: Low-grade intraepithelial neoplasias | ||
| Liver | 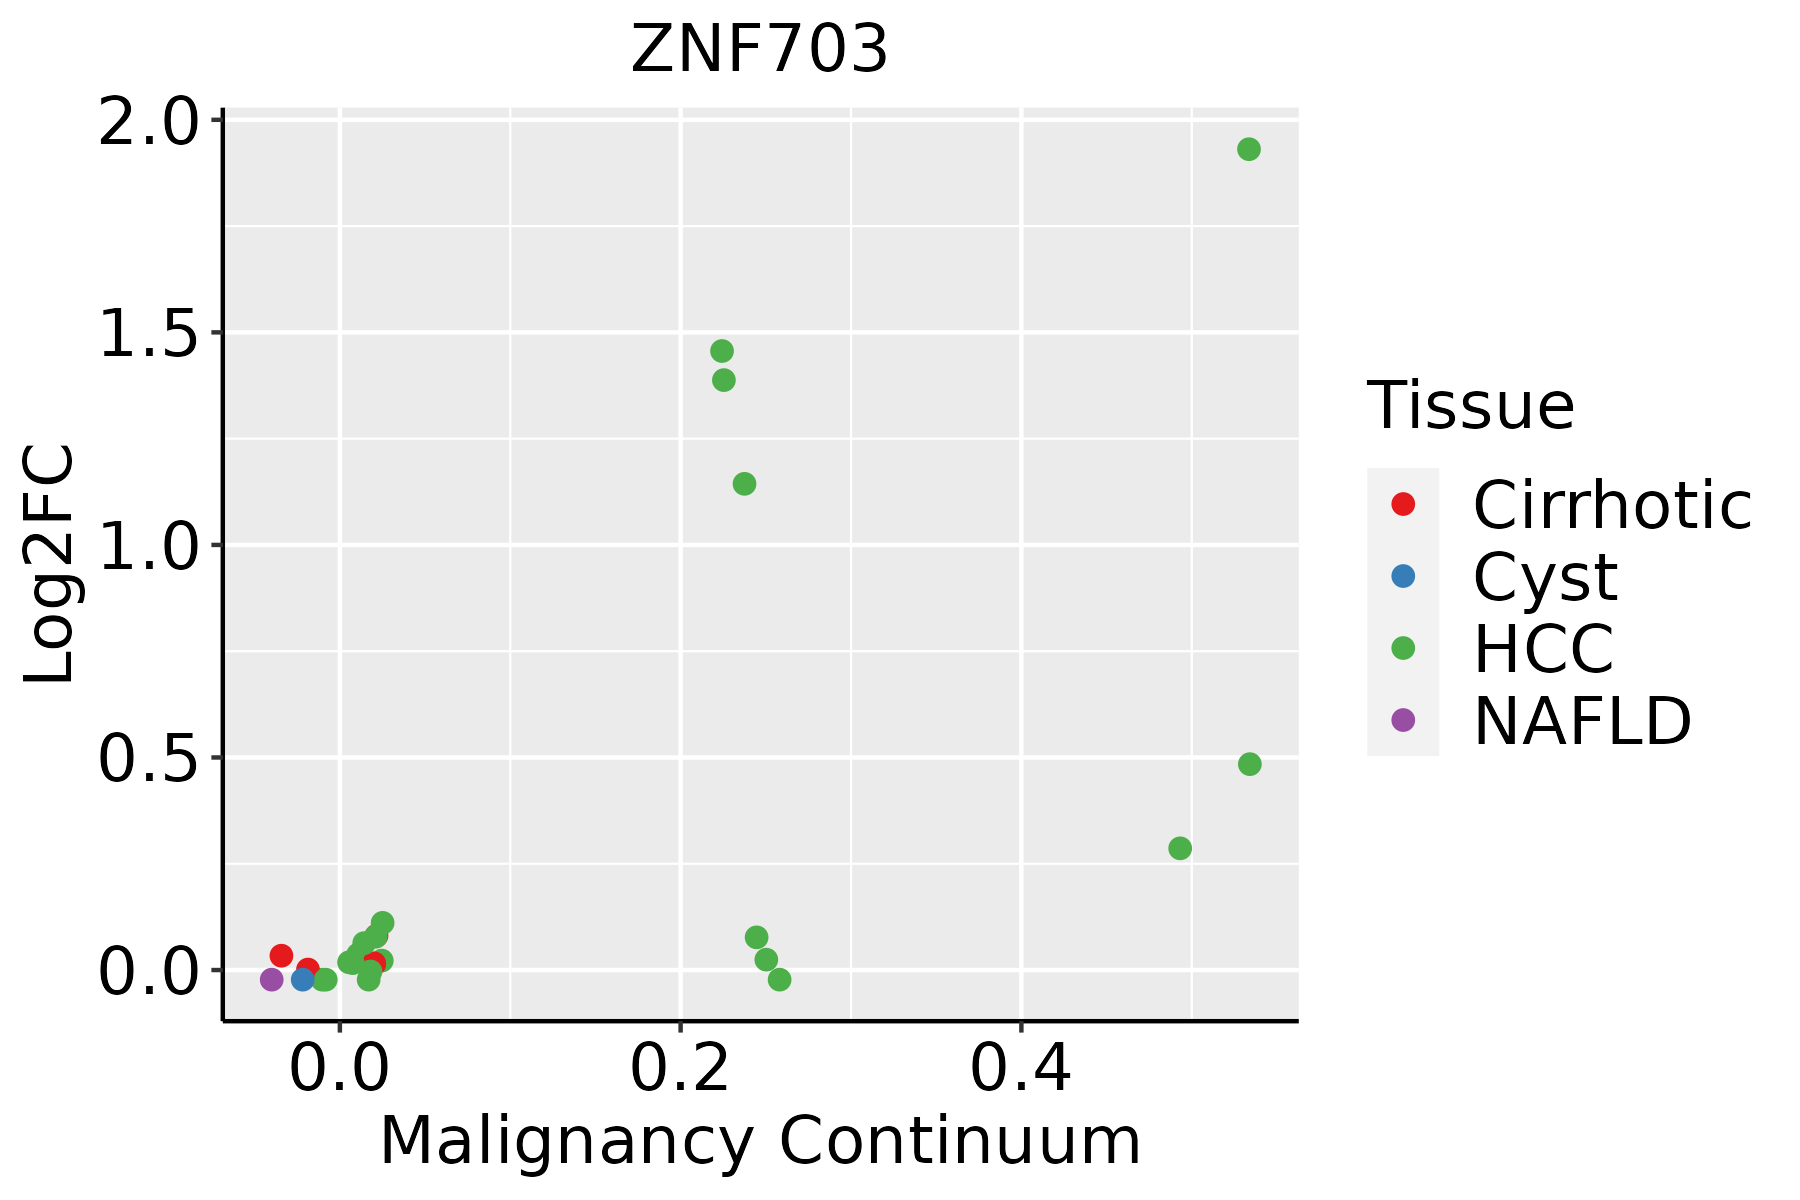 | HCC: Hepatocellular carcinoma |
| NAFLD: Non-alcoholic fatty liver disease | ||
| Oral Cavity |  | EOLP: Erosive Oral lichen planus |
| LP: leukoplakia | ||
| NEOLP: Non-erosive oral lichen planus | ||
| OSCC: Oral squamous cell carcinoma | ||
| Thyroid | 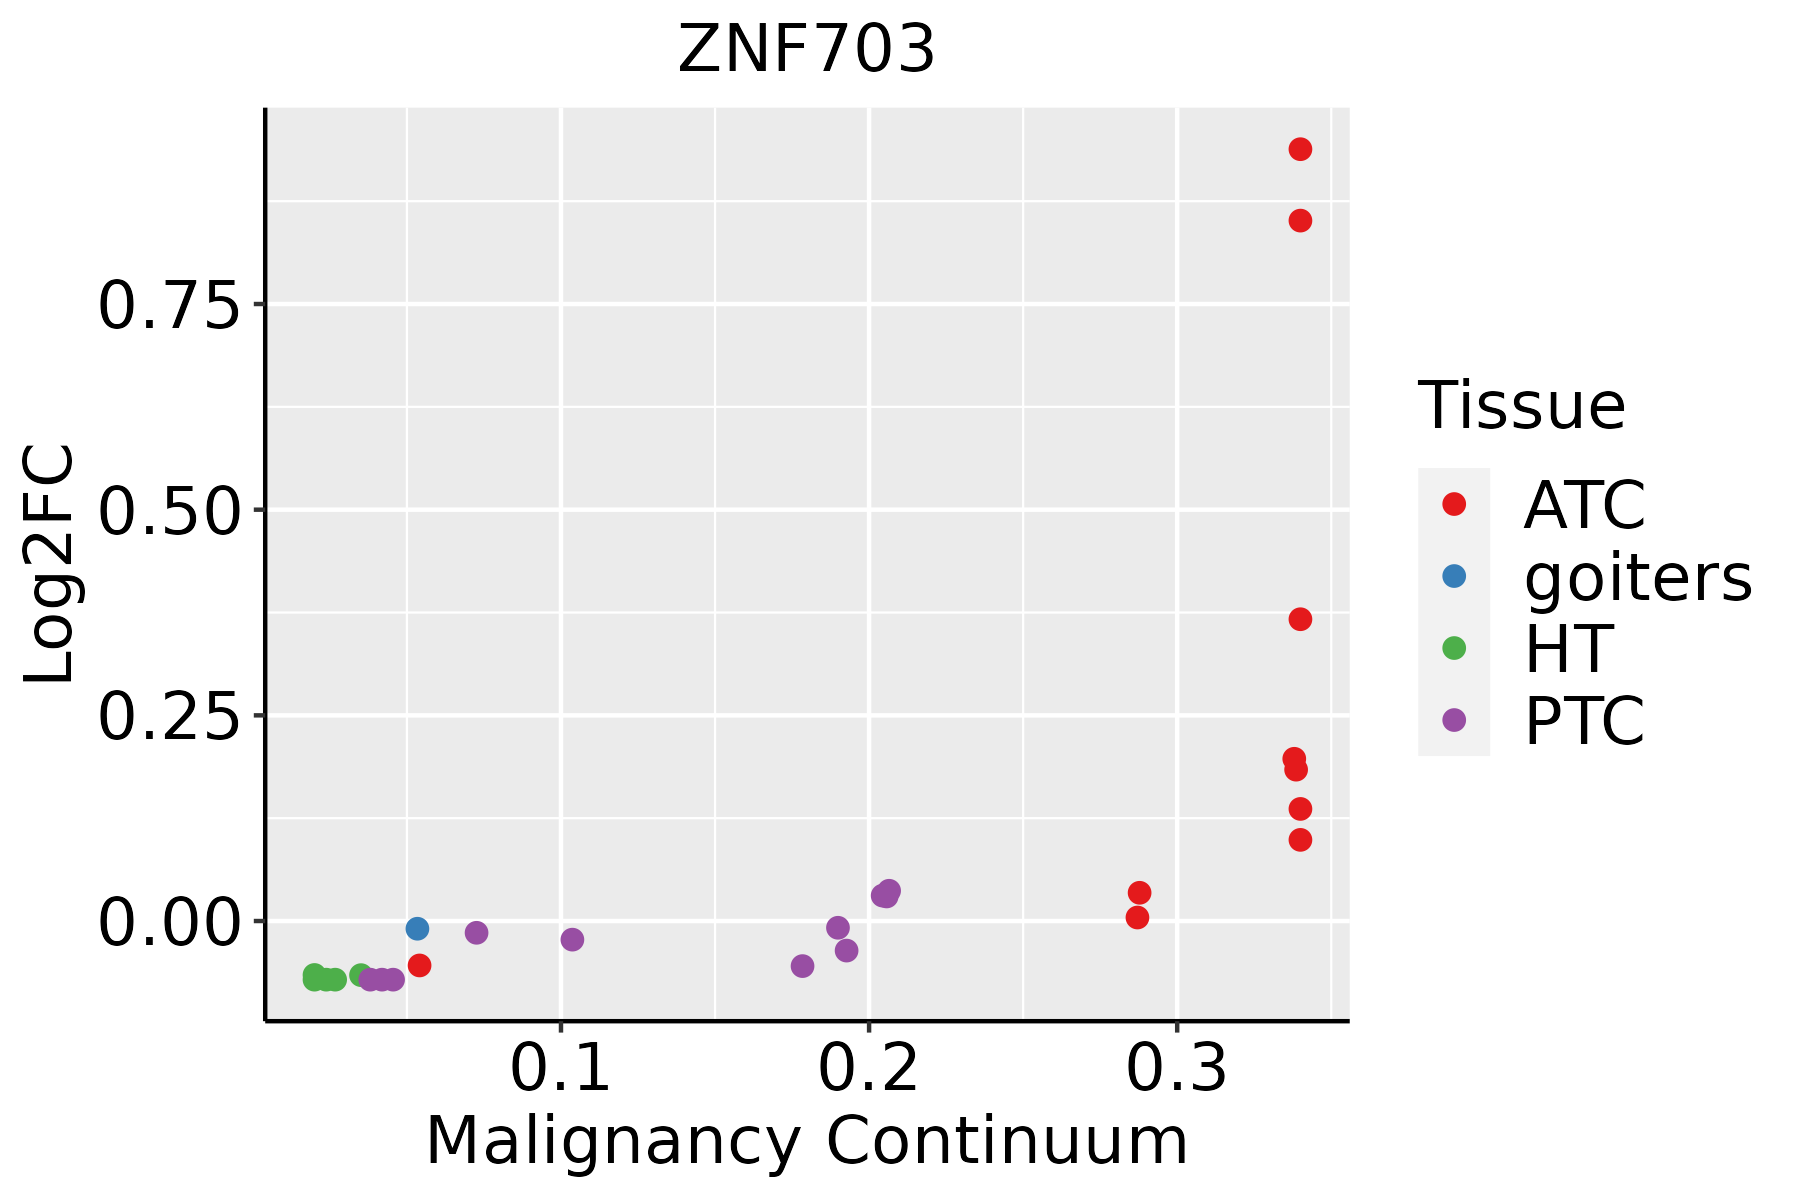 | ATC: Anaplastic thyroid cancer |
| HT: Hashimoto's thyroiditis | ||
| PTC: Papillary thyroid cancer |
| ∗log2FC in expression of this searched gene in stem-like cells from each diseased tissue sample relative to stem-like cells in normal samples in each tissue plotted against the malignancy continuum. Samples are colored based on if they are from different disease stage. |
Top |
Malignant transformation related pathway analysis |
| Find out the enriched GO biological processes and KEGG pathways involved in transition from healthy to precancer to cancer |
| Tissue | Disease Stage | Enriched GO biological Processes |
| Colorectum | AD |  |
| Colorectum | SER |  |
| Colorectum | MSS |  |
| Colorectum | MSI-H |  |
| Colorectum | FAP |  |
| ∗Top 15 enriched GO BP terms are showed in the bar plot of each disease state in each tissue. Each row represents a significant GO biological process which is colored according to the -log10(p.adjust). |
| Page: 1 2 3 4 5 6 7 8 9 |
| GO ID | Tissue | Disease Stage | Description | Gene Ratio | Bg Ratio | pvalue | p.adjust | Count |
| GO:0048762 | Colorectum | MSS | mesenchymal cell differentiation | 59/3467 | 236/18723 | 7.79e-03 | 4.84e-02 | 59 |
| GO:00341093 | Colorectum | MSI-H | homotypic cell-cell adhesion | 20/1319 | 90/18723 | 3.43e-06 | 1.89e-04 | 20 |
| GO:00487323 | Colorectum | MSI-H | gland development | 53/1319 | 436/18723 | 7.08e-05 | 2.35e-03 | 53 |
| GO:00452163 | Colorectum | MSI-H | cell-cell junction organization | 28/1319 | 200/18723 | 3.82e-04 | 8.73e-03 | 28 |
| GO:00070433 | Colorectum | MSI-H | cell-cell junction assembly | 20/1319 | 146/18723 | 3.18e-03 | 3.93e-02 | 20 |
| GO:00487325 | Colorectum | CRC | gland development | 88/2078 | 436/18723 | 1.62e-08 | 2.79e-06 | 88 |
| GO:00160554 | Colorectum | CRC | Wnt signaling pathway | 88/2078 | 444/18723 | 3.91e-08 | 5.28e-06 | 88 |
| GO:01987384 | Colorectum | CRC | cell-cell signaling by wnt | 88/2078 | 446/18723 | 4.85e-08 | 6.04e-06 | 88 |
| GO:00343294 | Colorectum | CRC | cell junction assembly | 83/2078 | 420/18723 | 1.08e-07 | 1.29e-05 | 83 |
| GO:00452165 | Colorectum | CRC | cell-cell junction organization | 48/2078 | 200/18723 | 1.67e-07 | 1.72e-05 | 48 |
| GO:00301114 | Colorectum | CRC | regulation of Wnt signaling pathway | 68/2078 | 328/18723 | 2.41e-07 | 2.27e-05 | 68 |
| GO:00608284 | Colorectum | CRC | regulation of canonical Wnt signaling pathway | 52/2078 | 253/18723 | 7.85e-06 | 2.85e-04 | 52 |
| GO:00343323 | Colorectum | CRC | adherens junction organization | 17/2078 | 49/18723 | 1.09e-05 | 3.60e-04 | 17 |
| GO:00600704 | Colorectum | CRC | canonical Wnt signaling pathway | 59/2078 | 303/18723 | 1.15e-05 | 3.74e-04 | 59 |
| GO:00071783 | Colorectum | CRC | transmembrane receptor protein serine/threonine kinase signaling pathway | 66/2078 | 355/18723 | 1.74e-05 | 5.28e-04 | 66 |
| GO:00715592 | Colorectum | CRC | response to transforming growth factor beta | 51/2078 | 256/18723 | 2.33e-05 | 6.65e-04 | 51 |
| GO:00341095 | Colorectum | CRC | homotypic cell-cell adhesion | 24/2078 | 90/18723 | 3.19e-05 | 8.20e-04 | 24 |
| GO:00715602 | Colorectum | CRC | cellular response to transforming growth factor beta stimulus | 49/2078 | 250/18723 | 5.17e-05 | 1.19e-03 | 49 |
| GO:00071792 | Colorectum | CRC | transforming growth factor beta receptor signaling pathway | 39/2078 | 198/18723 | 2.58e-04 | 4.19e-03 | 39 |
| GO:00070435 | Colorectum | CRC | cell-cell junction assembly | 31/2078 | 146/18723 | 2.75e-04 | 4.40e-03 | 31 |
| Page: 1 2 3 4 5 6 7 8 9 10 11 12 13 |
| Pathway ID | Tissue | Disease Stage | Description | Gene Ratio | Bg Ratio | pvalue | p.adjust | qvalue | Count |
| Page: 1 |
Top |
Cell-cell communication analysis |
| Identification of potential cell-cell interactions between two cell types and their ligand-receptor pairs for different disease states |
| Ligand | Receptor | LRpair | Pathway | Tissue | Disease Stage |
| Page: 1 |
Top |
Single-cell gene regulatory network inference analysis |
| Find out the significant the regulons (TFs) and the target genes of each regulon across cell types for different disease states |
| TF | Cell Type | Tissue | Disease Stage | Target Gene | RSS | Regulon Activity |
| ∗The dot plots of a searched regulon are shown for all cell subpopulations in each disease state of each tissue based on the regulon specific score inferred using pySCENIC and by calculating the average expression. |
| Page: 1 |
Top |
Somatic mutation of malignant transformation related genes |
| Annotation of somatic variants for genes involved in malignant transformation |
| Hugo Symbol | Variant Class | Variant Classification | dbSNP RS | HGVSc | HGVSp | HGVSp Short | SWISSPROT | BIOTYPE | SIFT | PolyPhen | Tumor Sample Barcode | Tissue | Histology | Sex | Age | Stage | Therapy Types | Drugs | Outcome |
| ZNF703 | SNV | Missense_Mutation | novel | c.1642N>A | p.Tyr548Asn | p.Y548N | Q9H7S9 | protein_coding | deleterious(0) | probably_damaging(0.941) | TCGA-A7-A2KD-01 | Breast | breast invasive carcinoma | Female | <65 | III/IV | Chemotherapy | cytoxan | SD |
| ZNF703 | SNV | Missense_Mutation | c.1136C>A | p.Pro379His | p.P379H | Q9H7S9 | protein_coding | deleterious(0) | probably_damaging(0.981) | TCGA-BH-A18G-01 | Breast | breast invasive carcinoma | Female | >=65 | I/II | Unknown | Unknown | SD | |
| ZNF703 | SNV | Missense_Mutation | c.1138T>A | p.Tyr380Asn | p.Y380N | Q9H7S9 | protein_coding | deleterious(0) | probably_damaging(0.915) | TCGA-BH-A18G-01 | Breast | breast invasive carcinoma | Female | >=65 | I/II | Unknown | Unknown | SD | |
| ZNF703 | SNV | Missense_Mutation | c.269C>T | p.Ala90Val | p.A90V | Q9H7S9 | protein_coding | deleterious(0.02) | possibly_damaging(0.707) | TCGA-A6-5661-01 | Colorectum | colon adenocarcinoma | Female | >=65 | I/II | Unknown | Unknown | SD | |
| ZNF703 | SNV | Missense_Mutation | novel | c.343G>A | p.Ala115Thr | p.A115T | Q9H7S9 | protein_coding | tolerated(0.12) | benign(0.069) | TCGA-AA-A022-01 | Colorectum | colon adenocarcinoma | Female | >=65 | I/II | Unknown | Unknown | SD |
| ZNF703 | SNV | Missense_Mutation | c.1441N>A | p.Leu481Ile | p.L481I | Q9H7S9 | protein_coding | deleterious(0) | probably_damaging(0.987) | TCGA-CM-4743-01 | Colorectum | colon adenocarcinoma | Male | >=65 | I/II | Chemotherapy | capecitabine | SD | |
| ZNF703 | SNV | Missense_Mutation | c.1558C>A | p.Leu520Ile | p.L520I | Q9H7S9 | protein_coding | tolerated(0.52) | benign(0.188) | TCGA-D5-6540-01 | Colorectum | colon adenocarcinoma | Male | >=65 | I/II | Unknown | Unknown | SD | |
| ZNF703 | SNV | Missense_Mutation | rs775245530 | c.1723N>A | p.Ala575Thr | p.A575T | Q9H7S9 | protein_coding | deleterious(0.03) | probably_damaging(0.978) | TCGA-AG-3598-01 | Colorectum | rectum adenocarcinoma | Male | >=65 | I/II | Unknown | Unknown | SD |
| ZNF703 | SNV | Missense_Mutation | novel | c.1659N>C | p.Leu553Phe | p.L553F | Q9H7S9 | protein_coding | deleterious(0) | benign(0.175) | TCGA-E6-A1LX-01 | Endometrium | uterine corpus endometrioid carcinoma | Female | <65 | I/II | Unknown | Unknown | SD |
| ZNF703 | SNV | Missense_Mutation | novel | c.1043G>A | p.Gly348Glu | p.G348E | Q9H7S9 | protein_coding | tolerated(0.05) | probably_damaging(0.995) | TCGA-EO-A22U-01 | Endometrium | uterine corpus endometrioid carcinoma | Female | >=65 | I/II | Unknown | Unknown | SD |
| Page: 1 2 3 |
Top |
Related drugs of malignant transformation related genes |
| Identification of chemicals and drugs interact with genes involved in malignant transfromation |
| (DGIdb 4.0) |
| Entrez ID | Symbol | Category | Interaction Types | Drug Claim Name | Drug Name | PMIDs |
| Page: 1 |

Copyright 2023-Present -The University of Texas Health Science Center at Houston |