
|
|||||
|
 | |
| |
| |
| |
| |
| |
|
Gene: WDR18 |
Gene summary for WDR18 |
| Gene information | Species | Human | Gene symbol | WDR18 | Gene ID | 57418 |
| Gene name | WD repeat domain 18 | |
| Gene Alias | Ipi3 | |
| Cytomap | 19p13.3 | |
| Gene Type | protein-coding | GO ID | GO:0006139 | UniProtAcc | Q9BV38 |
Top |
Malignant transformation analysis |
| Identification of the aberrant gene expression in precancerous and cancerous lesions by comparing the gene expression of stem-like cells in diseased tissues with normal stem cells |
| Entrez ID | Symbol | Replicates | Species | Organ | Tissue | Adj P-value | Log2FC | Malignancy |
| 57418 | WDR18 | HTA11_3410_2000001011 | Human | Colorectum | AD | 3.34e-09 | 1.85e-01 | 0.0155 |
| 57418 | WDR18 | HTA11_2487_2000001011 | Human | Colorectum | SER | 3.90e-06 | 1.69e-01 | -0.1808 |
| 57418 | WDR18 | HTA11_78_2000001011 | Human | Colorectum | AD | 3.76e-04 | 1.77e-01 | -0.1088 |
| 57418 | WDR18 | HTA11_347_2000001011 | Human | Colorectum | AD | 2.34e-10 | 2.42e-01 | -0.1954 |
| 57418 | WDR18 | HTA11_411_2000001011 | Human | Colorectum | SER | 1.01e-05 | 4.10e-01 | -0.2602 |
| 57418 | WDR18 | HTA11_3361_2000001011 | Human | Colorectum | AD | 1.24e-04 | 1.96e-01 | -0.1207 |
| 57418 | WDR18 | HTA11_696_2000001011 | Human | Colorectum | AD | 3.41e-13 | 3.09e-01 | -0.1464 |
| 57418 | WDR18 | HTA11_866_2000001011 | Human | Colorectum | AD | 3.82e-04 | 1.76e-01 | -0.1001 |
| 57418 | WDR18 | HTA11_1391_2000001011 | Human | Colorectum | AD | 4.00e-17 | 4.19e-01 | -0.059 |
| 57418 | WDR18 | HTA11_2992_2000001011 | Human | Colorectum | SER | 1.23e-05 | 2.82e-01 | -0.1706 |
| 57418 | WDR18 | HTA11_5216_2000001011 | Human | Colorectum | SER | 1.82e-05 | 3.07e-01 | -0.1462 |
| 57418 | WDR18 | HTA11_546_2000001011 | Human | Colorectum | AD | 9.13e-04 | 2.17e-01 | -0.0842 |
| 57418 | WDR18 | HTA11_866_3004761011 | Human | Colorectum | AD | 5.87e-13 | 3.27e-01 | 0.096 |
| 57418 | WDR18 | HTA11_4255_2000001011 | Human | Colorectum | SER | 2.71e-05 | 3.34e-01 | 0.0446 |
| 57418 | WDR18 | HTA11_7663_2000001011 | Human | Colorectum | SER | 1.19e-08 | 4.48e-01 | 0.0131 |
| 57418 | WDR18 | HTA11_10623_2000001011 | Human | Colorectum | AD | 1.14e-10 | 4.09e-01 | -0.0177 |
| 57418 | WDR18 | HTA11_6801_2000001011 | Human | Colorectum | SER | 1.14e-07 | 4.68e-01 | 0.0171 |
| 57418 | WDR18 | HTA11_10711_2000001011 | Human | Colorectum | AD | 6.55e-06 | 2.02e-01 | 0.0338 |
| 57418 | WDR18 | HTA11_7696_3000711011 | Human | Colorectum | AD | 7.60e-25 | 5.68e-01 | 0.0674 |
| 57418 | WDR18 | HTA11_7469_2000001011 | Human | Colorectum | AD | 6.53e-04 | 3.87e-01 | -0.0124 |
| Page: 1 2 3 4 5 6 7 8 |
| Tissue | Expression Dynamics | Abbreviation |
| Colorectum (GSE201348) |  | FAP: Familial adenomatous polyposis |
| CRC: Colorectal cancer | ||
| Colorectum (HTA11) | 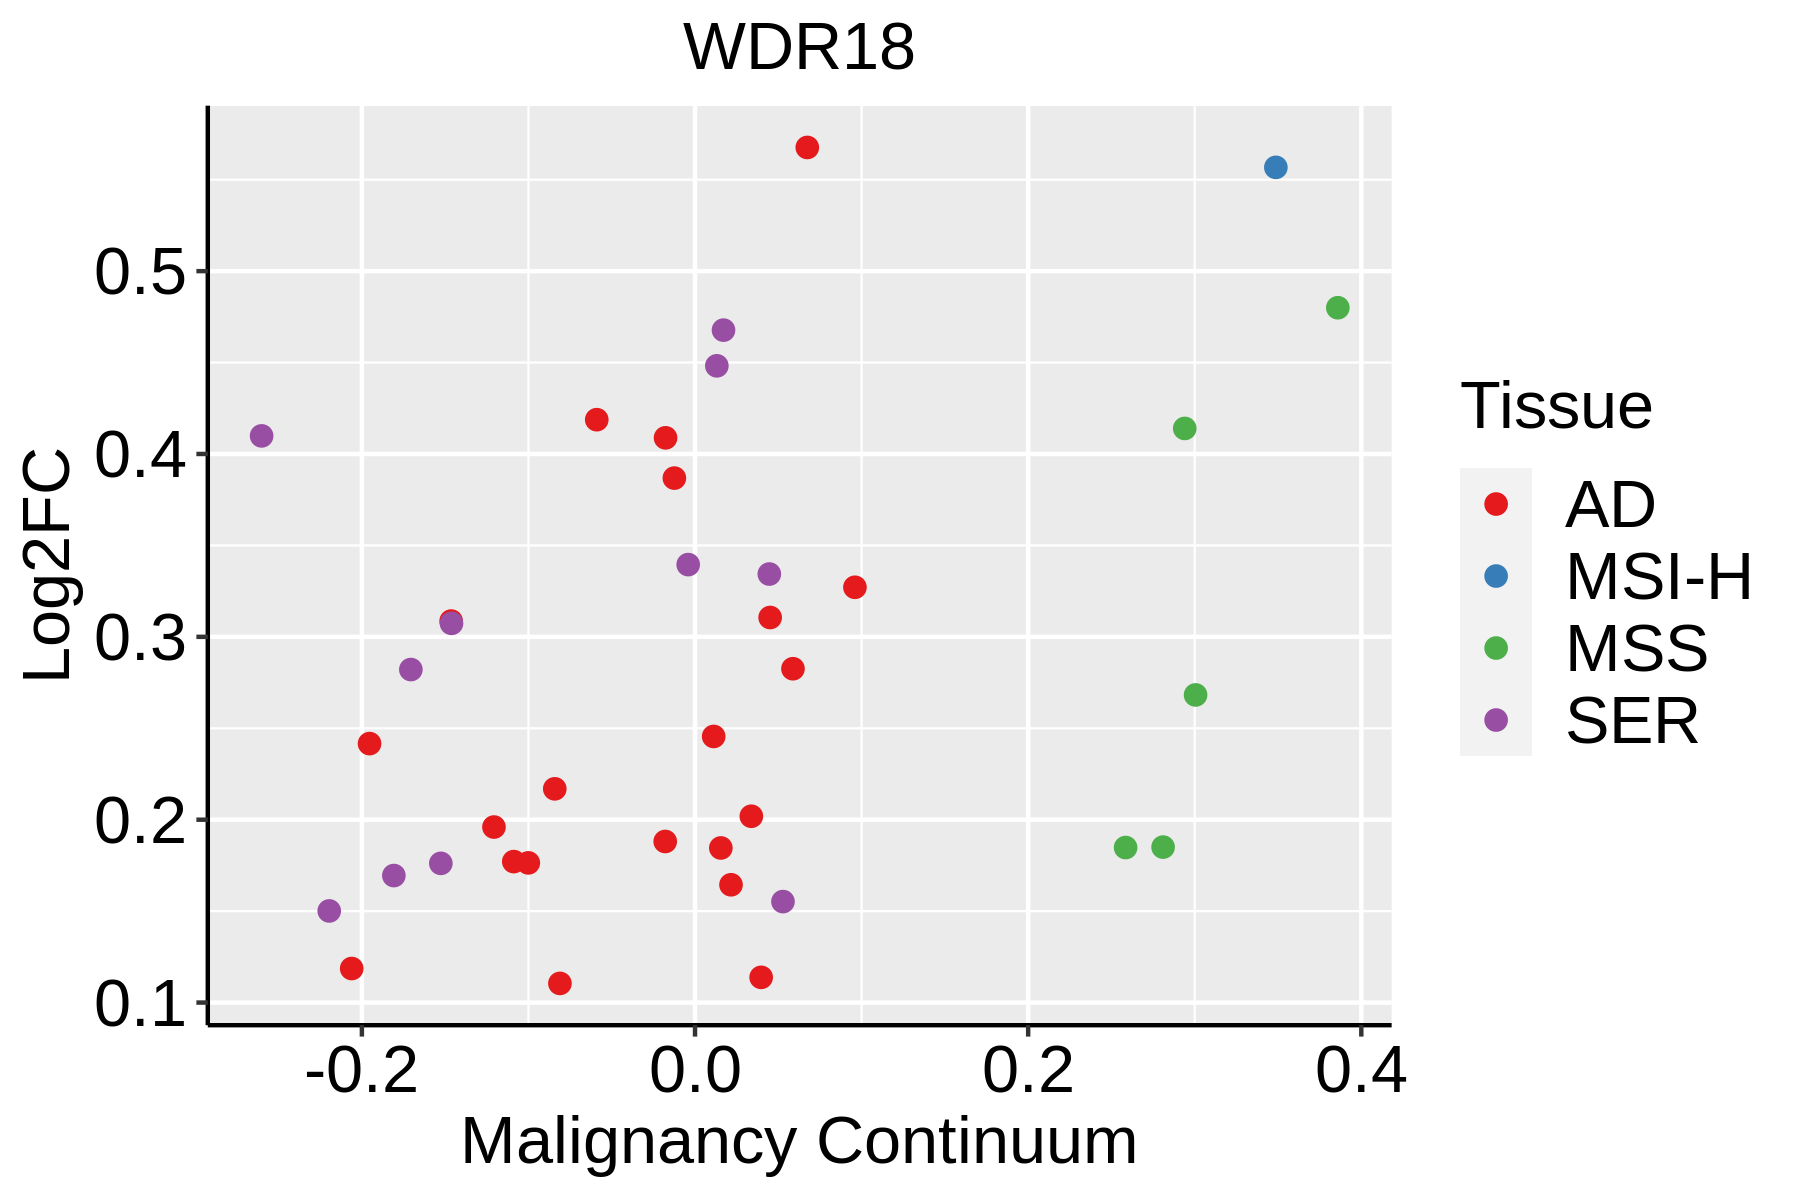 | AD: Adenomas |
| SER: Sessile serrated lesions | ||
| MSI-H: Microsatellite-high colorectal cancer | ||
| MSS: Microsatellite stable colorectal cancer | ||
| Esophagus | 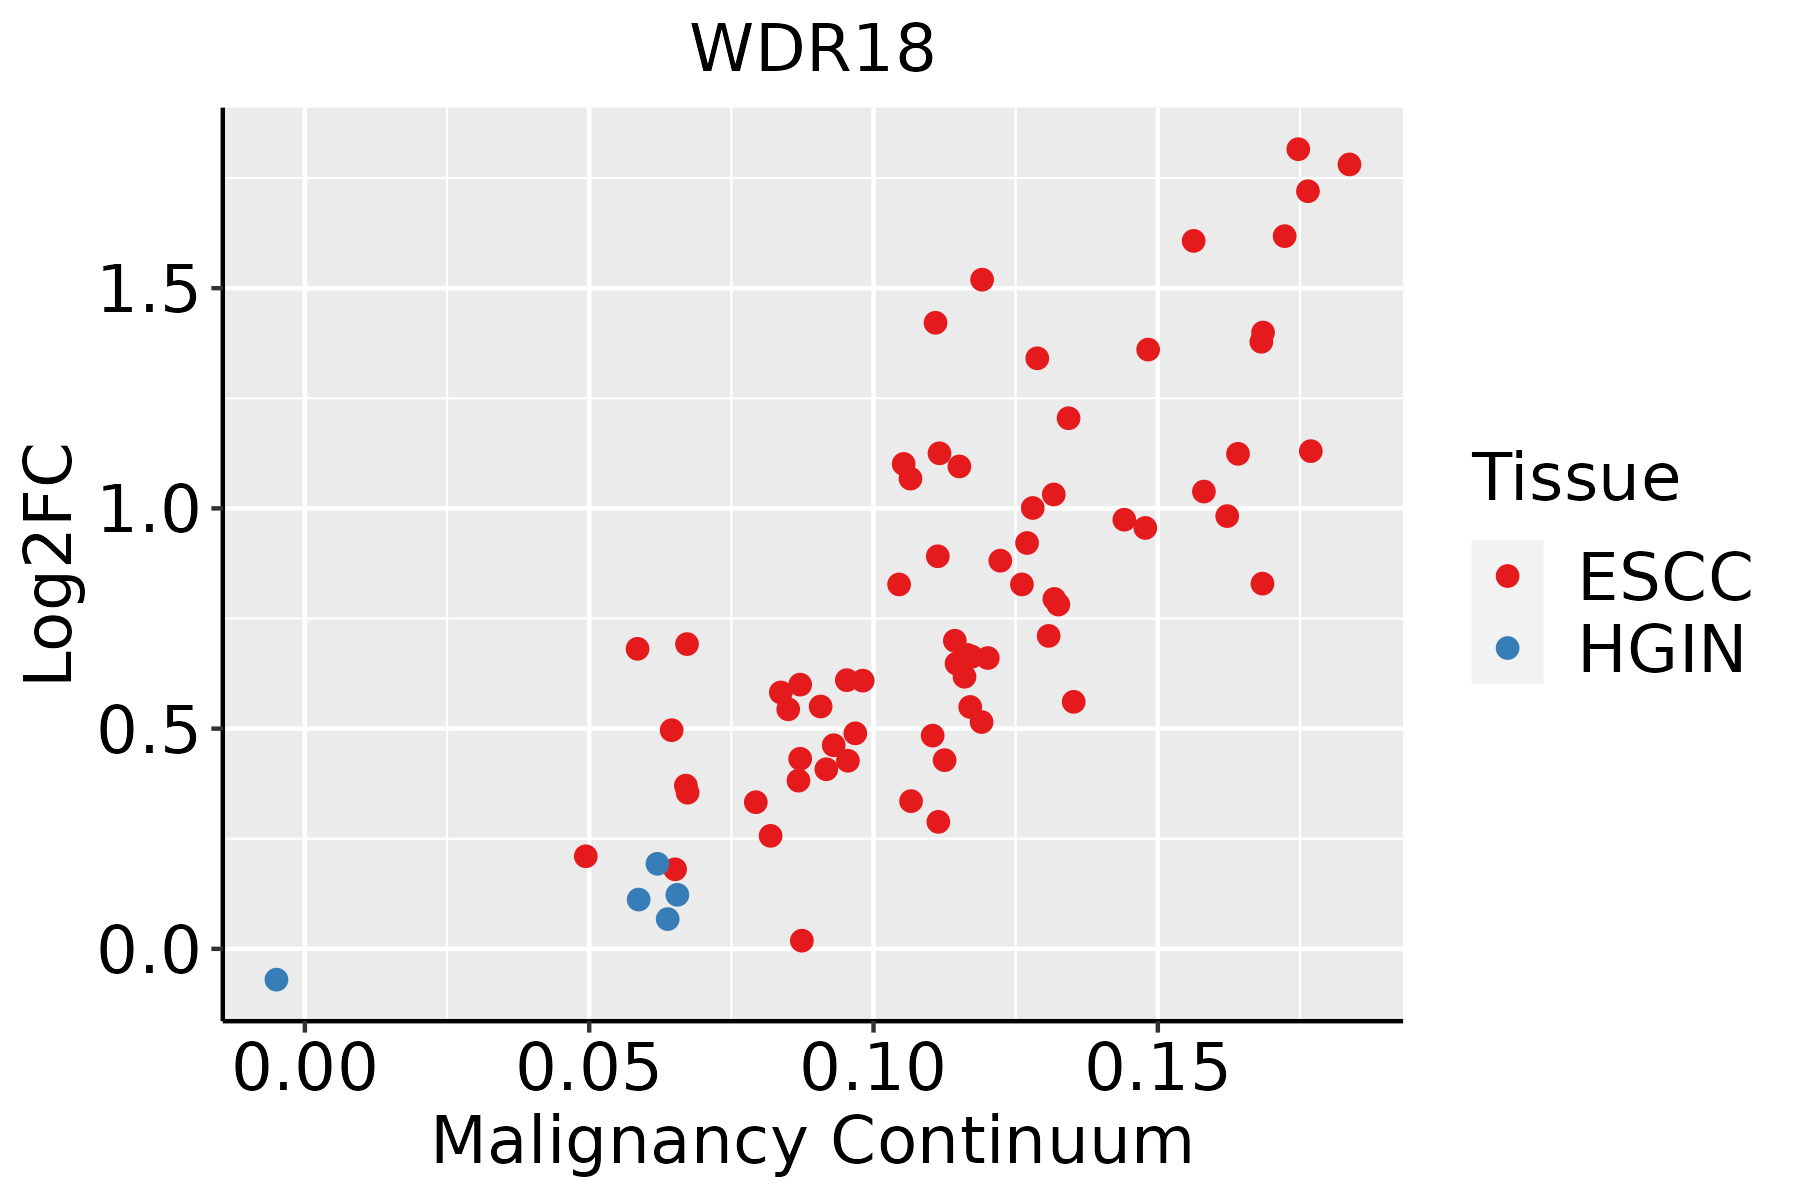 | ESCC: Esophageal squamous cell carcinoma |
| HGIN: High-grade intraepithelial neoplasias | ||
| LGIN: Low-grade intraepithelial neoplasias | ||
| Liver | 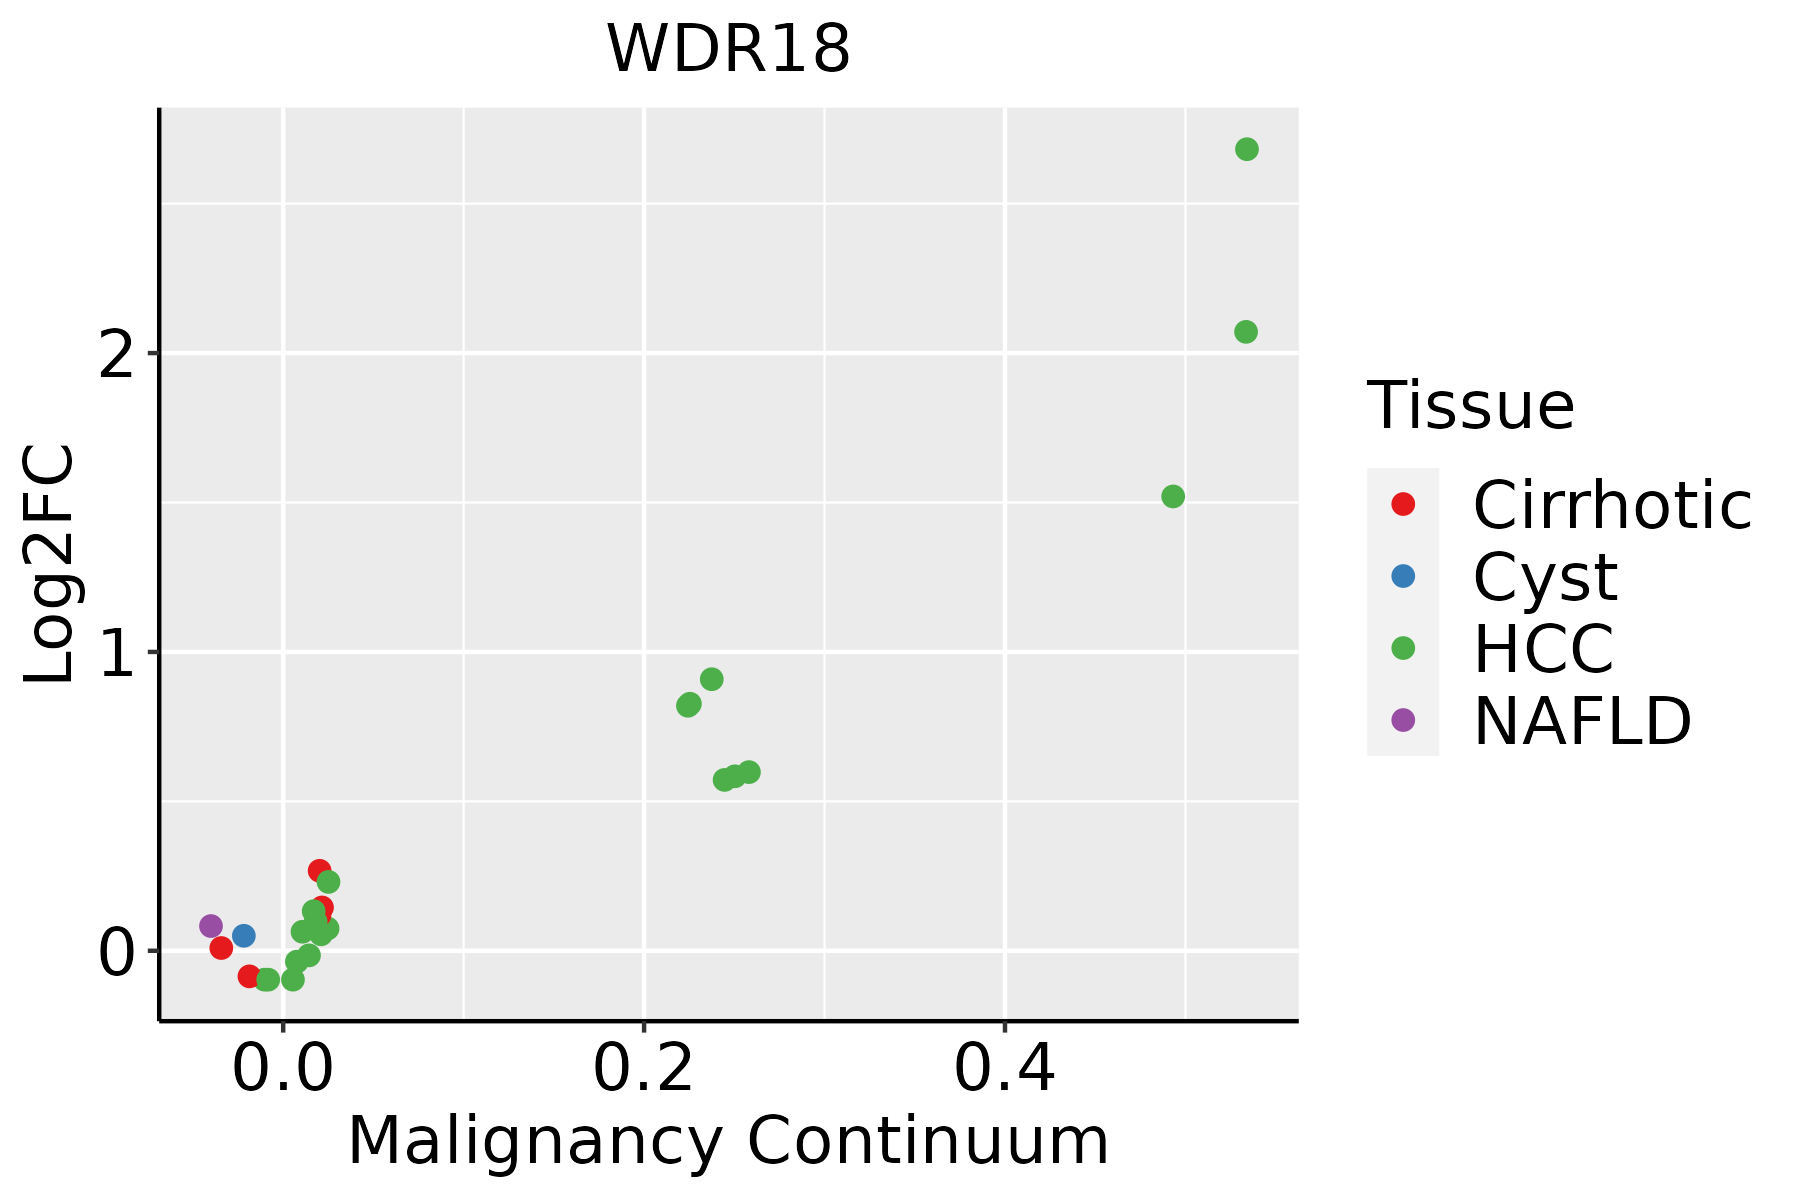 | HCC: Hepatocellular carcinoma |
| NAFLD: Non-alcoholic fatty liver disease | ||
| Oral Cavity | 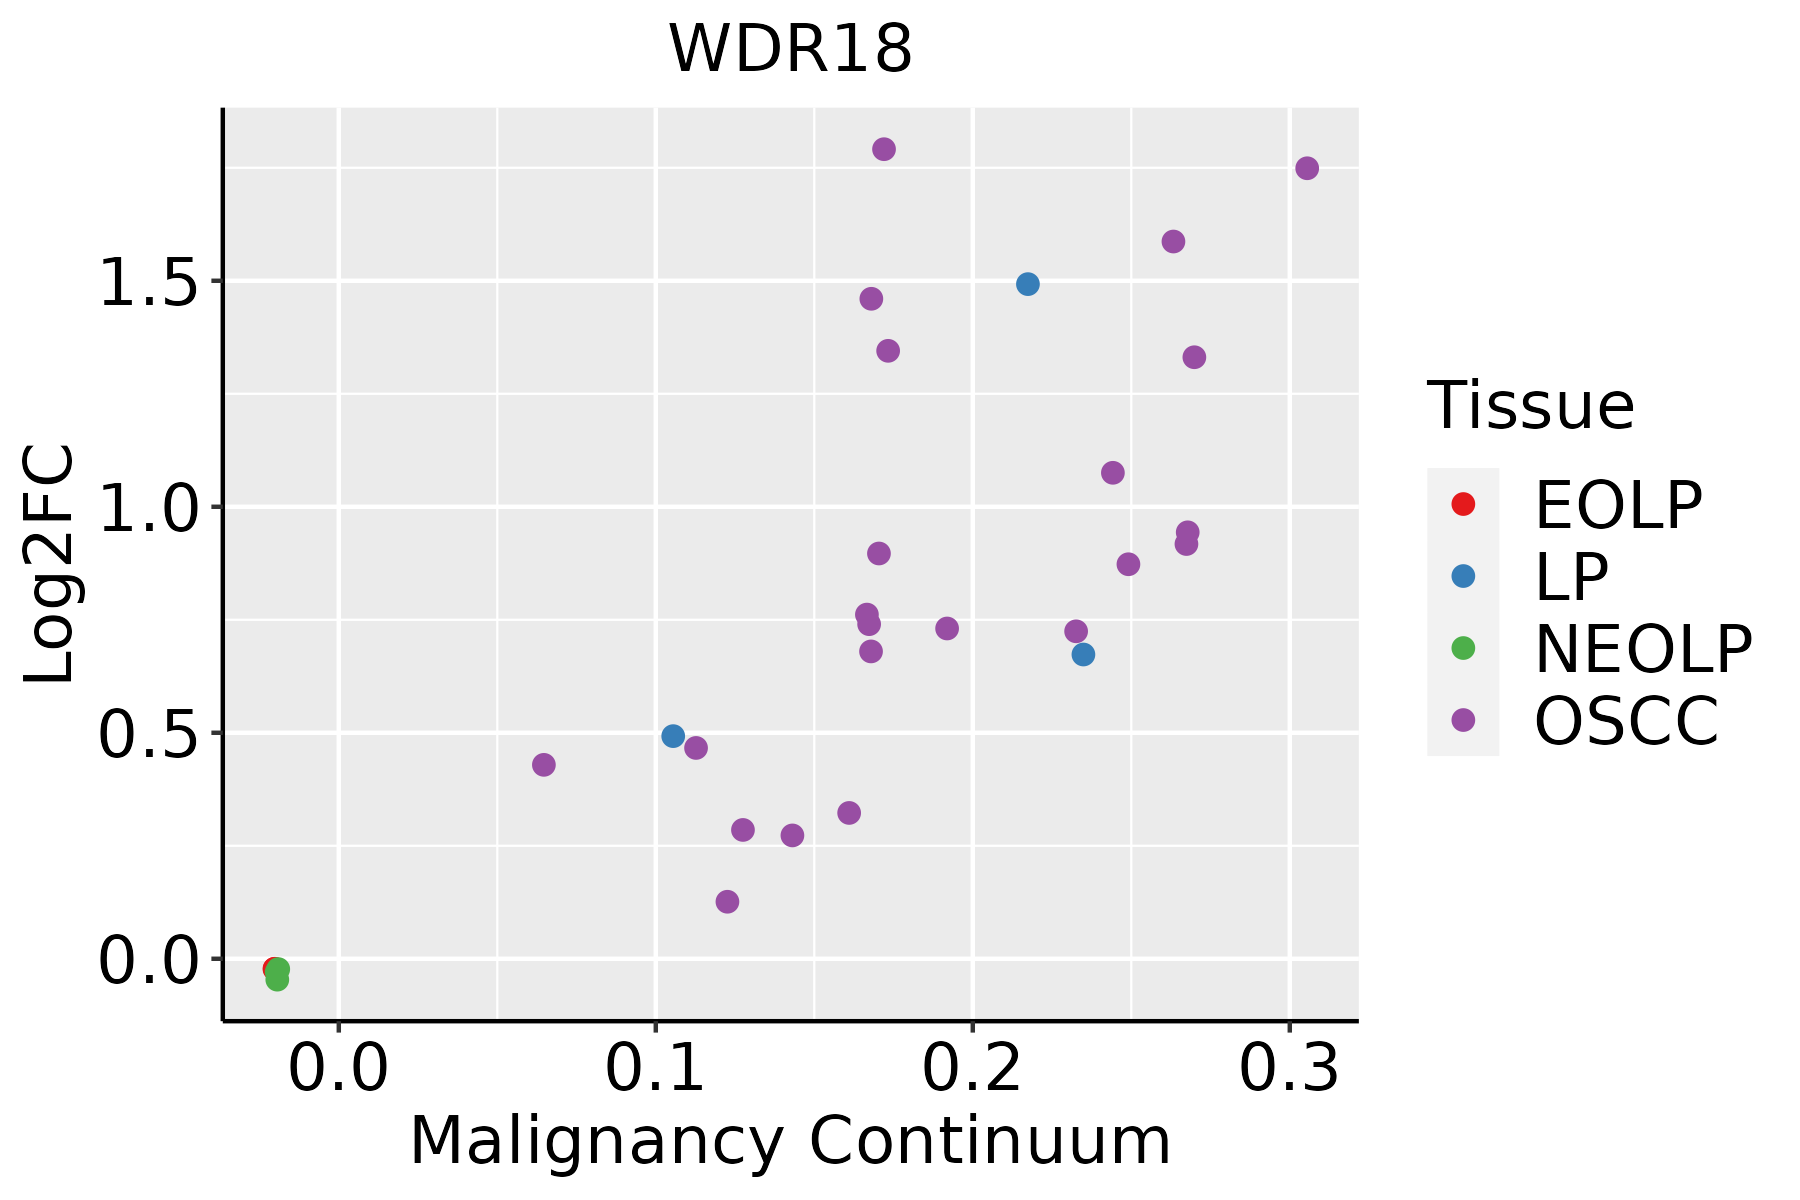 | EOLP: Erosive Oral lichen planus |
| LP: leukoplakia | ||
| NEOLP: Non-erosive oral lichen planus | ||
| OSCC: Oral squamous cell carcinoma | ||
| Skin |  | AK: Actinic keratosis |
| cSCC: Cutaneous squamous cell carcinoma | ||
| SCCIS:squamous cell carcinoma in situ | ||
| Thyroid | 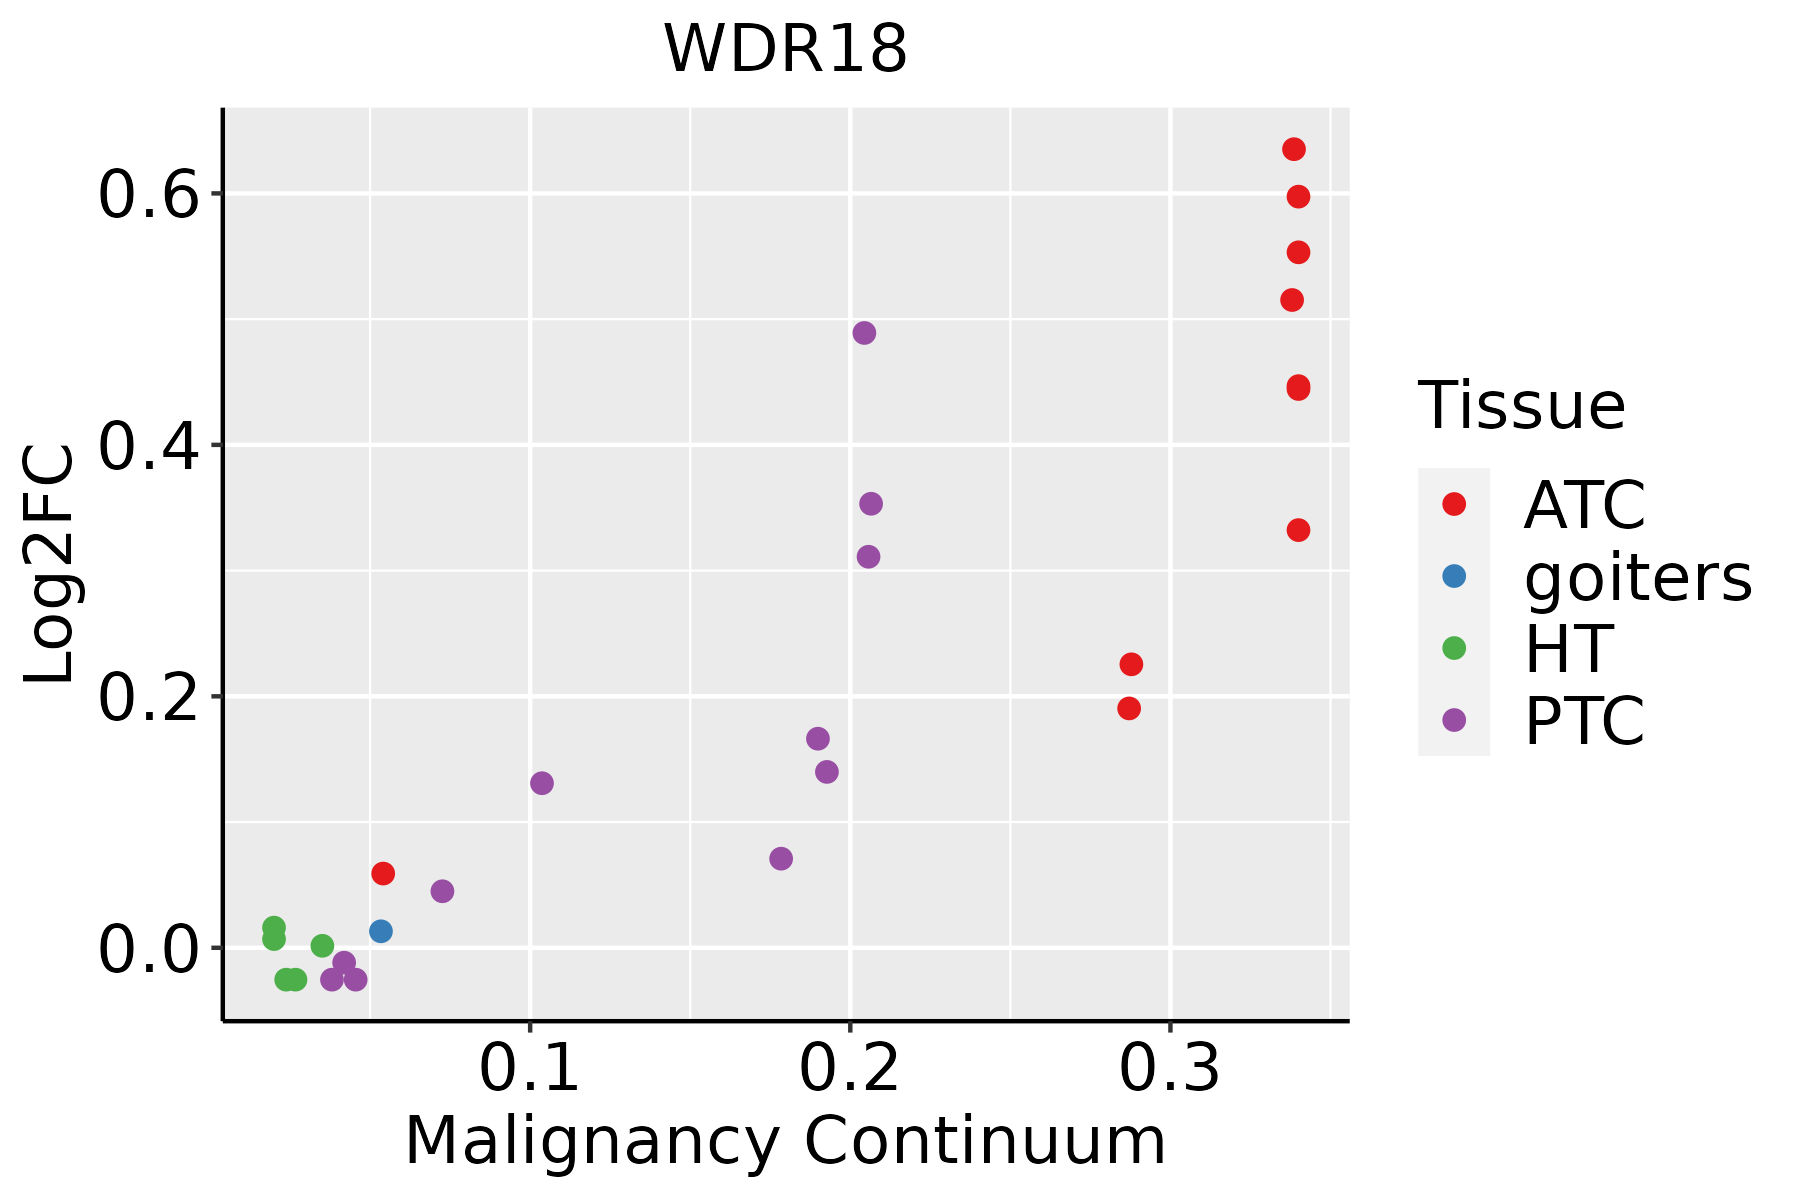 | ATC: Anaplastic thyroid cancer |
| HT: Hashimoto's thyroiditis | ||
| PTC: Papillary thyroid cancer |
| ∗log2FC in expression of this searched gene in stem-like cells from each diseased tissue sample relative to stem-like cells in normal samples in each tissue plotted against the malignancy continuum. Samples are colored based on if they are from different disease stage. |
Top |
Malignant transformation related pathway analysis |
| Find out the enriched GO biological processes and KEGG pathways involved in transition from healthy to precancer to cancer |
| Tissue | Disease Stage | Enriched GO biological Processes |
| Colorectum | AD |  |
| Colorectum | SER |  |
| Colorectum | MSS |  |
| Colorectum | MSI-H |  |
| Colorectum | FAP |  |
| ∗Top 15 enriched GO BP terms are showed in the bar plot of each disease state in each tissue. Each row represents a significant GO biological process which is colored according to the -log10(p.adjust). |
| Page: 1 2 3 4 5 6 7 8 9 |
| GO ID | Tissue | Disease Stage | Description | Gene Ratio | Bg Ratio | pvalue | p.adjust | Count |
| GO:000626012 | Skin | cSCC | DNA replication | 106/4864 | 260/18723 | 1.18e-07 | 2.77e-06 | 106 |
| GO:005105217 | Skin | cSCC | regulation of DNA metabolic process | 136/4864 | 359/18723 | 3.83e-07 | 7.58e-06 | 136 |
| GO:00062755 | Skin | cSCC | regulation of DNA replication | 44/4864 | 107/18723 | 4.41e-04 | 3.39e-03 | 44 |
| GO:0022613113 | Thyroid | PTC | ribonucleoprotein complex biogenesis | 292/5968 | 463/18723 | 3.24e-44 | 2.05e-40 | 292 |
| GO:0042254113 | Thyroid | PTC | ribosome biogenesis | 202/5968 | 299/18723 | 3.47e-37 | 5.47e-34 | 202 |
| GO:0006364112 | Thyroid | PTC | rRNA processing | 156/5968 | 225/18723 | 5.58e-31 | 5.03e-28 | 156 |
| GO:0016072112 | Thyroid | PTC | rRNA metabolic process | 160/5968 | 236/18723 | 5.68e-30 | 3.58e-27 | 160 |
| GO:003447018 | Thyroid | PTC | ncRNA processing | 215/5968 | 395/18723 | 7.14e-21 | 1.22e-18 | 215 |
| GO:00346608 | Thyroid | PTC | ncRNA metabolic process | 239/5968 | 485/18723 | 5.54e-16 | 4.26e-14 | 239 |
| GO:005105218 | Thyroid | PTC | regulation of DNA metabolic process | 171/5968 | 359/18723 | 2.52e-10 | 8.33e-09 | 171 |
| GO:00062606 | Thyroid | PTC | DNA replication | 114/5968 | 260/18723 | 3.09e-05 | 2.95e-04 | 114 |
| GO:002261334 | Thyroid | ATC | ribonucleoprotein complex biogenesis | 292/6293 | 463/18723 | 3.05e-39 | 9.63e-36 | 292 |
| GO:004225434 | Thyroid | ATC | ribosome biogenesis | 203/6293 | 299/18723 | 3.63e-34 | 4.59e-31 | 203 |
| GO:000636432 | Thyroid | ATC | rRNA processing | 157/6293 | 225/18723 | 9.02e-29 | 5.70e-26 | 157 |
| GO:001607232 | Thyroid | ATC | rRNA metabolic process | 161/6293 | 236/18723 | 1.02e-27 | 5.89e-25 | 161 |
| GO:003447021 | Thyroid | ATC | ncRNA processing | 216/6293 | 395/18723 | 3.14e-18 | 3.98e-16 | 216 |
| GO:003466021 | Thyroid | ATC | ncRNA metabolic process | 240/6293 | 485/18723 | 2.03e-13 | 9.91e-12 | 240 |
| GO:005105219 | Thyroid | ATC | regulation of DNA metabolic process | 183/6293 | 359/18723 | 5.97e-12 | 2.30e-10 | 183 |
| GO:000626013 | Thyroid | ATC | DNA replication | 124/6293 | 260/18723 | 1.58e-06 | 1.93e-05 | 124 |
| GO:00062756 | Thyroid | ATC | regulation of DNA replication | 50/6293 | 107/18723 | 3.25e-03 | 1.46e-02 | 50 |
| Page: 1 2 3 4 5 |
| Pathway ID | Tissue | Disease Stage | Description | Gene Ratio | Bg Ratio | pvalue | p.adjust | qvalue | Count |
| Page: 1 |
Top |
Cell-cell communication analysis |
| Identification of potential cell-cell interactions between two cell types and their ligand-receptor pairs for different disease states |
| Ligand | Receptor | LRpair | Pathway | Tissue | Disease Stage |
| Page: 1 |
Top |
Single-cell gene regulatory network inference analysis |
| Find out the significant the regulons (TFs) and the target genes of each regulon across cell types for different disease states |
| TF | Cell Type | Tissue | Disease Stage | Target Gene | RSS | Regulon Activity |
| ∗The dot plots of a searched regulon are shown for all cell subpopulations in each disease state of each tissue based on the regulon specific score inferred using pySCENIC and by calculating the average expression. |
| Page: 1 |
Top |
Somatic mutation of malignant transformation related genes |
| Annotation of somatic variants for genes involved in malignant transformation |
| Hugo Symbol | Variant Class | Variant Classification | dbSNP RS | HGVSc | HGVSp | HGVSp Short | SWISSPROT | BIOTYPE | SIFT | PolyPhen | Tumor Sample Barcode | Tissue | Histology | Sex | Age | Stage | Therapy Types | Drugs | Outcome |
| WDR18 | SNV | Missense_Mutation | novel | c.146N>A | p.Gly49Asp | p.G49D | Q9BV38 | protein_coding | tolerated(0.05) | possibly_damaging(0.814) | TCGA-JL-A3YW-01 | Breast | breast invasive carcinoma | Female | <65 | I/II | Unknown | Unknown | SD |
| WDR18 | SNV | Missense_Mutation | rs778985723 | c.827C>T | p.Ser276Leu | p.S276L | Q9BV38 | protein_coding | deleterious(0) | probably_damaging(0.999) | TCGA-Q1-A73O-01 | Cervix | cervical & endocervical cancer | Female | <65 | I/II | Chemotherapy | cisplatin | CR |
| WDR18 | insertion | Frame_Shift_Ins | novel | c.631_632insG | p.Ser211CysfsTer5 | p.S211Cfs*5 | Q9BV38 | protein_coding | TCGA-DS-A1OB-01 | Cervix | cervical & endocervical cancer | Female | <65 | I/II | Chemotherapy | carboplatin | PD | ||
| WDR18 | insertion | Frame_Shift_Ins | novel | c.632_633insA | p.Val212ArgfsTer4 | p.V212Rfs*4 | Q9BV38 | protein_coding | TCGA-DS-A1OB-01 | Cervix | cervical & endocervical cancer | Female | <65 | I/II | Chemotherapy | carboplatin | PD | ||
| WDR18 | SNV | Missense_Mutation | c.697N>A | p.Gly233Arg | p.G233R | Q9BV38 | protein_coding | deleterious(0) | probably_damaging(1) | TCGA-AD-6889-01 | Colorectum | colon adenocarcinoma | Male | >=65 | I/II | Chemotherapy | xeloda | PD | |
| WDR18 | deletion | Frame_Shift_Del | novel | c.619delG | p.Glu207SerfsTer15 | p.E207Sfs*15 | Q9BV38 | protein_coding | TCGA-AA-A022-01 | Colorectum | colon adenocarcinoma | Female | >=65 | I/II | Unknown | Unknown | SD | ||
| WDR18 | SNV | Missense_Mutation | rs376924638 | c.1195C>T | p.Arg399Cys | p.R399C | Q9BV38 | protein_coding | deleterious(0.03) | possibly_damaging(0.828) | TCGA-A5-A0G1-01 | Endometrium | uterine corpus endometrioid carcinoma | Female | >=65 | I/II | Unknown | Unknown | SD |
| WDR18 | SNV | Missense_Mutation | rs376924638 | c.1195C>T | p.Arg399Cys | p.R399C | Q9BV38 | protein_coding | deleterious(0.03) | possibly_damaging(0.828) | TCGA-A5-A0GG-01 | Endometrium | uterine corpus endometrioid carcinoma | Female | >=65 | I/II | Unknown | Unknown | SD |
| WDR18 | SNV | Missense_Mutation | novel | c.26N>A | p.Val9Glu | p.V9E | Q9BV38 | protein_coding | deleterious(0) | possibly_damaging(0.593) | TCGA-AP-A1DO-01 | Endometrium | uterine corpus endometrioid carcinoma | Female | <65 | I/II | Unknown | Unknown | SD |
| WDR18 | SNV | Missense_Mutation | rs775172395 | c.868N>A | p.Asp290Asn | p.D290N | Q9BV38 | protein_coding | deleterious(0) | probably_damaging(1) | TCGA-AP-A1DV-01 | Endometrium | uterine corpus endometrioid carcinoma | Female | <65 | I/II | Unknown | Unknown | SD |
| Page: 1 2 3 |
Top |
Related drugs of malignant transformation related genes |
| Identification of chemicals and drugs interact with genes involved in malignant transfromation |
| (DGIdb 4.0) |
| Entrez ID | Symbol | Category | Interaction Types | Drug Claim Name | Drug Name | PMIDs |
| Page: 1 |

Copyright 2023-Present -The University of Texas Health Science Center at Houston |