
|
|||||
|
 | |
| |
| |
| |
| |
| |
|
Gene: VPS13A |
Gene summary for VPS13A |
| Gene information | Species | Human | Gene symbol | VPS13A | Gene ID | 23230 |
| Gene name | vacuolar protein sorting 13 homolog A | |
| Gene Alias | CHAC | |
| Cytomap | 9q21.2 | |
| Gene Type | protein-coding | GO ID | GO:0000003 | UniProtAcc | Q96RL7 |
Top |
Malignant transformation analysis |
| Identification of the aberrant gene expression in precancerous and cancerous lesions by comparing the gene expression of stem-like cells in diseased tissues with normal stem cells |
| Entrez ID | Symbol | Replicates | Species | Organ | Tissue | Adj P-value | Log2FC | Malignancy |
| 23230 | VPS13A | HTA11_3410_2000001011 | Human | Colorectum | AD | 9.82e-24 | -7.16e-01 | 0.0155 |
| 23230 | VPS13A | HTA11_3361_2000001011 | Human | Colorectum | AD | 1.78e-02 | -4.96e-01 | -0.1207 |
| 23230 | VPS13A | HTA11_696_2000001011 | Human | Colorectum | AD | 5.62e-06 | -3.92e-01 | -0.1464 |
| 23230 | VPS13A | HTA11_866_2000001011 | Human | Colorectum | AD | 1.03e-04 | -3.90e-01 | -0.1001 |
| 23230 | VPS13A | HTA11_5212_2000001011 | Human | Colorectum | AD | 2.10e-02 | -6.32e-01 | -0.2061 |
| 23230 | VPS13A | HTA11_7862_2000001011 | Human | Colorectum | AD | 7.36e-05 | -6.81e-01 | -0.0179 |
| 23230 | VPS13A | HTA11_866_3004761011 | Human | Colorectum | AD | 1.15e-12 | -6.03e-01 | 0.096 |
| 23230 | VPS13A | HTA11_9408_2000001011 | Human | Colorectum | AD | 8.13e-03 | -8.51e-01 | 0.0451 |
| 23230 | VPS13A | HTA11_10711_2000001011 | Human | Colorectum | AD | 2.16e-10 | -6.40e-01 | 0.0338 |
| 23230 | VPS13A | HTA11_7696_3000711011 | Human | Colorectum | AD | 2.47e-11 | -4.47e-01 | 0.0674 |
| 23230 | VPS13A | HTA11_99999970781_79442 | Human | Colorectum | MSS | 2.09e-15 | -4.88e-01 | 0.294 |
| 23230 | VPS13A | HTA11_99999965062_69753 | Human | Colorectum | MSI-H | 4.79e-03 | 7.89e-01 | 0.3487 |
| 23230 | VPS13A | HTA11_99999965104_69814 | Human | Colorectum | MSS | 4.13e-03 | 5.23e-01 | 0.281 |
| 23230 | VPS13A | HTA11_99999973899_84307 | Human | Colorectum | MSS | 1.86e-02 | -5.22e-01 | 0.2585 |
| 23230 | VPS13A | HTA11_99999974143_84620 | Human | Colorectum | MSS | 7.75e-25 | -6.37e-01 | 0.3005 |
| 23230 | VPS13A | A015-C-203 | Human | Colorectum | FAP | 3.23e-35 | -3.44e-01 | -0.1294 |
| 23230 | VPS13A | A015-C-204 | Human | Colorectum | FAP | 2.17e-05 | -5.45e-02 | -0.0228 |
| 23230 | VPS13A | A014-C-040 | Human | Colorectum | FAP | 1.70e-05 | -4.55e-01 | -0.1184 |
| 23230 | VPS13A | A002-C-201 | Human | Colorectum | FAP | 8.03e-13 | -2.05e-01 | 0.0324 |
| 23230 | VPS13A | A002-C-203 | Human | Colorectum | FAP | 2.63e-03 | -2.64e-02 | 0.2786 |
| Page: 1 2 3 4 5 6 7 8 9 |
| Tissue | Expression Dynamics | Abbreviation |
| Colorectum (GSE201348) |  | FAP: Familial adenomatous polyposis |
| CRC: Colorectal cancer | ||
| Colorectum (HTA11) |  | AD: Adenomas |
| SER: Sessile serrated lesions | ||
| MSI-H: Microsatellite-high colorectal cancer | ||
| MSS: Microsatellite stable colorectal cancer | ||
| Esophagus | 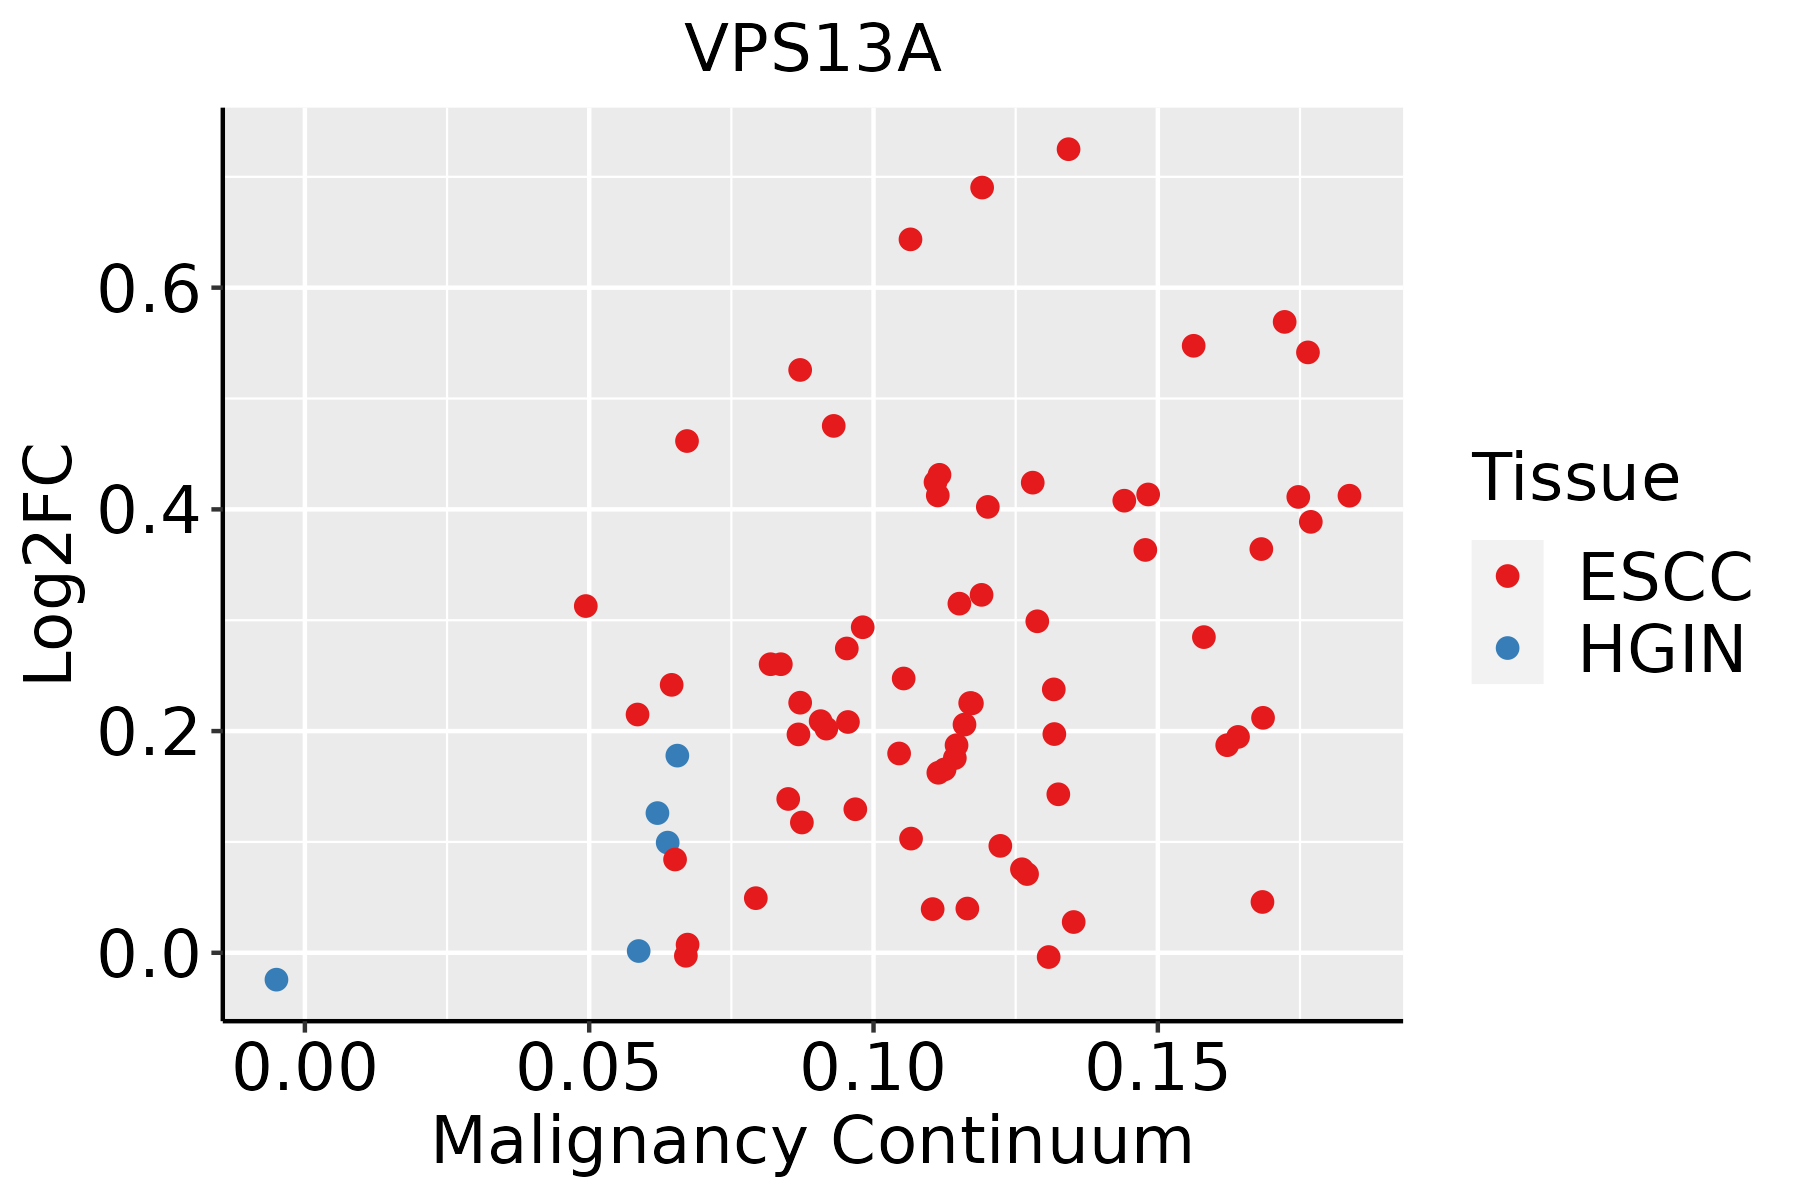 | ESCC: Esophageal squamous cell carcinoma |
| HGIN: High-grade intraepithelial neoplasias | ||
| LGIN: Low-grade intraepithelial neoplasias | ||
| Liver | 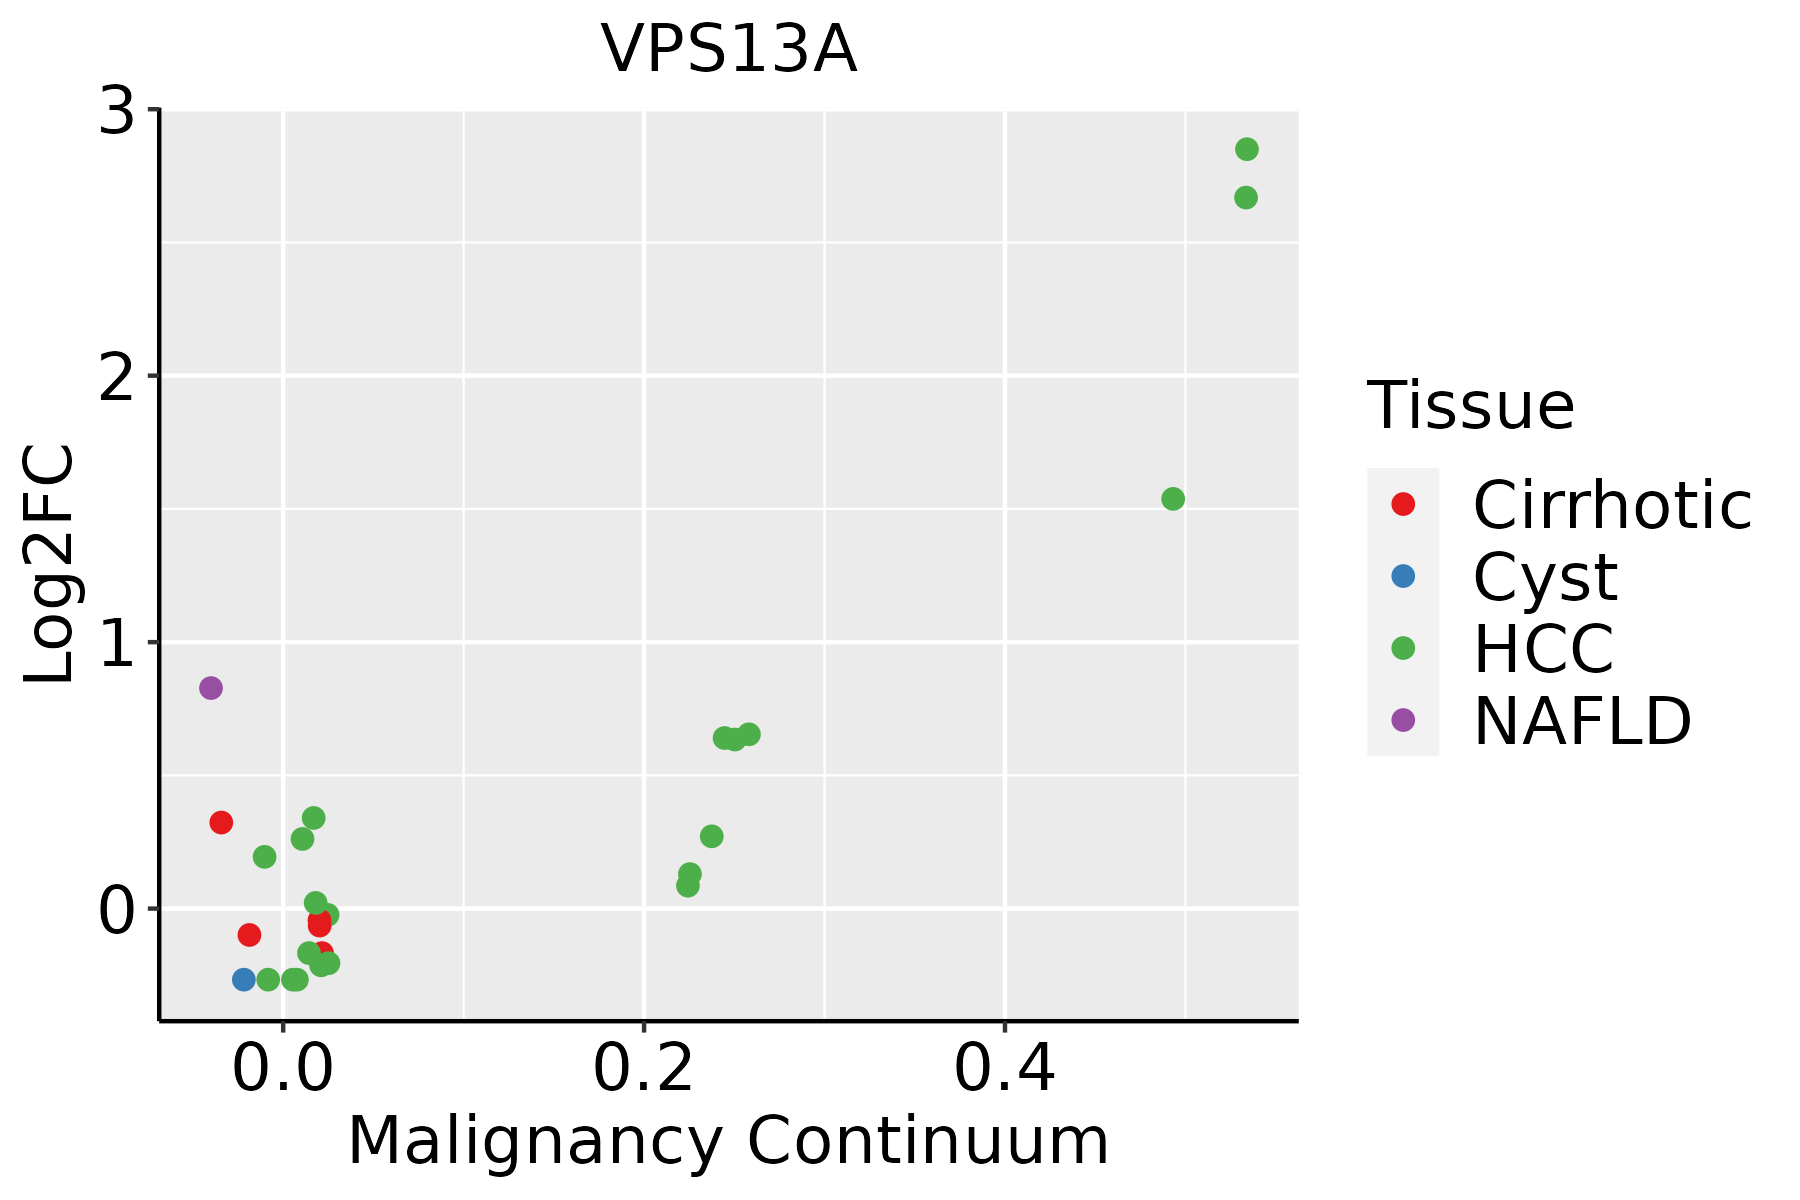 | HCC: Hepatocellular carcinoma |
| NAFLD: Non-alcoholic fatty liver disease | ||
| Lung |  | AAH: Atypical adenomatous hyperplasia |
| AIS: Adenocarcinoma in situ | ||
| IAC: Invasive lung adenocarcinoma | ||
| MIA: Minimally invasive adenocarcinoma | ||
| Oral Cavity | 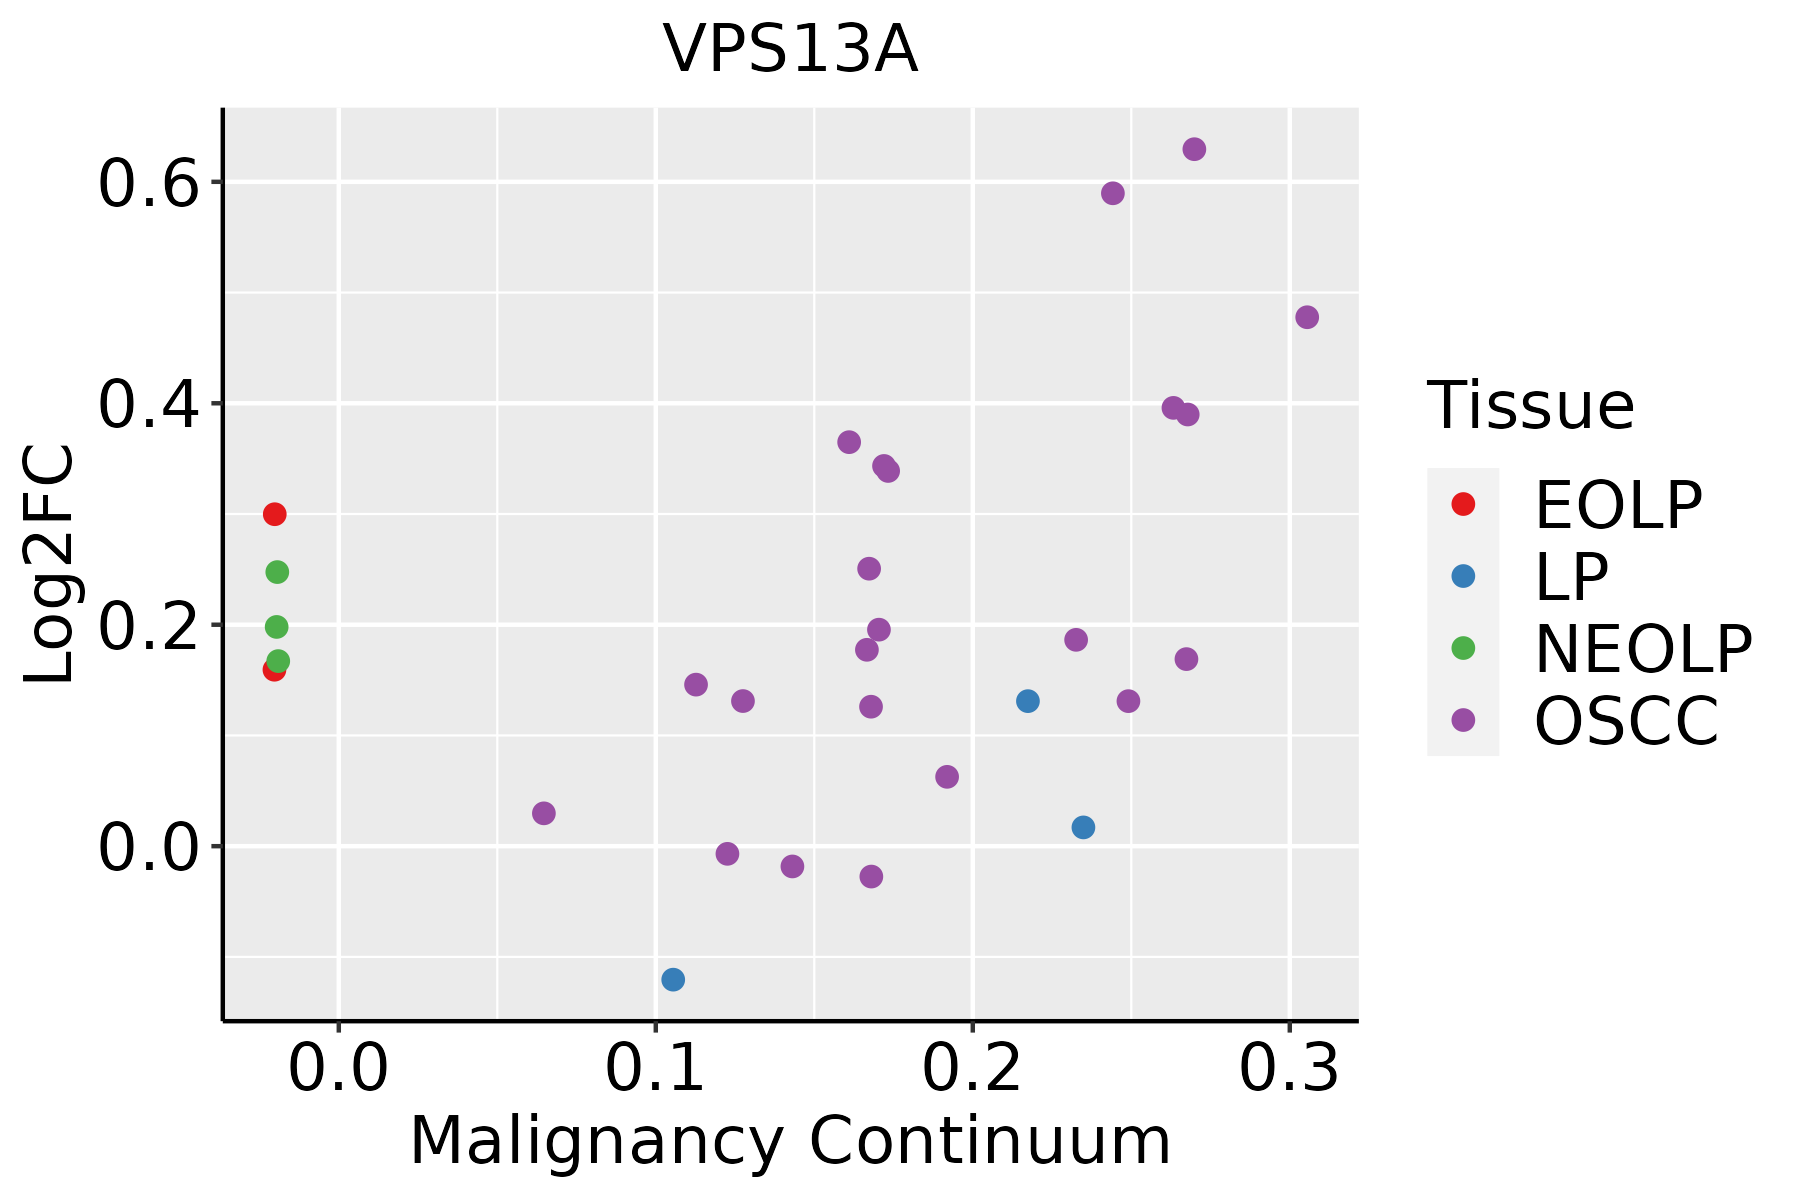 | EOLP: Erosive Oral lichen planus |
| LP: leukoplakia | ||
| NEOLP: Non-erosive oral lichen planus | ||
| OSCC: Oral squamous cell carcinoma | ||
| Prostate | 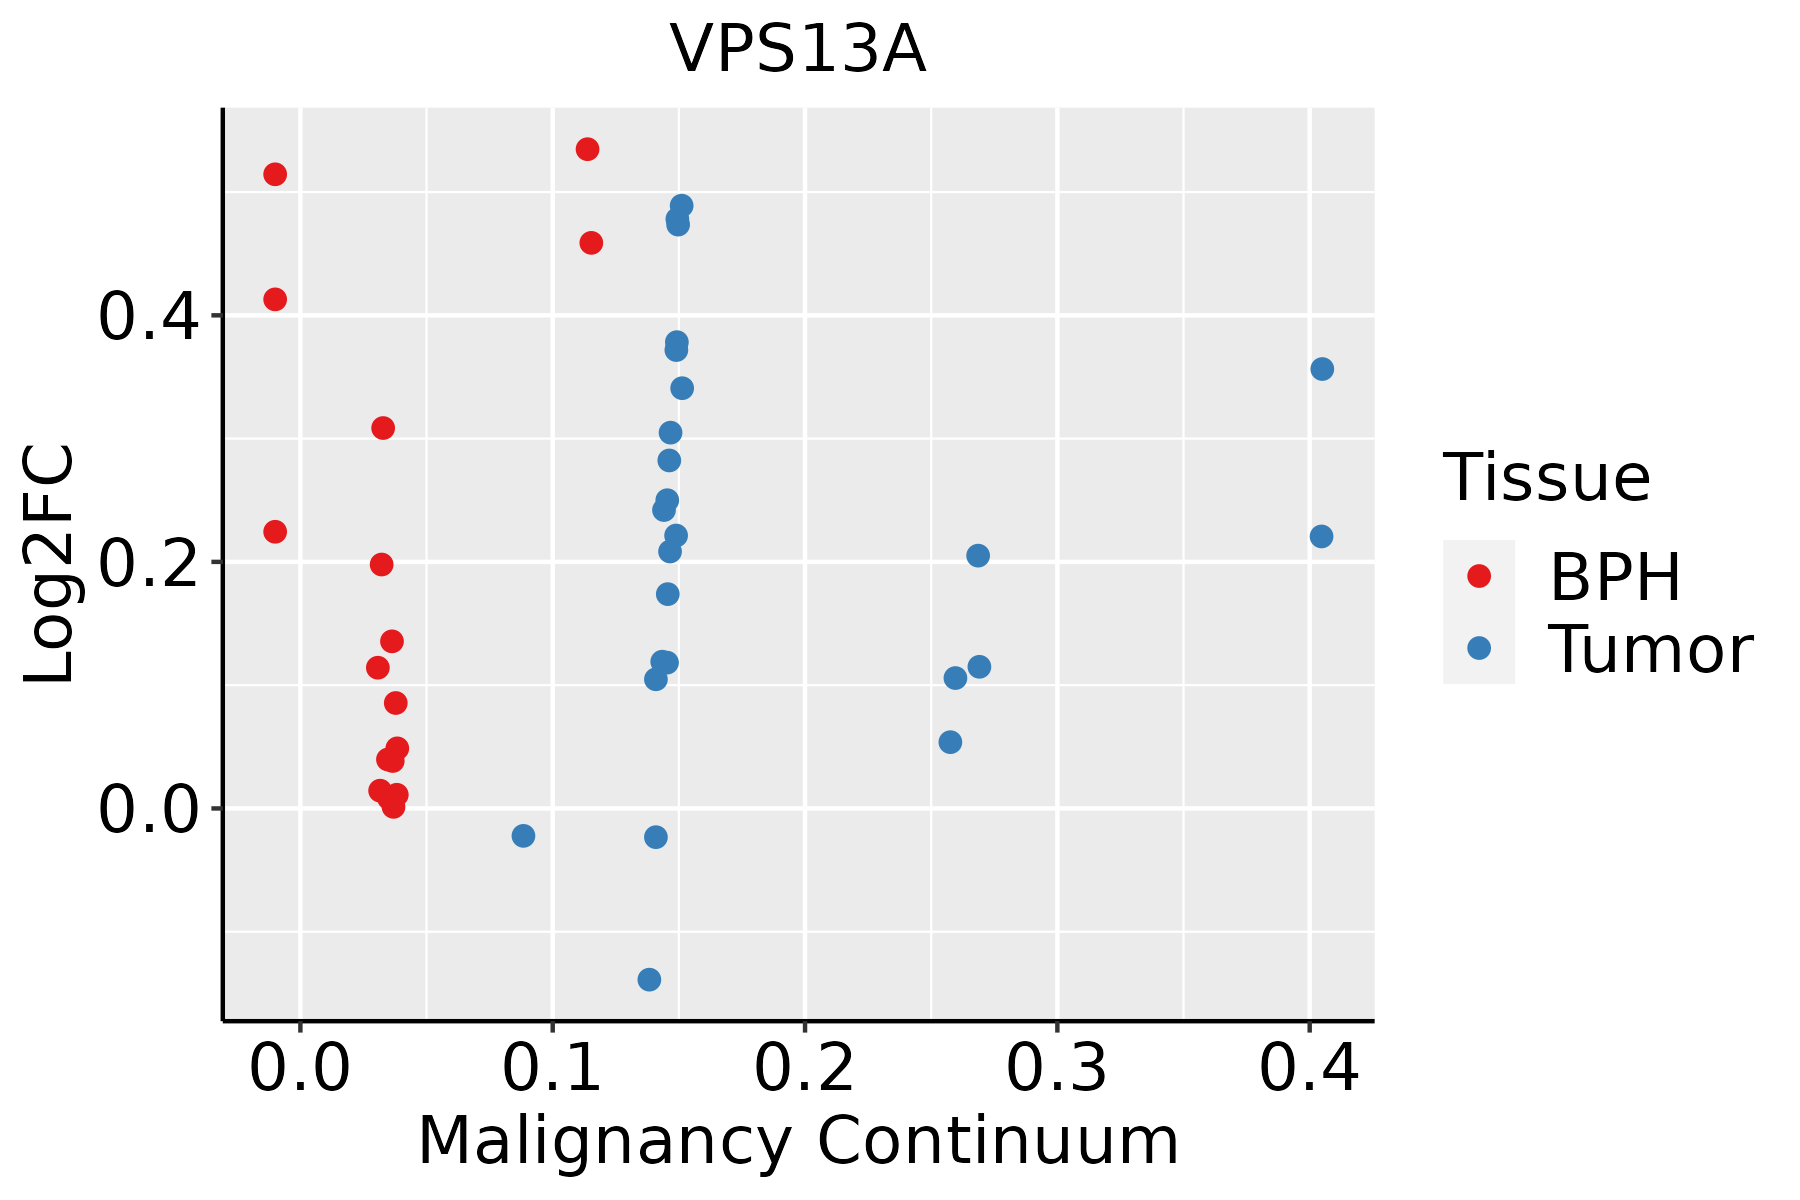 | BPH: Benign Prostatic Hyperplasia |
| Skin |  | AK: Actinic keratosis |
| cSCC: Cutaneous squamous cell carcinoma | ||
| SCCIS:squamous cell carcinoma in situ | ||
| Thyroid |  | ATC: Anaplastic thyroid cancer |
| HT: Hashimoto's thyroiditis | ||
| PTC: Papillary thyroid cancer |
| ∗log2FC in expression of this searched gene in stem-like cells from each diseased tissue sample relative to stem-like cells in normal samples in each tissue plotted against the malignancy continuum. Samples are colored based on if they are from different disease stage. |
Top |
Malignant transformation related pathway analysis |
| Find out the enriched GO biological processes and KEGG pathways involved in transition from healthy to precancer to cancer |
| Tissue | Disease Stage | Enriched GO biological Processes |
| Colorectum | AD |  |
| Colorectum | SER |  |
| Colorectum | MSS |  |
| Colorectum | MSI-H |  |
| Colorectum | FAP |  |
| ∗Top 15 enriched GO BP terms are showed in the bar plot of each disease state in each tissue. Each row represents a significant GO biological process which is colored according to the -log10(p.adjust). |
| Page: 1 2 3 4 5 6 7 8 9 |
| GO ID | Tissue | Disease Stage | Description | Gene Ratio | Bg Ratio | pvalue | p.adjust | Count |
| GO:005123511 | Liver | Cirrhotic | maintenance of location | 117/4634 | 327/18723 | 4.78e-06 | 7.86e-05 | 117 |
| GO:00726661 | Liver | Cirrhotic | establishment of protein localization to vacuole | 25/4634 | 49/18723 | 6.57e-05 | 7.47e-04 | 25 |
| GO:003406711 | Liver | Cirrhotic | protein localization to Golgi apparatus | 17/4634 | 29/18723 | 1.05e-04 | 1.08e-03 | 17 |
| GO:000662311 | Liver | Cirrhotic | protein targeting to vacuole | 20/4634 | 37/18723 | 1.25e-04 | 1.23e-03 | 20 |
| GO:00516517 | Liver | Cirrhotic | maintenance of location in cell | 76/4634 | 214/18723 | 2.66e-04 | 2.37e-03 | 76 |
| GO:0007039 | Liver | Cirrhotic | protein catabolic process in the vacuole | 11/4634 | 19/18723 | 2.09e-03 | 1.29e-02 | 11 |
| GO:1905146 | Liver | Cirrhotic | lysosomal protein catabolic process | 9/4634 | 15/18723 | 3.88e-03 | 2.10e-02 | 9 |
| GO:007259422 | Liver | HCC | establishment of protein localization to organelle | 299/7958 | 422/18723 | 1.06e-32 | 6.10e-30 | 299 |
| GO:004819321 | Liver | HCC | Golgi vesicle transport | 217/7958 | 296/18723 | 2.58e-27 | 1.02e-24 | 217 |
| GO:000660512 | Liver | HCC | protein targeting | 219/7958 | 314/18723 | 7.74e-23 | 1.49e-20 | 219 |
| GO:001648221 | Liver | HCC | cytosolic transport | 117/7958 | 168/18723 | 8.83e-13 | 4.48e-11 | 117 |
| GO:000703421 | Liver | HCC | vacuolar transport | 108/7958 | 157/18723 | 2.22e-11 | 8.69e-10 | 108 |
| GO:000689221 | Liver | HCC | post-Golgi vesicle-mediated transport | 77/7958 | 104/18723 | 6.14e-11 | 2.24e-09 | 77 |
| GO:005123521 | Liver | HCC | maintenance of location | 185/7958 | 327/18723 | 1.70e-07 | 3.12e-06 | 185 |
| GO:007266521 | Liver | HCC | protein localization to vacuole | 48/7958 | 67/18723 | 1.27e-06 | 1.85e-05 | 48 |
| GO:004518512 | Liver | HCC | maintenance of protein location | 61/7958 | 94/18723 | 9.61e-06 | 1.12e-04 | 61 |
| GO:00726662 | Liver | HCC | establishment of protein localization to vacuole | 35/7958 | 49/18723 | 3.90e-05 | 3.85e-04 | 35 |
| GO:000662321 | Liver | HCC | protein targeting to vacuole | 28/7958 | 37/18723 | 4.26e-05 | 4.16e-04 | 28 |
| GO:003406721 | Liver | HCC | protein localization to Golgi apparatus | 23/7958 | 29/18723 | 5.86e-05 | 5.38e-04 | 23 |
| GO:005165112 | Liver | HCC | maintenance of location in cell | 119/7958 | 214/18723 | 7.11e-05 | 6.39e-04 | 119 |
| Page: 1 2 3 4 5 6 7 8 9 10 11 12 13 |
| Pathway ID | Tissue | Disease Stage | Description | Gene Ratio | Bg Ratio | pvalue | p.adjust | qvalue | Count |
| Page: 1 |
Top |
Cell-cell communication analysis |
| Identification of potential cell-cell interactions between two cell types and their ligand-receptor pairs for different disease states |
| Ligand | Receptor | LRpair | Pathway | Tissue | Disease Stage |
| Page: 1 |
Top |
Single-cell gene regulatory network inference analysis |
| Find out the significant the regulons (TFs) and the target genes of each regulon across cell types for different disease states |
| TF | Cell Type | Tissue | Disease Stage | Target Gene | RSS | Regulon Activity |
| ∗The dot plots of a searched regulon are shown for all cell subpopulations in each disease state of each tissue based on the regulon specific score inferred using pySCENIC and by calculating the average expression. |
| Page: 1 |
Top |
Somatic mutation of malignant transformation related genes |
| Annotation of somatic variants for genes involved in malignant transformation |
| Hugo Symbol | Variant Class | Variant Classification | dbSNP RS | HGVSc | HGVSp | HGVSp Short | SWISSPROT | BIOTYPE | SIFT | PolyPhen | Tumor Sample Barcode | Tissue | Histology | Sex | Age | Stage | Therapy Types | Drugs | Outcome |
| VPS13A | SNV | Missense_Mutation | c.6793N>A | p.Asp2265Asn | p.D2265N | Q96RL7 | protein_coding | tolerated(0.07) | probably_damaging(0.975) | TCGA-A2-A0CL-01 | Breast | breast invasive carcinoma | Female | <65 | III/IV | Chemotherapy | cytoxan | SD | |
| VPS13A | SNV | Missense_Mutation | c.2969N>T | p.Asn990Ile | p.N990I | Q96RL7 | protein_coding | tolerated(0.07) | possibly_damaging(0.866) | TCGA-A2-A0EV-01 | Breast | breast invasive carcinoma | Female | >=65 | I/II | Unknown | Unknown | SD | |
| VPS13A | SNV | Missense_Mutation | c.1254N>C | p.Lys418Asn | p.K418N | Q96RL7 | protein_coding | deleterious(0.01) | benign(0.149) | TCGA-AC-A23H-01 | Breast | breast invasive carcinoma | Female | >=65 | I/II | Unknown | Unknown | PD | |
| VPS13A | SNV | Missense_Mutation | c.1482N>C | p.Leu494Phe | p.L494F | Q96RL7 | protein_coding | deleterious(0) | probably_damaging(0.951) | TCGA-AC-A23H-01 | Breast | breast invasive carcinoma | Female | >=65 | I/II | Unknown | Unknown | PD | |
| VPS13A | SNV | Missense_Mutation | c.1646N>T | p.Ser549Leu | p.S549L | Q96RL7 | protein_coding | tolerated(0.36) | benign(0) | TCGA-AC-A23H-01 | Breast | breast invasive carcinoma | Female | >=65 | I/II | Unknown | Unknown | PD | |
| VPS13A | SNV | Missense_Mutation | novel | c.9183N>T | p.Met3061Ile | p.M3061I | Q96RL7 | protein_coding | tolerated(0.17) | benign(0.013) | TCGA-AC-A3QQ-01 | Breast | breast invasive carcinoma | Female | <65 | I/II | Unknown | Unknown | SD |
| VPS13A | SNV | Missense_Mutation | novel | c.6256N>T | p.Asp2086Tyr | p.D2086Y | Q96RL7 | protein_coding | deleterious(0) | probably_damaging(0.999) | TCGA-AN-A046-01 | Breast | breast invasive carcinoma | Female | >=65 | I/II | Unknown | Unknown | SD |
| VPS13A | SNV | Missense_Mutation | rs777520036 | c.9377N>A | p.Arg3126Lys | p.R3126K | Q96RL7 | protein_coding | tolerated(0.17) | benign(0.078) | TCGA-AO-A03T-01 | Breast | breast invasive carcinoma | Female | <65 | I/II | Chemotherapy | cyclophosphamide | SD |
| VPS13A | SNV | Missense_Mutation | c.6948N>C | p.Met2316Ile | p.M2316I | Q96RL7 | protein_coding | tolerated(0.26) | benign(0.009) | TCGA-BH-A0AV-01 | Breast | breast invasive carcinoma | Female | <65 | I/II | Chemotherapy | taxotere | CR | |
| VPS13A | SNV | Missense_Mutation | c.6988N>A | p.Glu2330Lys | p.E2330K | Q96RL7 | protein_coding | tolerated(0.52) | benign(0.328) | TCGA-BH-A0B4-01 | Breast | breast invasive carcinoma | Male | >=65 | III/IV | Hormone Therapy | tamoxiphen | SD |
| Page: 1 2 3 4 5 6 7 8 9 10 11 12 13 14 15 16 17 18 19 20 21 22 23 24 25 26 27 28 29 30 31 32 33 34 35 36 37 |
Top |
Related drugs of malignant transformation related genes |
| Identification of chemicals and drugs interact with genes involved in malignant transfromation |
| (DGIdb 4.0) |
| Entrez ID | Symbol | Category | Interaction Types | Drug Claim Name | Drug Name | PMIDs |
| Page: 1 |

Copyright 2023-Present -The University of Texas Health Science Center at Houston |