
|
|||||
|
 | |
| |
| |
| |
| |
| |
|
Gene: VAMP2 |
Gene summary for VAMP2 |
| Gene information | Species | Human | Gene symbol | VAMP2 | Gene ID | 6844 |
| Gene name | vesicle associated membrane protein 2 | |
| Gene Alias | NEDHAHM | |
| Cytomap | 17p13.1 | |
| Gene Type | protein-coding | GO ID | GO:0001505 | UniProtAcc | F8WCA0 |
Top |
Malignant transformation analysis |
| Identification of the aberrant gene expression in precancerous and cancerous lesions by comparing the gene expression of stem-like cells in diseased tissues with normal stem cells |
| Entrez ID | Symbol | Replicates | Species | Organ | Tissue | Adj P-value | Log2FC | Malignancy |
| 6844 | VAMP2 | GSM4909281 | Human | Breast | IDC | 1.05e-02 | -2.22e-01 | 0.21 |
| 6844 | VAMP2 | GSM4909282 | Human | Breast | IDC | 5.23e-05 | -2.97e-01 | -0.0288 |
| 6844 | VAMP2 | GSM4909285 | Human | Breast | IDC | 6.25e-10 | -3.86e-01 | 0.21 |
| 6844 | VAMP2 | GSM4909286 | Human | Breast | IDC | 8.68e-04 | -1.76e-01 | 0.1081 |
| 6844 | VAMP2 | GSM4909287 | Human | Breast | IDC | 9.85e-23 | -4.86e-01 | 0.2057 |
| 6844 | VAMP2 | GSM4909290 | Human | Breast | IDC | 1.70e-11 | -4.22e-01 | 0.2096 |
| 6844 | VAMP2 | GSM4909291 | Human | Breast | IDC | 7.38e-04 | -2.87e-01 | 0.1753 |
| 6844 | VAMP2 | GSM4909294 | Human | Breast | IDC | 5.81e-17 | -4.32e-01 | 0.2022 |
| 6844 | VAMP2 | GSM4909296 | Human | Breast | IDC | 5.76e-15 | -3.67e-01 | 0.1524 |
| 6844 | VAMP2 | GSM4909297 | Human | Breast | IDC | 2.97e-15 | -1.23e-01 | 0.1517 |
| 6844 | VAMP2 | GSM4909301 | Human | Breast | IDC | 3.64e-02 | 2.59e-01 | 0.1577 |
| 6844 | VAMP2 | GSM4909304 | Human | Breast | IDC | 1.28e-05 | -3.39e-01 | 0.1636 |
| 6844 | VAMP2 | GSM4909305 | Human | Breast | IDC | 3.89e-04 | 4.07e-01 | 0.0436 |
| 6844 | VAMP2 | GSM4909309 | Human | Breast | IDC | 4.88e-02 | 1.04e-01 | 0.0483 |
| 6844 | VAMP2 | GSM4909311 | Human | Breast | IDC | 7.88e-31 | -3.42e-01 | 0.1534 |
| 6844 | VAMP2 | GSM4909312 | Human | Breast | IDC | 4.84e-12 | -1.12e-01 | 0.1552 |
| 6844 | VAMP2 | GSM4909313 | Human | Breast | IDC | 5.43e-17 | 3.95e-01 | 0.0391 |
| 6844 | VAMP2 | GSM4909315 | Human | Breast | IDC | 1.22e-12 | -4.17e-01 | 0.21 |
| 6844 | VAMP2 | GSM4909316 | Human | Breast | IDC | 6.21e-09 | -4.33e-01 | 0.21 |
| 6844 | VAMP2 | GSM4909319 | Human | Breast | IDC | 2.88e-40 | -3.15e-01 | 0.1563 |
| Page: 1 2 3 4 5 6 7 8 9 10 11 12 |
| Tissue | Expression Dynamics | Abbreviation |
| Breast |  | IDC: Invasive ductal carcinoma |
| DCIS: Ductal carcinoma in situ | ||
| Precancer(BRCA1-mut): Precancerous lesion from BRCA1 mutation carriers | ||
| Colorectum (GSE201348) |  | FAP: Familial adenomatous polyposis |
| CRC: Colorectal cancer | ||
| Colorectum (HTA11) | 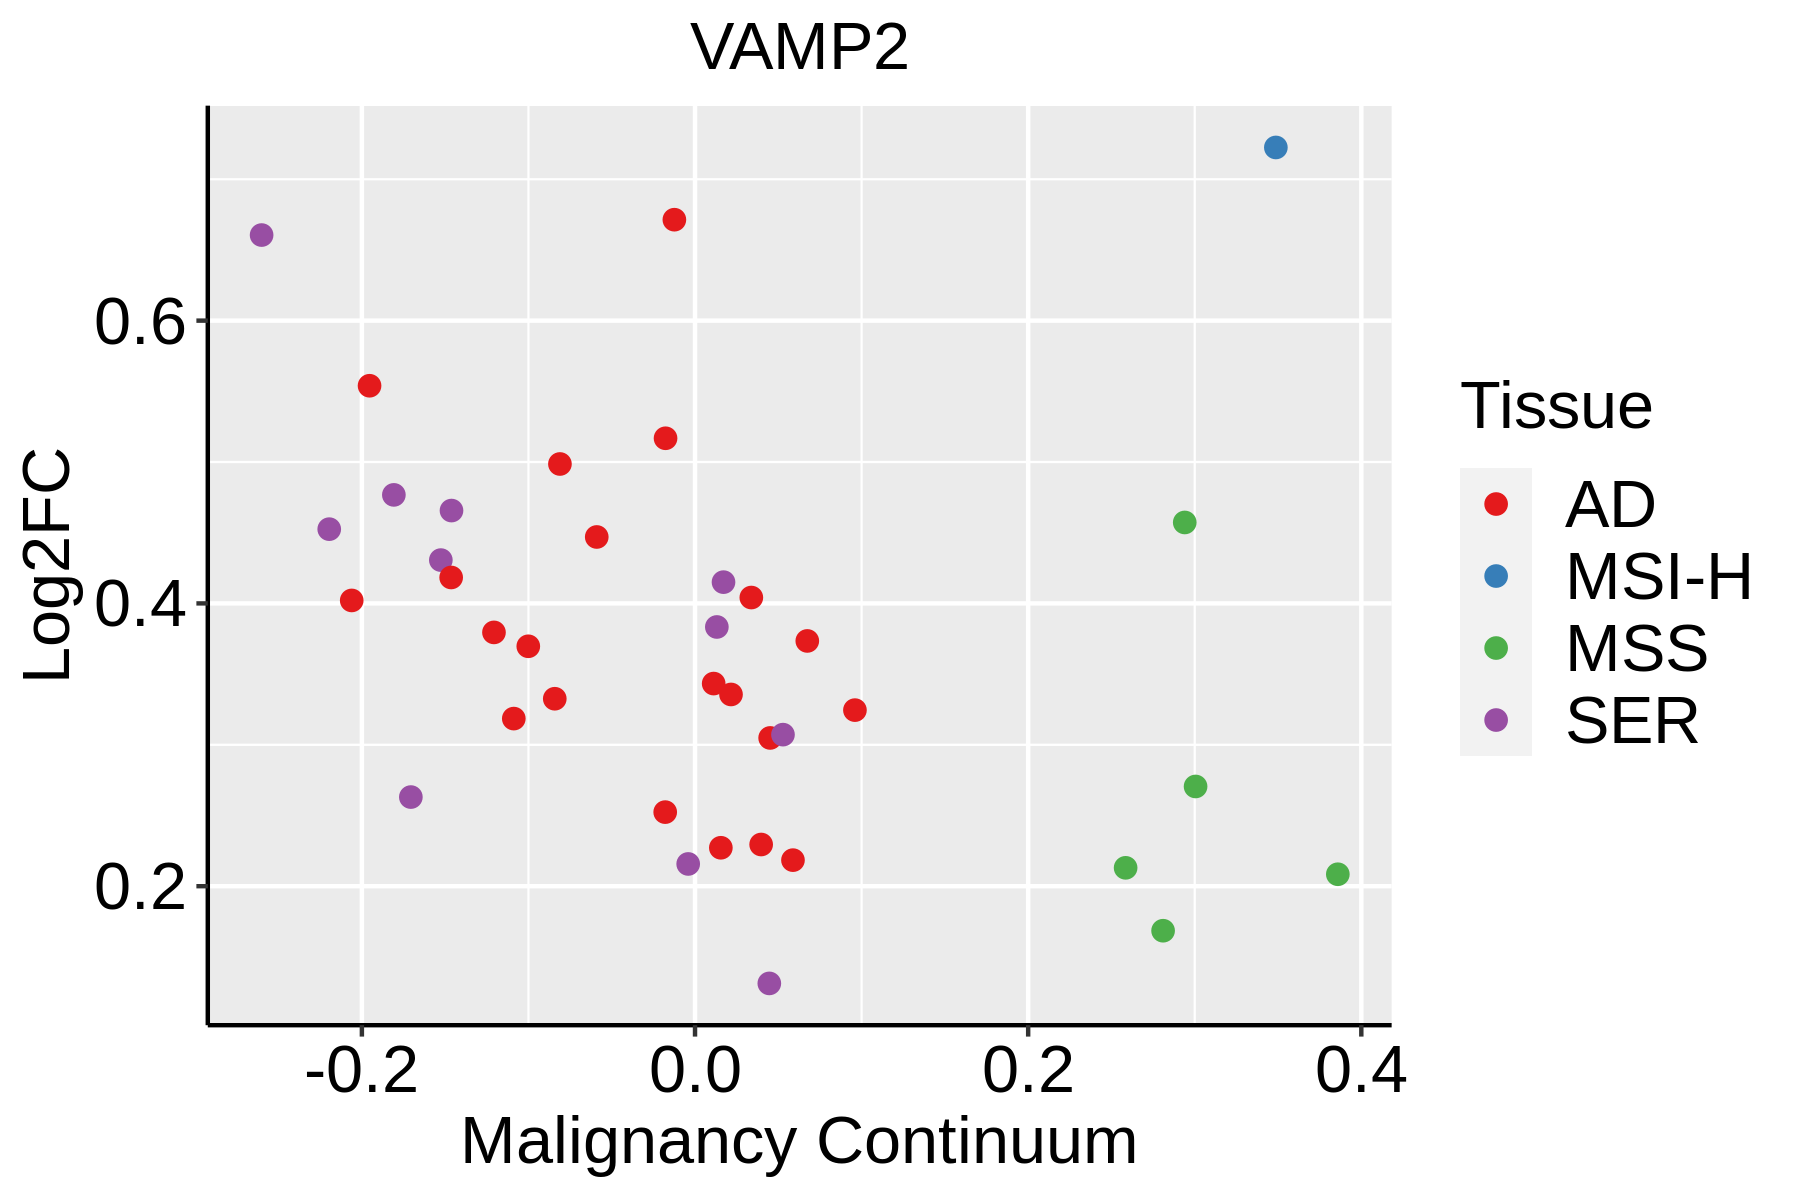 | AD: Adenomas |
| SER: Sessile serrated lesions | ||
| MSI-H: Microsatellite-high colorectal cancer | ||
| MSS: Microsatellite stable colorectal cancer | ||
| Endometrium | 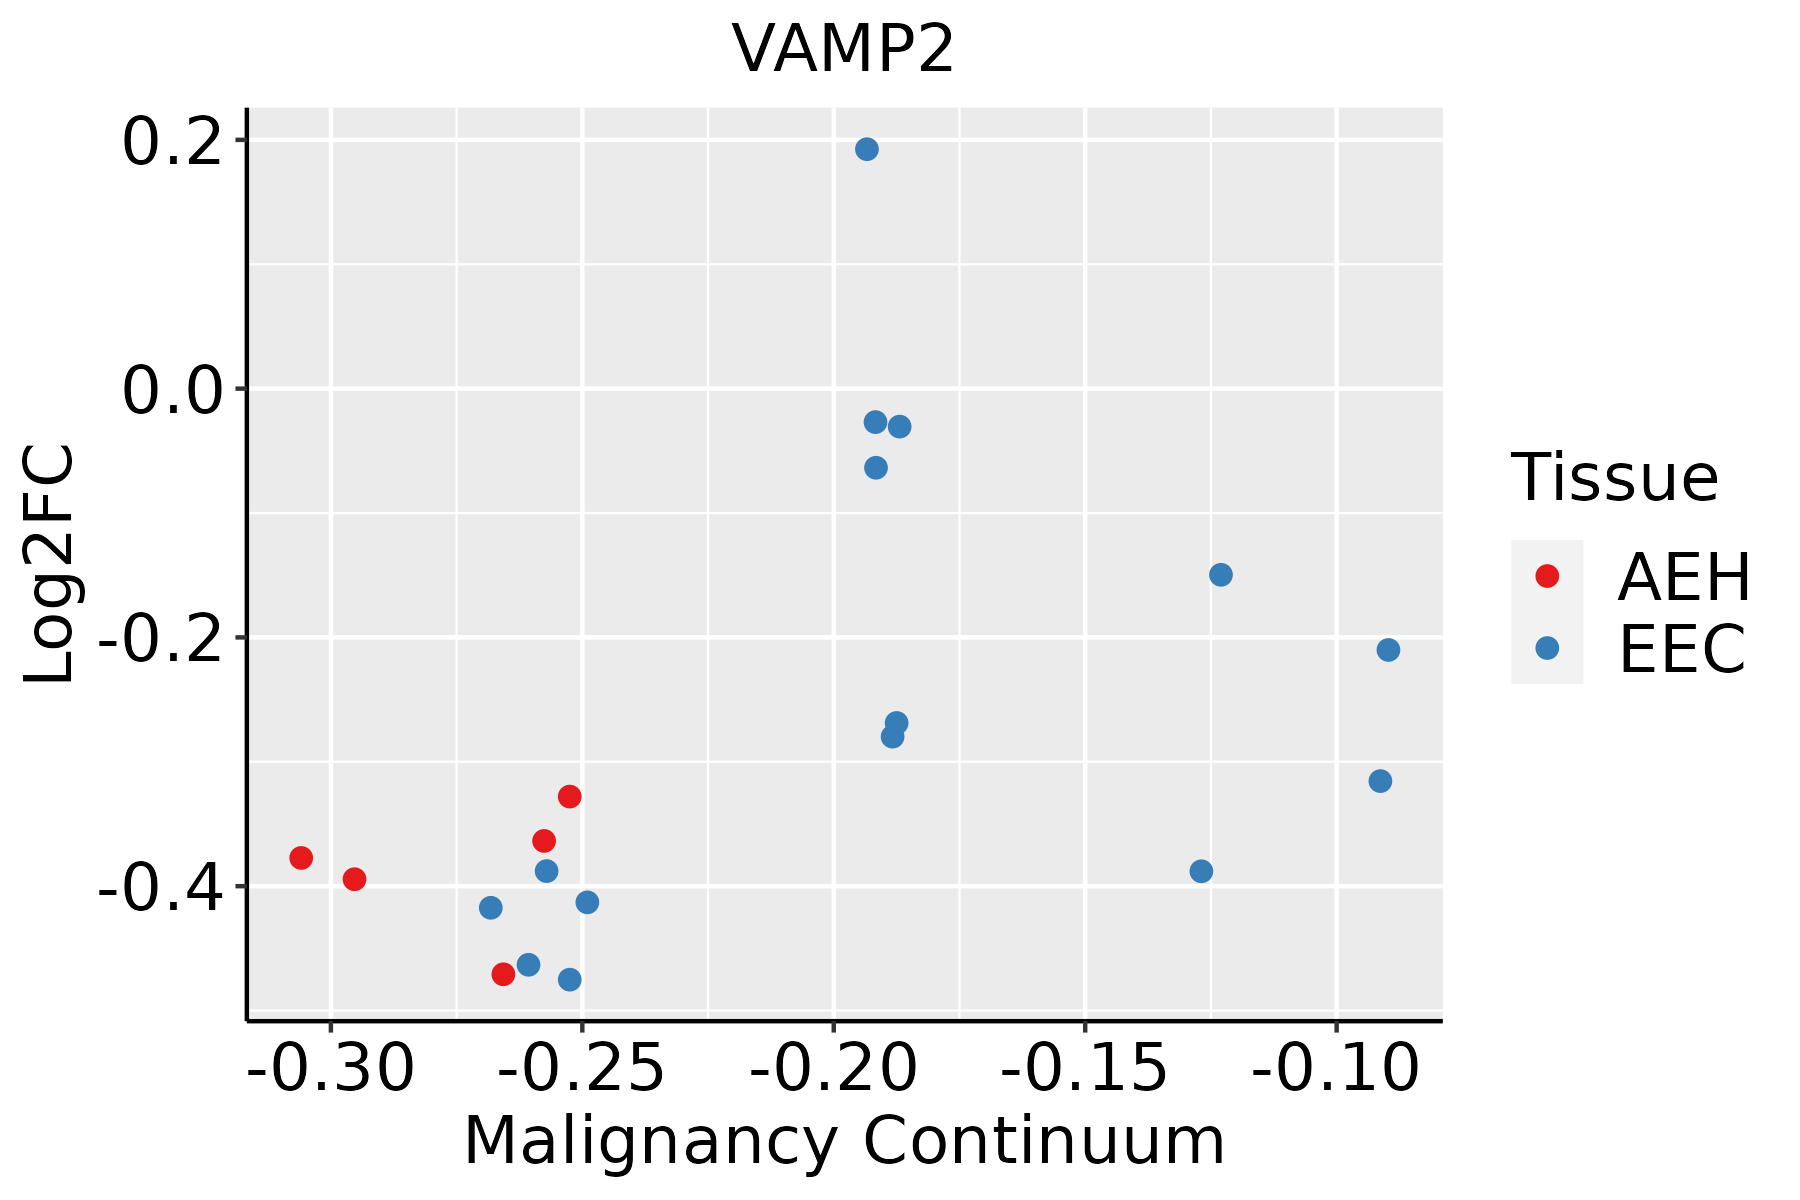 | AEH: Atypical endometrial hyperplasia |
| EEC: Endometrioid Cancer | ||
| Esophagus | 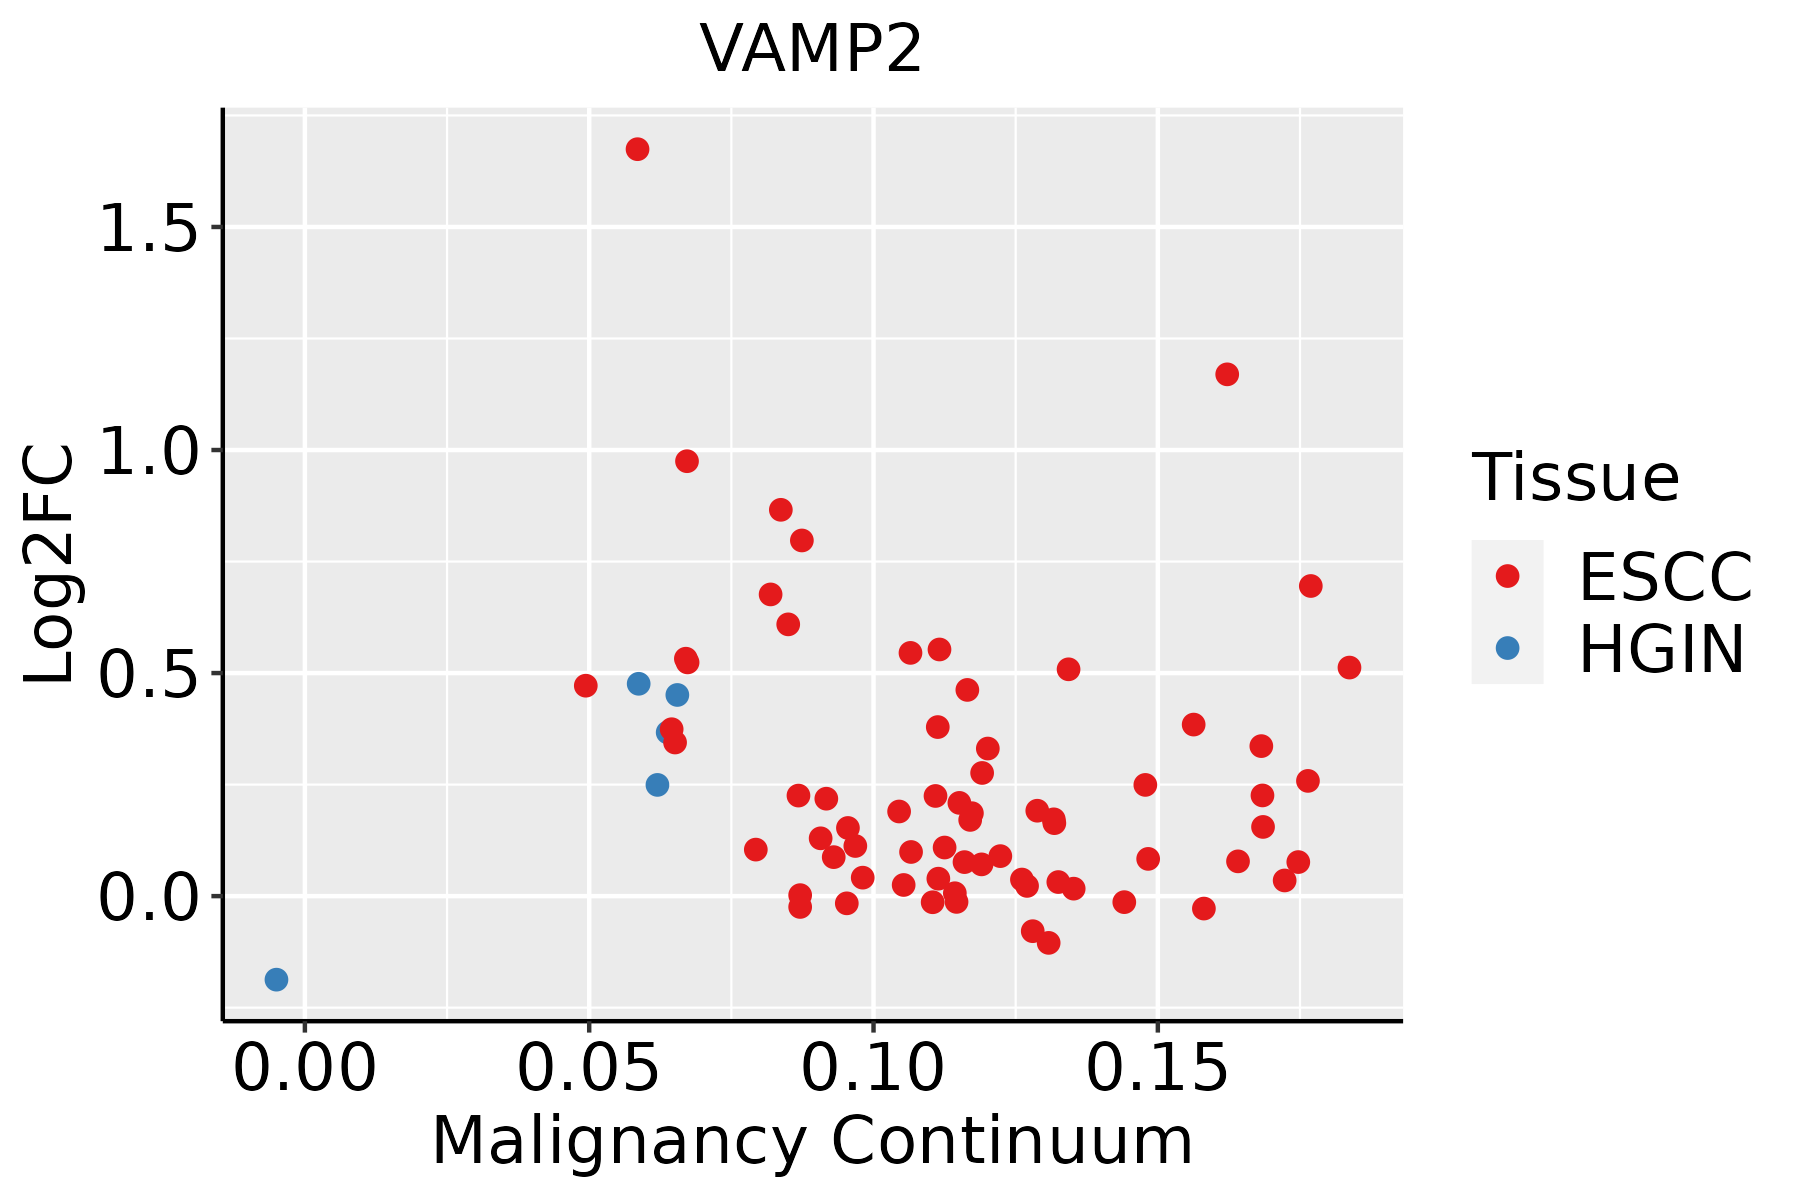 | ESCC: Esophageal squamous cell carcinoma |
| HGIN: High-grade intraepithelial neoplasias | ||
| LGIN: Low-grade intraepithelial neoplasias | ||
| Liver |  | HCC: Hepatocellular carcinoma |
| NAFLD: Non-alcoholic fatty liver disease | ||
| Oral Cavity |  | EOLP: Erosive Oral lichen planus |
| LP: leukoplakia | ||
| NEOLP: Non-erosive oral lichen planus | ||
| OSCC: Oral squamous cell carcinoma | ||
| Prostate | 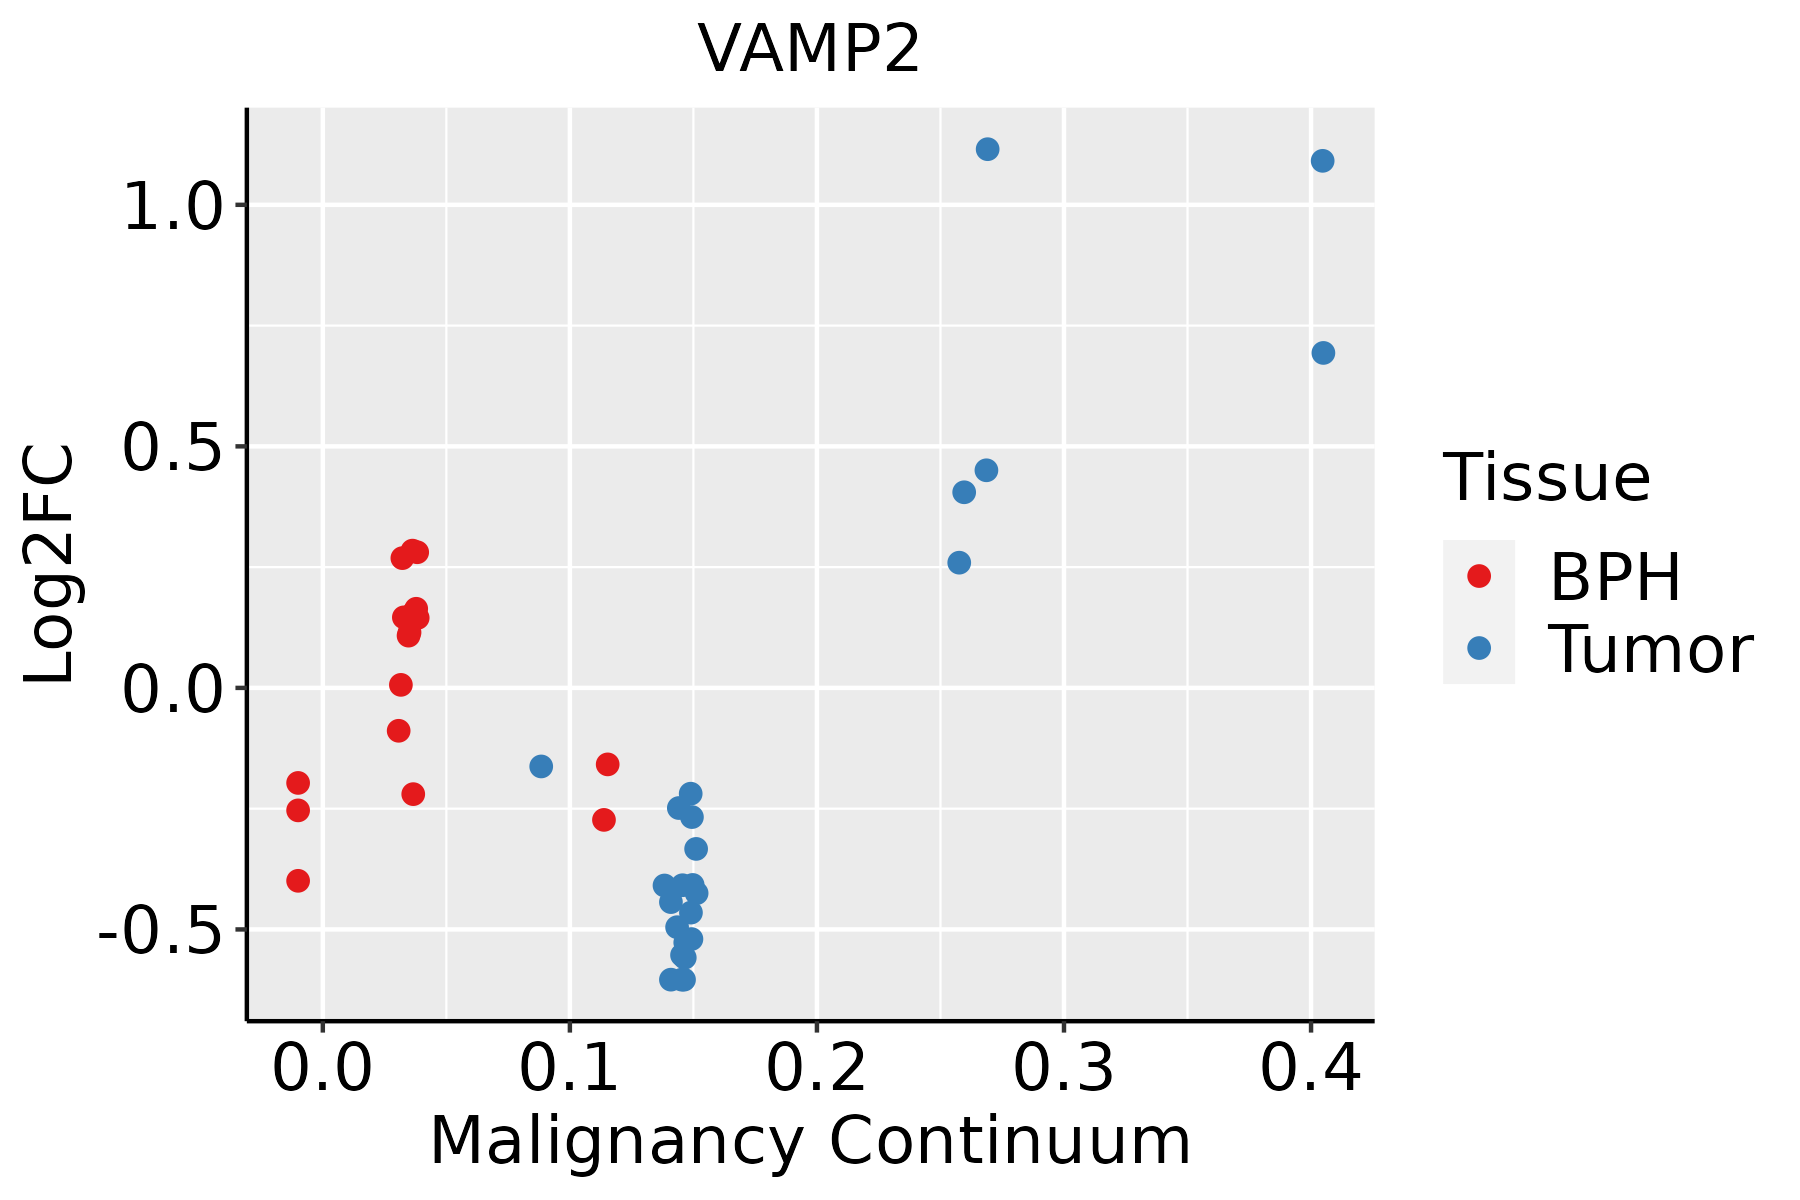 | BPH: Benign Prostatic Hyperplasia |
| Skin | 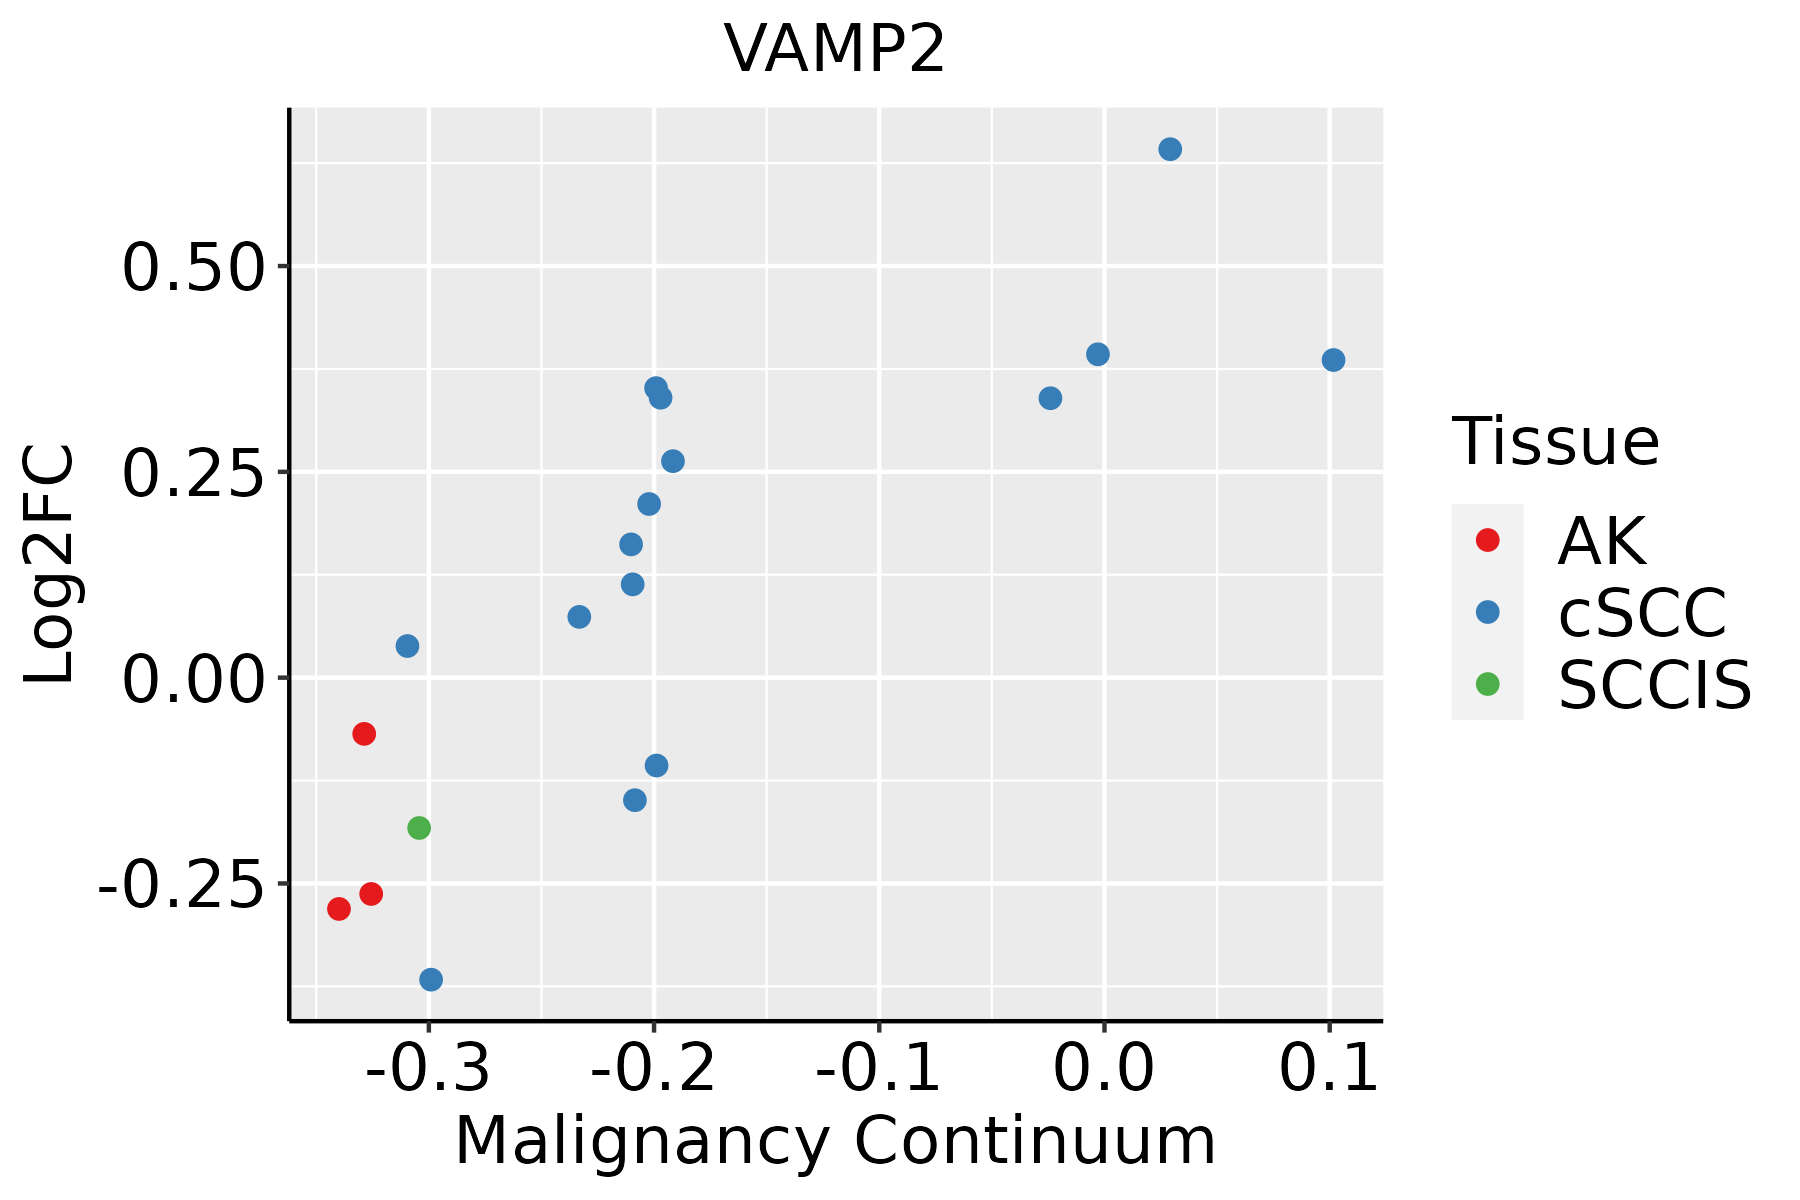 | AK: Actinic keratosis |
| cSCC: Cutaneous squamous cell carcinoma | ||
| SCCIS:squamous cell carcinoma in situ | ||
| Thyroid | 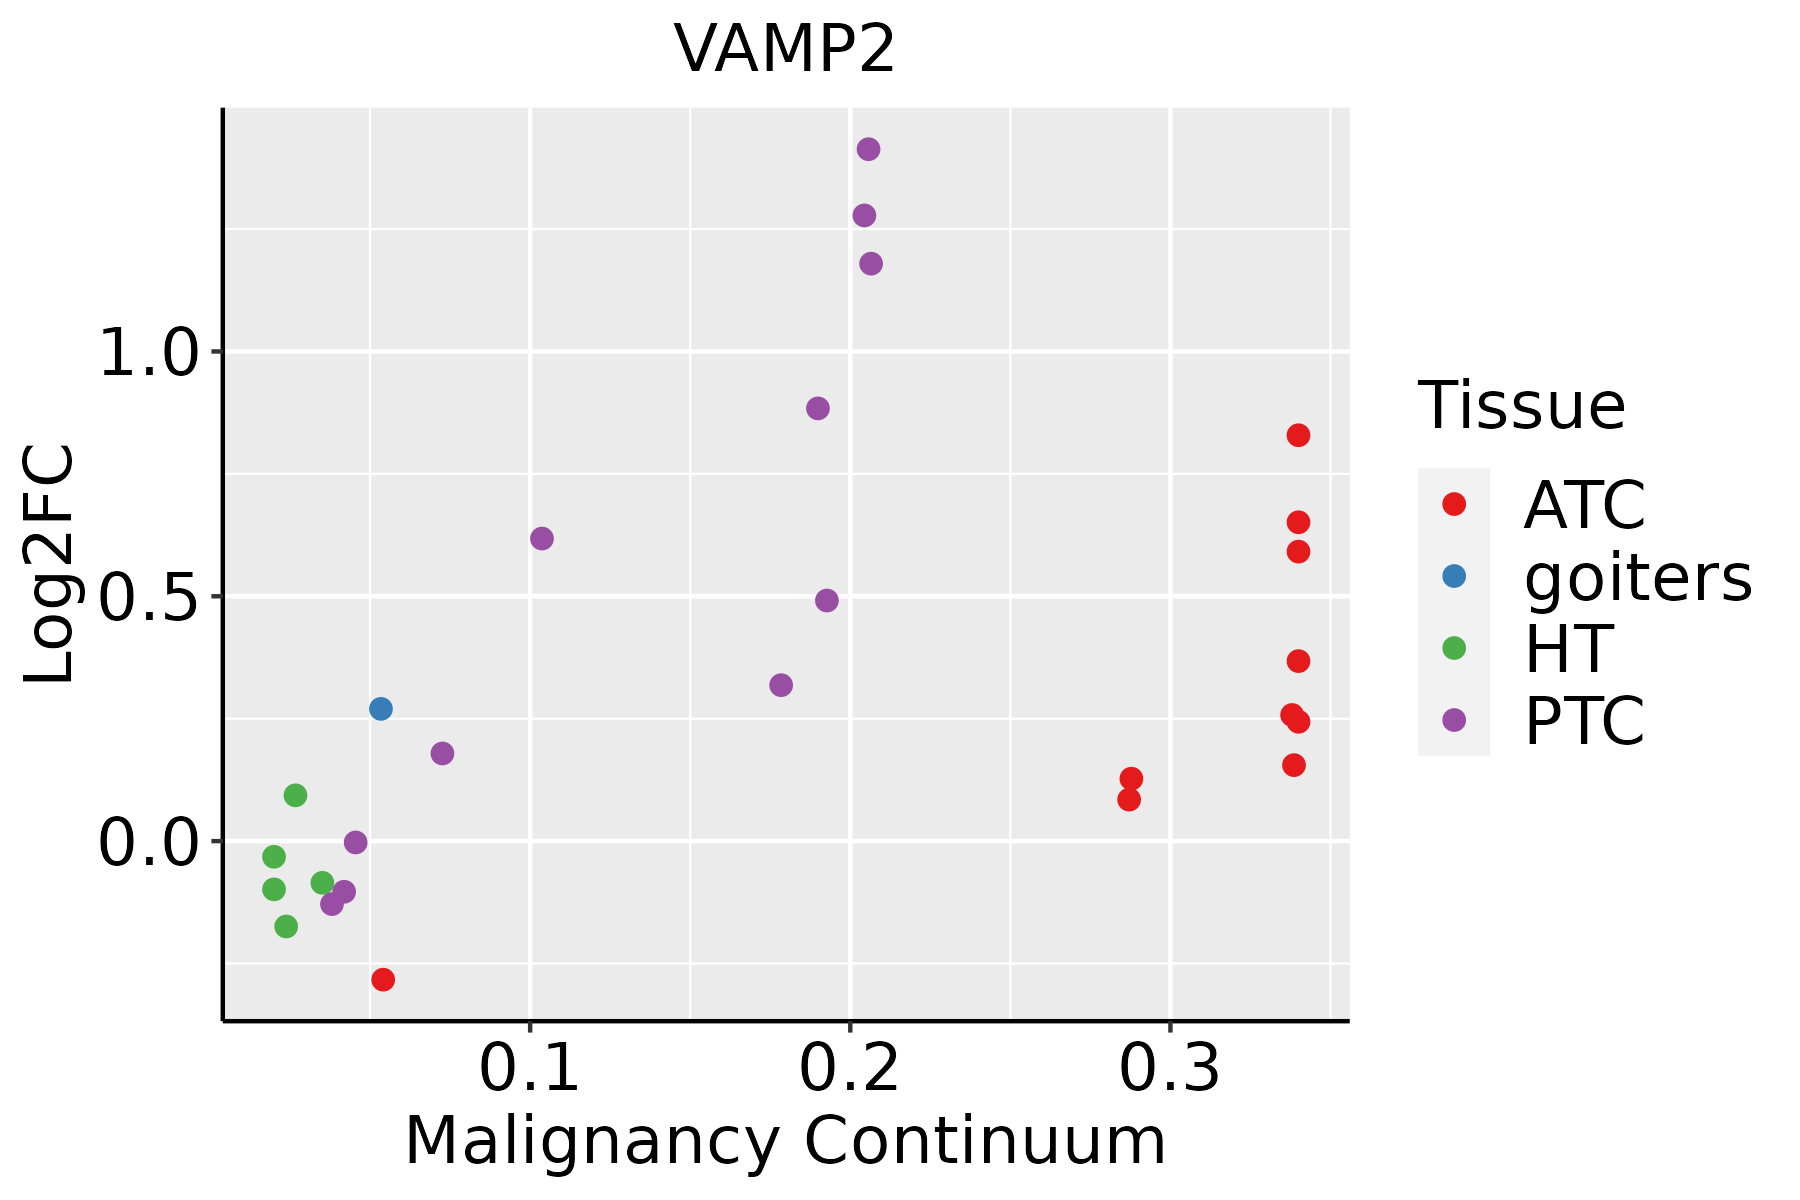 | ATC: Anaplastic thyroid cancer |
| HT: Hashimoto's thyroiditis | ||
| PTC: Papillary thyroid cancer |
| ∗log2FC in expression of this searched gene in stem-like cells from each diseased tissue sample relative to stem-like cells in normal samples in each tissue plotted against the malignancy continuum. Samples are colored based on if they are from different disease stage. |
Top |
Malignant transformation related pathway analysis |
| Find out the enriched GO biological processes and KEGG pathways involved in transition from healthy to precancer to cancer |
| Tissue | Disease Stage | Enriched GO biological Processes |
| Colorectum | AD |  |
| Colorectum | SER |  |
| Colorectum | MSS |  |
| Colorectum | MSI-H |  |
| Colorectum | FAP |  |
| ∗Top 15 enriched GO BP terms are showed in the bar plot of each disease state in each tissue. Each row represents a significant GO biological process which is colored according to the -log10(p.adjust). |
| Page: 1 2 3 4 5 6 7 8 9 |
| GO ID | Tissue | Disease Stage | Description | Gene Ratio | Bg Ratio | pvalue | p.adjust | Count |
| GO:00328691 | Colorectum | SER | cellular response to insulin stimulus | 51/2897 | 203/18723 | 2.30e-04 | 3.96e-03 | 51 |
| GO:00988761 | Colorectum | SER | vesicle-mediated transport to the plasma membrane | 37/2897 | 136/18723 | 3.08e-04 | 5.00e-03 | 37 |
| GO:00160501 | Colorectum | SER | vesicle organization | 69/2897 | 300/18723 | 3.59e-04 | 5.61e-03 | 69 |
| GO:00097431 | Colorectum | SER | response to carbohydrate | 60/2897 | 253/18723 | 3.66e-04 | 5.67e-03 | 60 |
| GO:00097491 | Colorectum | SER | response to glucose | 52/2897 | 212/18723 | 3.75e-04 | 5.74e-03 | 52 |
| GO:00619511 | Colorectum | SER | establishment of protein localization to plasma membrane | 20/2897 | 60/18723 | 4.60e-04 | 6.65e-03 | 20 |
| GO:00097461 | Colorectum | SER | response to hexose | 53/2897 | 219/18723 | 4.69e-04 | 6.76e-03 | 53 |
| GO:00430011 | Colorectum | SER | Golgi to plasma membrane protein transport | 14/2897 | 40/18723 | 1.88e-03 | 1.90e-02 | 14 |
| GO:00068871 | Colorectum | SER | exocytosis | 75/2897 | 352/18723 | 2.05e-03 | 2.03e-02 | 75 |
| GO:0032409 | Colorectum | SER | regulation of transporter activity | 65/2897 | 310/18723 | 5.71e-03 | 4.19e-02 | 65 |
| GO:00171571 | Colorectum | SER | regulation of exocytosis | 45/2897 | 202/18723 | 6.46e-03 | 4.63e-02 | 45 |
| GO:00726592 | Colorectum | MSS | protein localization to plasma membrane | 113/3467 | 284/18723 | 3.23e-17 | 1.55e-14 | 113 |
| GO:19907782 | Colorectum | MSS | protein localization to cell periphery | 120/3467 | 333/18723 | 2.02e-14 | 5.47e-12 | 120 |
| GO:19049512 | Colorectum | MSS | positive regulation of establishment of protein localization | 110/3467 | 319/18723 | 6.30e-12 | 9.83e-10 | 110 |
| GO:00512222 | Colorectum | MSS | positive regulation of protein transport | 104/3467 | 303/18723 | 3.23e-11 | 4.11e-09 | 104 |
| GO:00481932 | Colorectum | MSS | Golgi vesicle transport | 101/3467 | 296/18723 | 9.09e-11 | 9.77e-09 | 101 |
| GO:00901502 | Colorectum | MSS | establishment of protein localization to membrane | 90/3467 | 260/18723 | 4.11e-10 | 3.49e-08 | 90 |
| GO:00988762 | Colorectum | MSS | vesicle-mediated transport to the plasma membrane | 54/3467 | 136/18723 | 6.20e-09 | 3.95e-07 | 54 |
| GO:00903162 | Colorectum | MSS | positive regulation of intracellular protein transport | 60/3467 | 160/18723 | 1.18e-08 | 7.08e-07 | 60 |
| GO:00323882 | Colorectum | MSS | positive regulation of intracellular transport | 70/3467 | 202/18723 | 3.32e-08 | 1.82e-06 | 70 |
| Page: 1 2 3 4 5 6 7 8 9 10 11 12 13 14 15 16 17 18 19 20 21 22 23 24 25 26 27 |
| Pathway ID | Tissue | Disease Stage | Description | Gene Ratio | Bg Ratio | pvalue | p.adjust | qvalue | Count |
| hsa049704 | Breast | IDC | Salivary secretion | 18/867 | 93/8465 | 5.69e-03 | 3.13e-02 | 2.34e-02 | 18 |
| hsa0497011 | Breast | IDC | Salivary secretion | 18/867 | 93/8465 | 5.69e-03 | 3.13e-02 | 2.34e-02 | 18 |
| hsa04962 | Colorectum | AD | Vasopressin-regulated water reabsorption | 19/2092 | 44/8465 | 5.48e-03 | 2.48e-02 | 1.58e-02 | 19 |
| hsa049621 | Colorectum | AD | Vasopressin-regulated water reabsorption | 19/2092 | 44/8465 | 5.48e-03 | 2.48e-02 | 1.58e-02 | 19 |
| hsa049622 | Colorectum | MSS | Vasopressin-regulated water reabsorption | 17/1875 | 44/8465 | 9.76e-03 | 3.55e-02 | 2.18e-02 | 17 |
| hsa049623 | Colorectum | MSS | Vasopressin-regulated water reabsorption | 17/1875 | 44/8465 | 9.76e-03 | 3.55e-02 | 2.18e-02 | 17 |
| hsa049627 | Esophagus | HGIN | Vasopressin-regulated water reabsorption | 14/1383 | 44/8465 | 8.21e-03 | 4.71e-02 | 3.74e-02 | 14 |
| hsa0496214 | Esophagus | HGIN | Vasopressin-regulated water reabsorption | 14/1383 | 44/8465 | 8.21e-03 | 4.71e-02 | 3.74e-02 | 14 |
| hsa041305 | Esophagus | ESCC | SNARE interactions in vesicular transport | 28/4205 | 33/8465 | 2.75e-05 | 1.32e-04 | 6.75e-05 | 28 |
| hsa0496223 | Esophagus | ESCC | Vasopressin-regulated water reabsorption | 33/4205 | 44/8465 | 5.27e-04 | 1.78e-03 | 9.13e-04 | 33 |
| hsa0413012 | Esophagus | ESCC | SNARE interactions in vesicular transport | 28/4205 | 33/8465 | 2.75e-05 | 1.32e-04 | 6.75e-05 | 28 |
| hsa0496233 | Esophagus | ESCC | Vasopressin-regulated water reabsorption | 33/4205 | 44/8465 | 5.27e-04 | 1.78e-03 | 9.13e-04 | 33 |
| hsa04130 | Liver | Cirrhotic | SNARE interactions in vesicular transport | 18/2530 | 33/8465 | 2.64e-03 | 1.10e-02 | 6.76e-03 | 18 |
| hsa041301 | Liver | Cirrhotic | SNARE interactions in vesicular transport | 18/2530 | 33/8465 | 2.64e-03 | 1.10e-02 | 6.76e-03 | 18 |
| hsa041302 | Liver | HCC | SNARE interactions in vesicular transport | 25/4020 | 33/8465 | 8.78e-04 | 3.38e-03 | 1.88e-03 | 25 |
| hsa041303 | Liver | HCC | SNARE interactions in vesicular transport | 25/4020 | 33/8465 | 8.78e-04 | 3.38e-03 | 1.88e-03 | 25 |
| hsa041304 | Oral cavity | OSCC | SNARE interactions in vesicular transport | 28/3704 | 33/8465 | 1.31e-06 | 7.18e-06 | 3.66e-06 | 28 |
| hsa049626 | Oral cavity | OSCC | Vasopressin-regulated water reabsorption | 29/3704 | 44/8465 | 2.47e-03 | 6.52e-03 | 3.32e-03 | 29 |
| hsa0413011 | Oral cavity | OSCC | SNARE interactions in vesicular transport | 28/3704 | 33/8465 | 1.31e-06 | 7.18e-06 | 3.66e-06 | 28 |
| hsa0496213 | Oral cavity | OSCC | Vasopressin-regulated water reabsorption | 29/3704 | 44/8465 | 2.47e-03 | 6.52e-03 | 3.32e-03 | 29 |
| Page: 1 2 |
Top |
Cell-cell communication analysis |
| Identification of potential cell-cell interactions between two cell types and their ligand-receptor pairs for different disease states |
| Ligand | Receptor | LRpair | Pathway | Tissue | Disease Stage |
| Page: 1 |
Top |
Single-cell gene regulatory network inference analysis |
| Find out the significant the regulons (TFs) and the target genes of each regulon across cell types for different disease states |
| TF | Cell Type | Tissue | Disease Stage | Target Gene | RSS | Regulon Activity |
| ∗The dot plots of a searched regulon are shown for all cell subpopulations in each disease state of each tissue based on the regulon specific score inferred using pySCENIC and by calculating the average expression. |
| Page: 1 |
Top |
Somatic mutation of malignant transformation related genes |
| Annotation of somatic variants for genes involved in malignant transformation |
| Hugo Symbol | Variant Class | Variant Classification | dbSNP RS | HGVSc | HGVSp | HGVSp Short | SWISSPROT | BIOTYPE | SIFT | PolyPhen | Tumor Sample Barcode | Tissue | Histology | Sex | Age | Stage | Therapy Types | Drugs | Outcome |
| VAMP2 | SNV | Missense_Mutation | c.175N>A | p.Asp59Asn | p.D59N | protein_coding | deleterious(0) | probably_damaging(0.984) | TCGA-AD-6895-01 | Colorectum | colon adenocarcinoma | Male | >=65 | III/IV | Unknown | Unknown | SD | ||
| VAMP2 | SNV | Missense_Mutation | novel | c.96G>T | p.Arg32Ser | p.R32S | protein_coding | deleterious(0) | benign(0.248) | TCGA-B5-A1MX-01 | Endometrium | uterine corpus endometrioid carcinoma | Female | <65 | I/II | Hormone Therapy | megace | SD | |
| VAMP2 | SNV | Missense_Mutation | novel | c.136N>A | p.Asp46Asn | p.D46N | protein_coding | deleterious(0.02) | benign(0.135) | TCGA-DF-A2KN-01 | Endometrium | uterine corpus endometrioid carcinoma | Female | Unknown | I/II | Unknown | Unknown | SD | |
| VAMP2 | SNV | Missense_Mutation | novel | c.95N>T | p.Arg32Met | p.R32M | protein_coding | deleterious(0) | possibly_damaging(0.746) | TCGA-EO-A22R-01 | Endometrium | uterine corpus endometrioid carcinoma | Female | <65 | I/II | Unknown | Unknown | SD | |
| VAMP2 | SNV | Missense_Mutation | novel | c.28N>C | p.Ala10Pro | p.A10P | protein_coding | tolerated_low_confidence(0.2) | benign(0) | TCGA-PG-A6IB-01 | Endometrium | uterine corpus endometrioid carcinoma | Female | >=65 | I/II | Unknown | Unknown | SD | |
| VAMP2 | insertion | Nonsense_Mutation | novel | c.3_4insAAACTCTGTCTCTACTAAAAAAATACAAAATTAGCCGGGT | p.Asp2LysfsTer6 | p.D2Kfs*6 | protein_coding | TCGA-AX-A3FS-01 | Endometrium | uterine corpus endometrioid carcinoma | Female | >=65 | I/II | Unknown | Unknown | SD | |||
| VAMP2 | insertion | Frame_Shift_Ins | rs774244975 | c.35_36insC | p.Ala13CysfsTer19 | p.A13Cfs*19 | protein_coding | TCGA-DF-A2KN-01 | Endometrium | uterine corpus endometrioid carcinoma | Female | Unknown | I/II | Unknown | Unknown | SD | |||
| VAMP2 | insertion | Frame_Shift_Ins | rs774244975 | c.35_36insC | p.Ala13CysfsTer19 | p.A13Cfs*19 | protein_coding | TCGA-VQ-A91K-01 | Stomach | stomach adenocarcinoma | Male | >=65 | III/IV | Chemotherapy | fluorouracil | CR |
| Page: 1 |
Top |
Related drugs of malignant transformation related genes |
| Identification of chemicals and drugs interact with genes involved in malignant transfromation |
| (DGIdb 4.0) |
| Entrez ID | Symbol | Category | Interaction Types | Drug Claim Name | Drug Name | PMIDs |
| 6844 | VAMP2 | DRUGGABLE GENOME | BOTULINUM TOXIN TYPE B | |||
| 6844 | VAMP2 | DRUGGABLE GENOME | PMA | 17196367 | ||
| 6844 | VAMP2 | DRUGGABLE GENOME | INSULIN | INSULIN | 7796801,9267469,9430681,8973549 | |
| 6844 | VAMP2 | DRUGGABLE GENOME | inhibitor | CHEMBL1201569 | BOTULINUM TOXIN TYPE B | |
| 6844 | VAMP2 | DRUGGABLE GENOME | BOTULINUM TOXIN TYPE B |
| Page: 1 |

Copyright 2023-Present -The University of Texas Health Science Center at Houston |