| Tissue | Expression Dynamics | Abbreviation |
| Colorectum (GSE201348) |  | FAP: Familial adenomatous polyposis |
| CRC: Colorectal cancer |
| Colorectum (HTA11) | 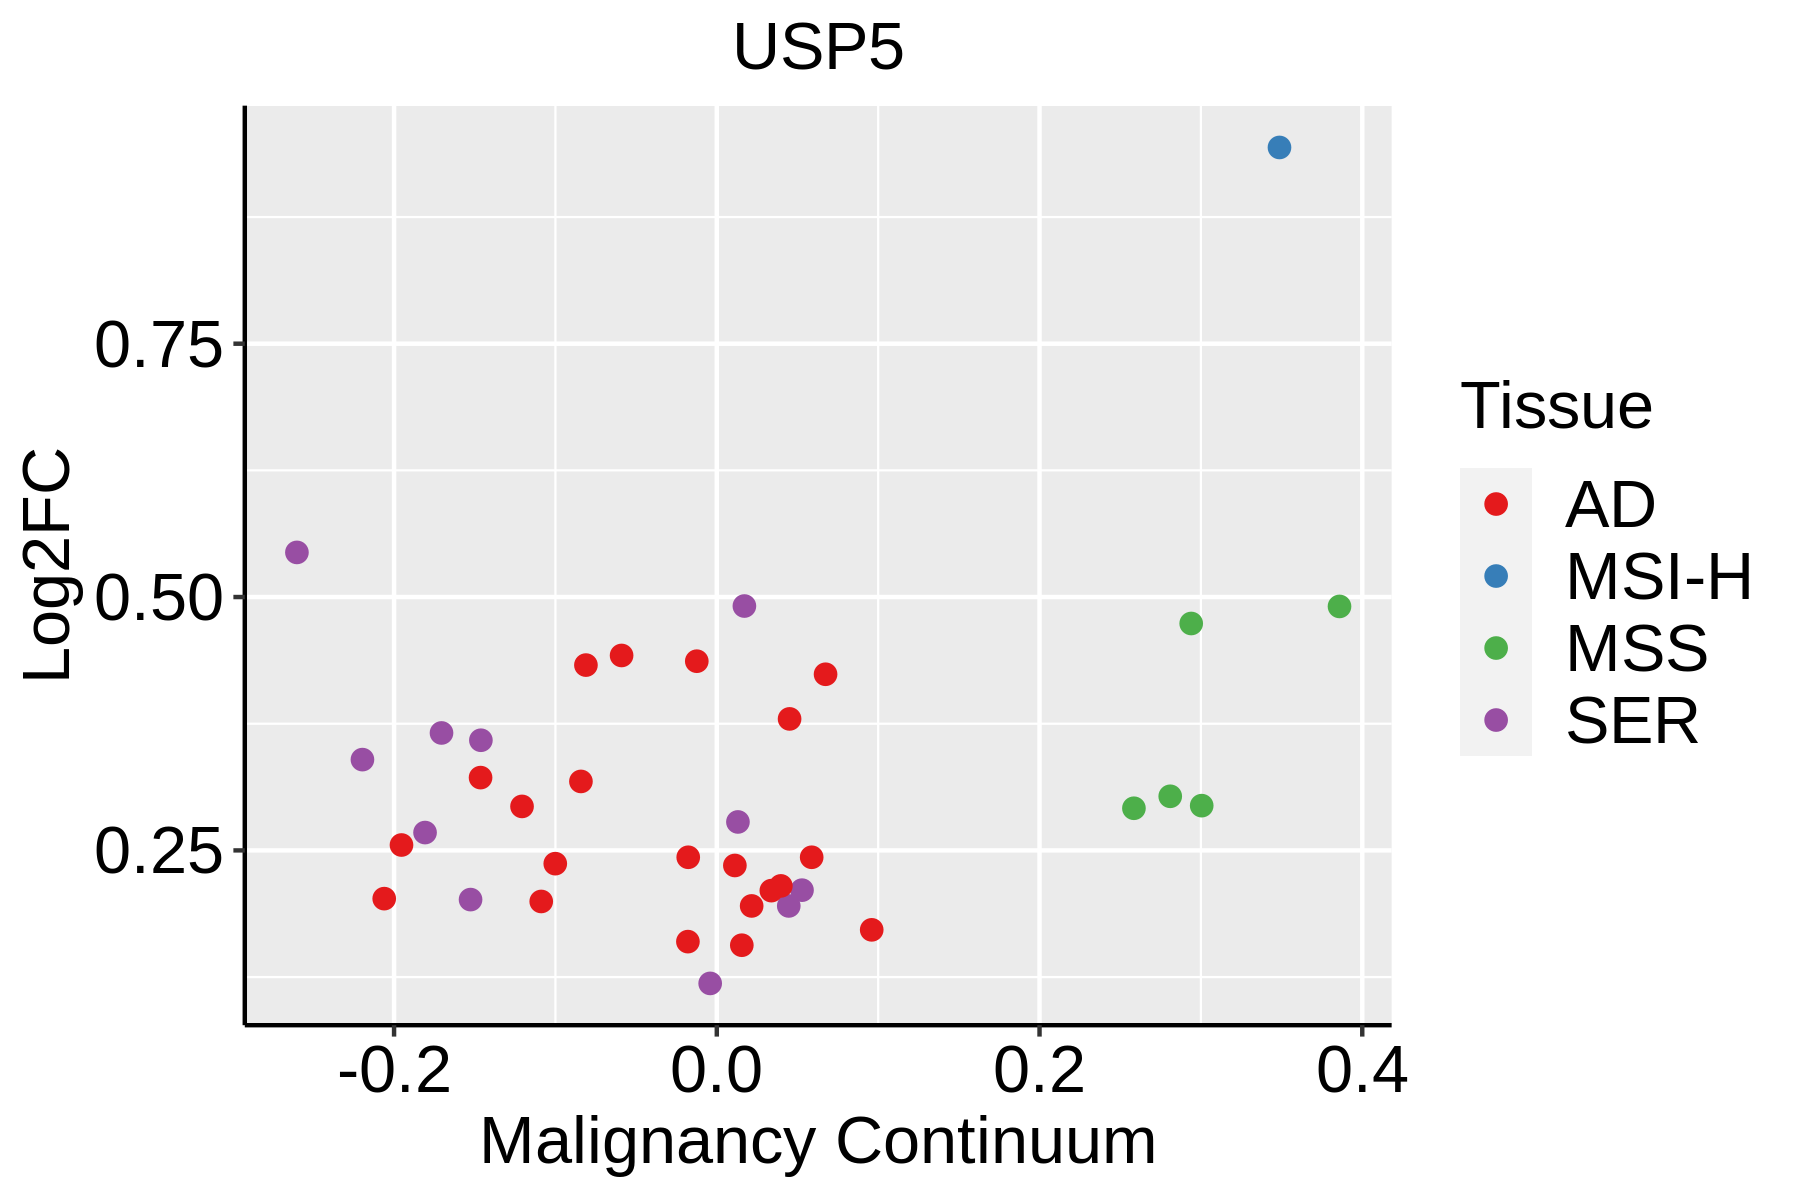 | AD: Adenomas |
| SER: Sessile serrated lesions |
| MSI-H: Microsatellite-high colorectal cancer |
| MSS: Microsatellite stable colorectal cancer |
| Esophagus | 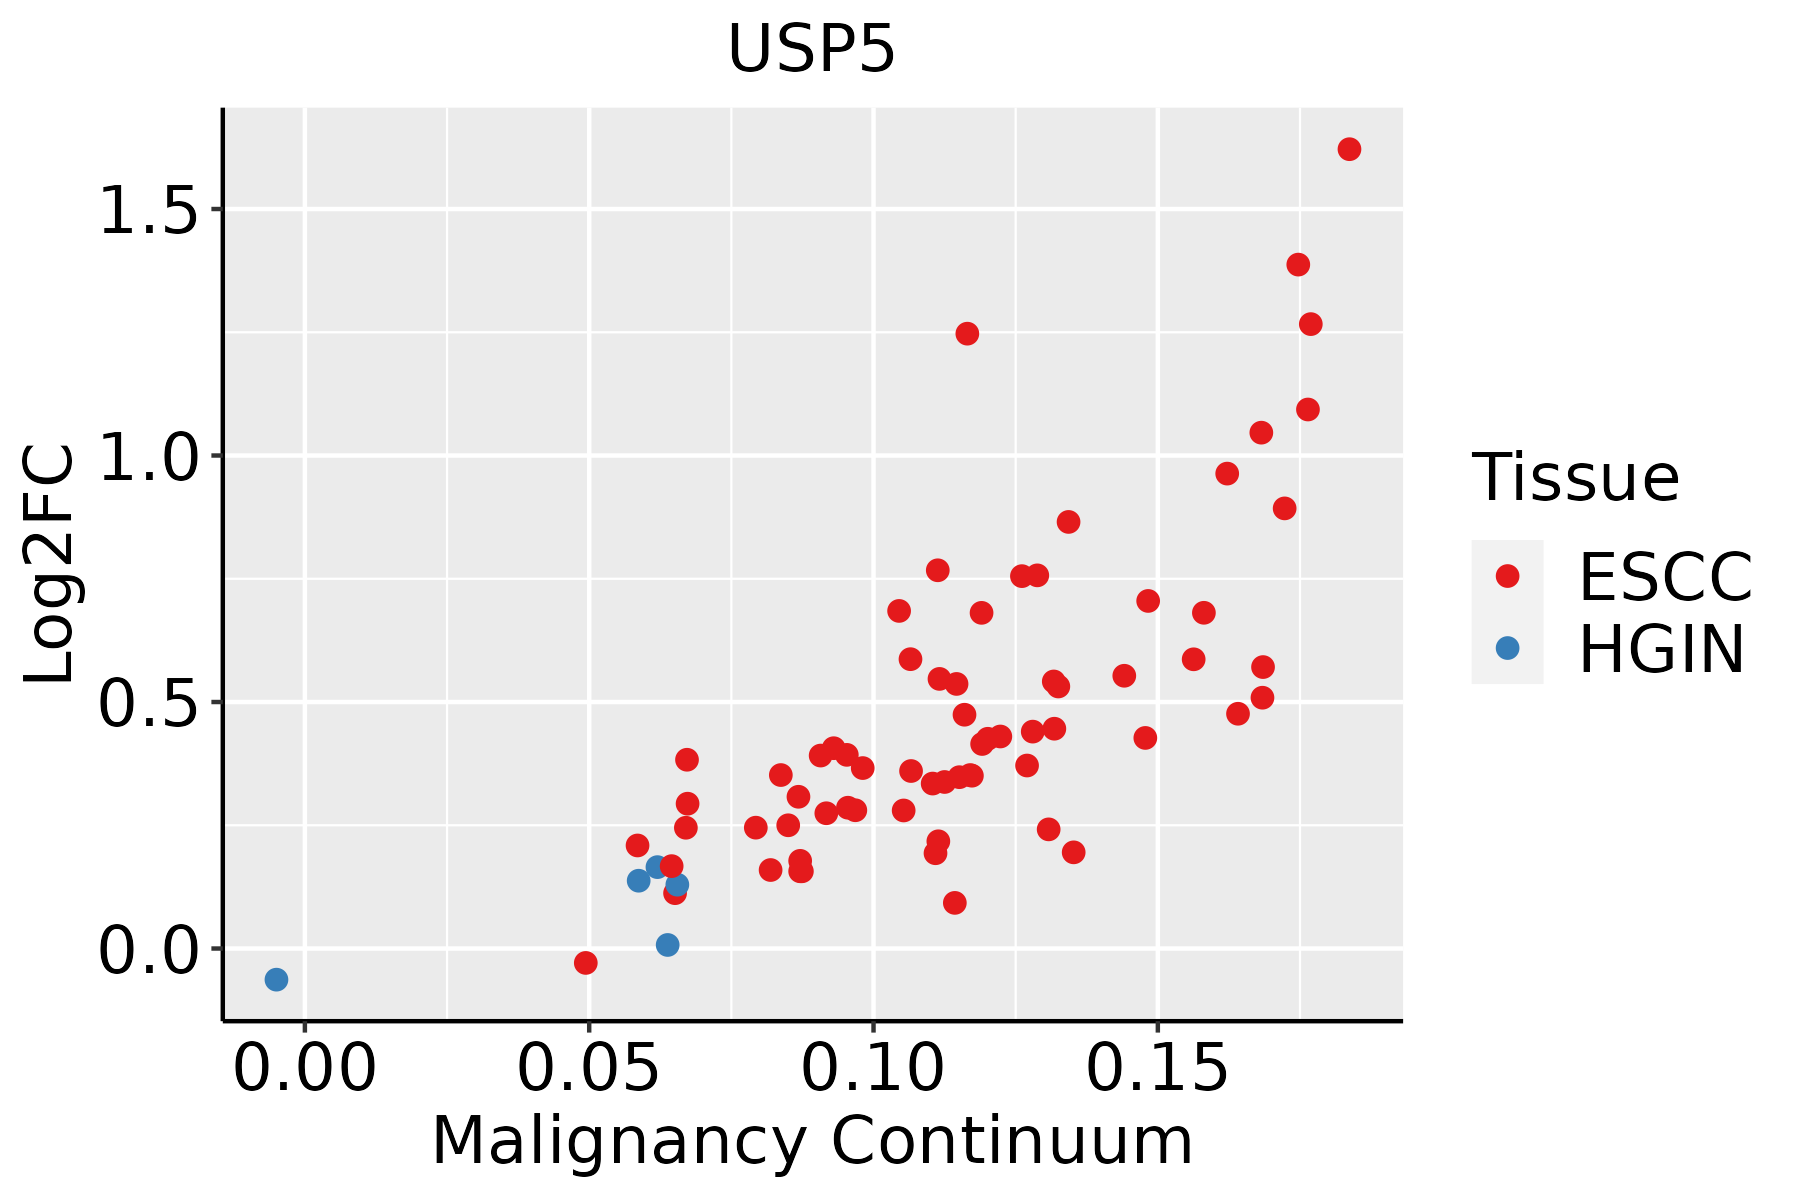 | ESCC: Esophageal squamous cell carcinoma |
| HGIN: High-grade intraepithelial neoplasias |
| LGIN: Low-grade intraepithelial neoplasias |
| Liver | 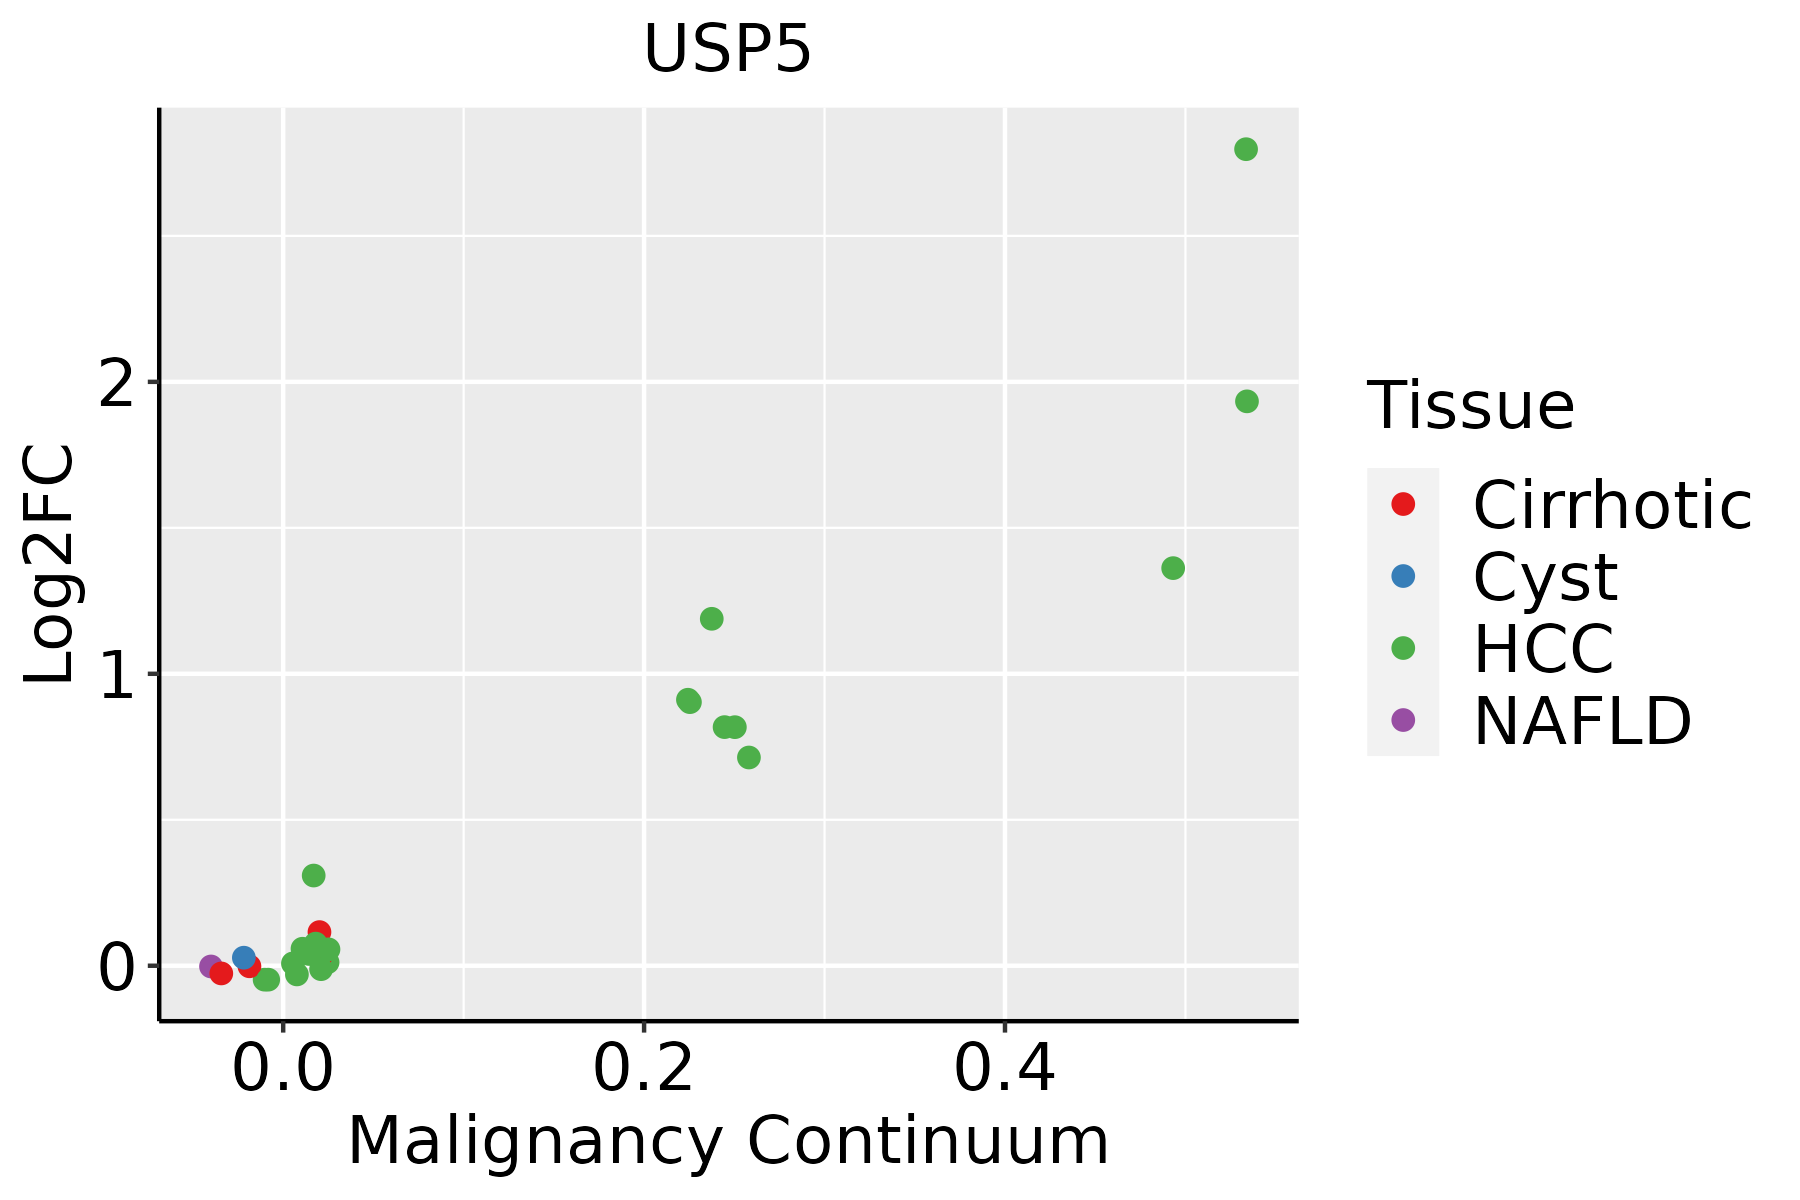 | HCC: Hepatocellular carcinoma |
| NAFLD: Non-alcoholic fatty liver disease |
| Oral Cavity | 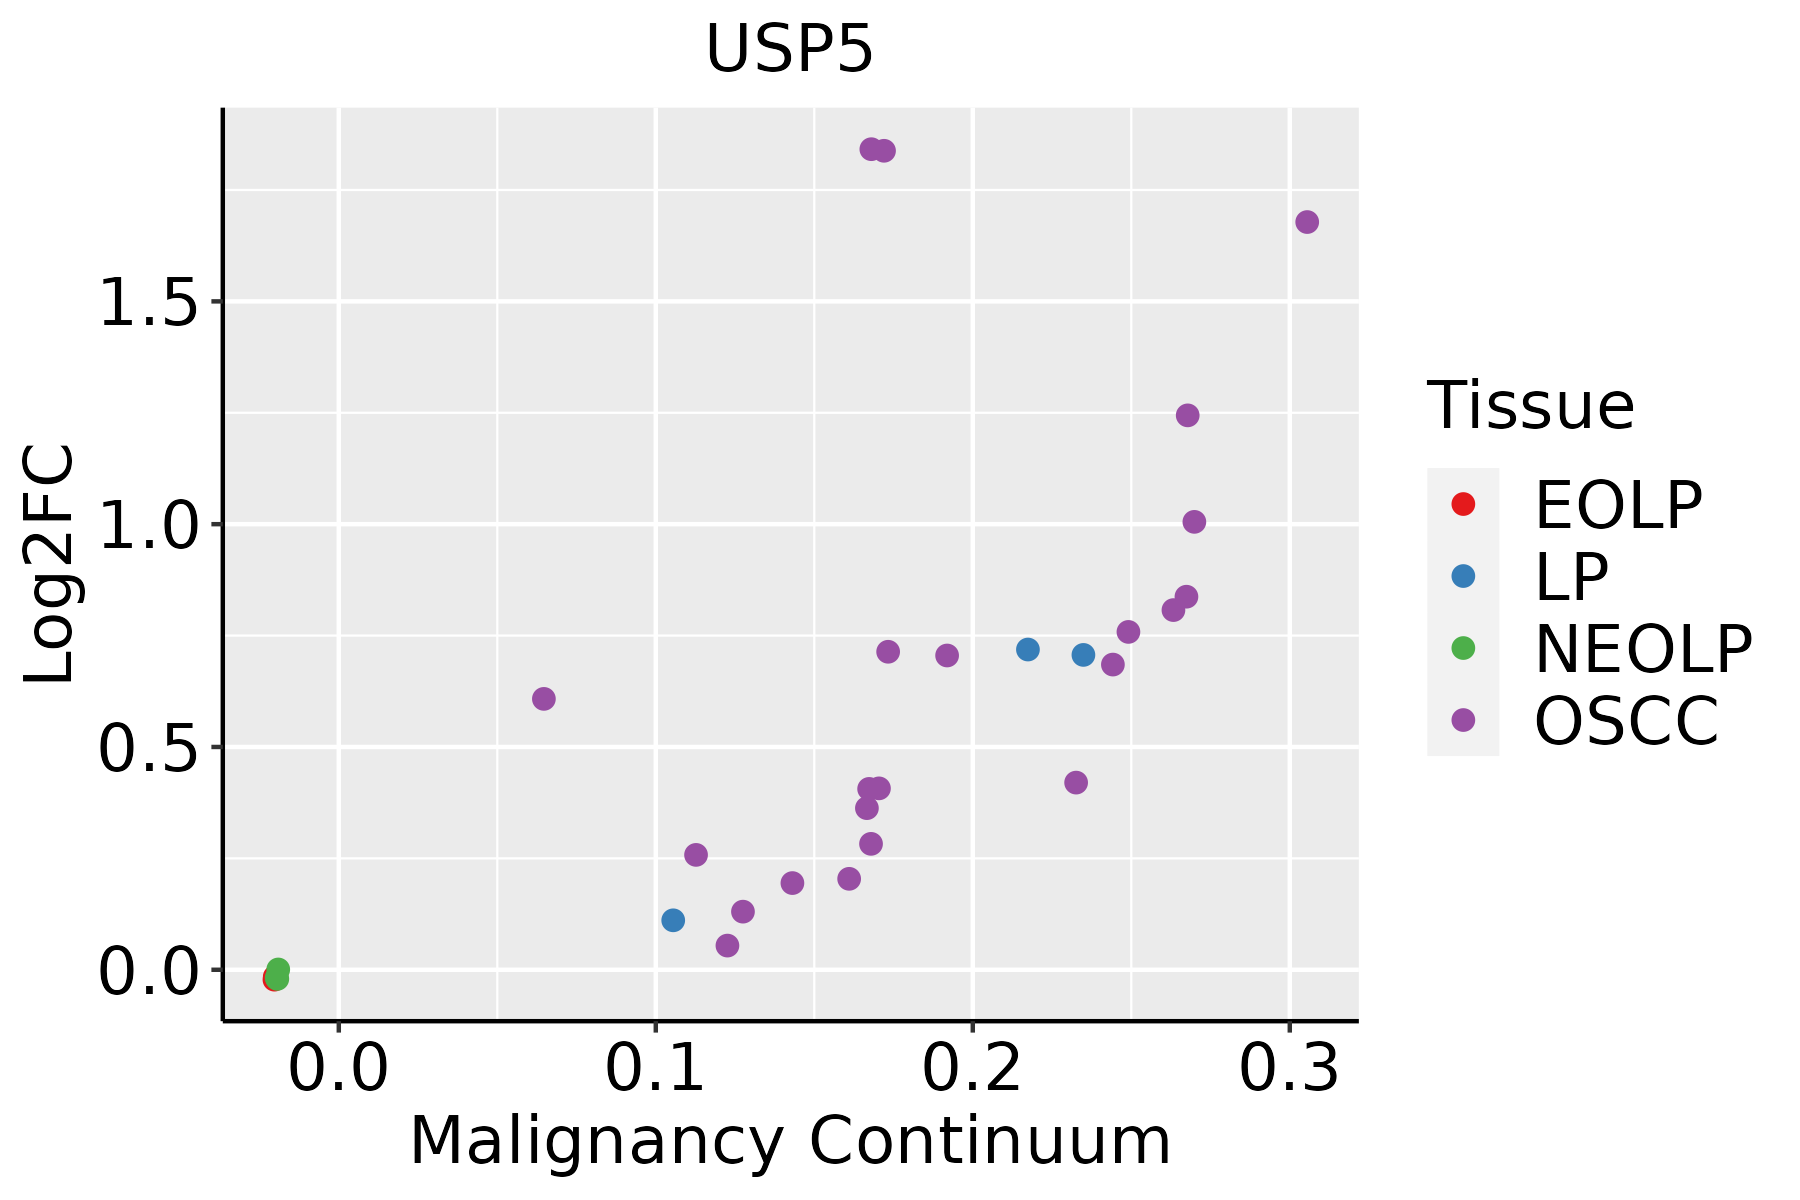 | EOLP: Erosive Oral lichen planus |
| LP: leukoplakia |
| NEOLP: Non-erosive oral lichen planus |
| OSCC: Oral squamous cell carcinoma |
| Skin | 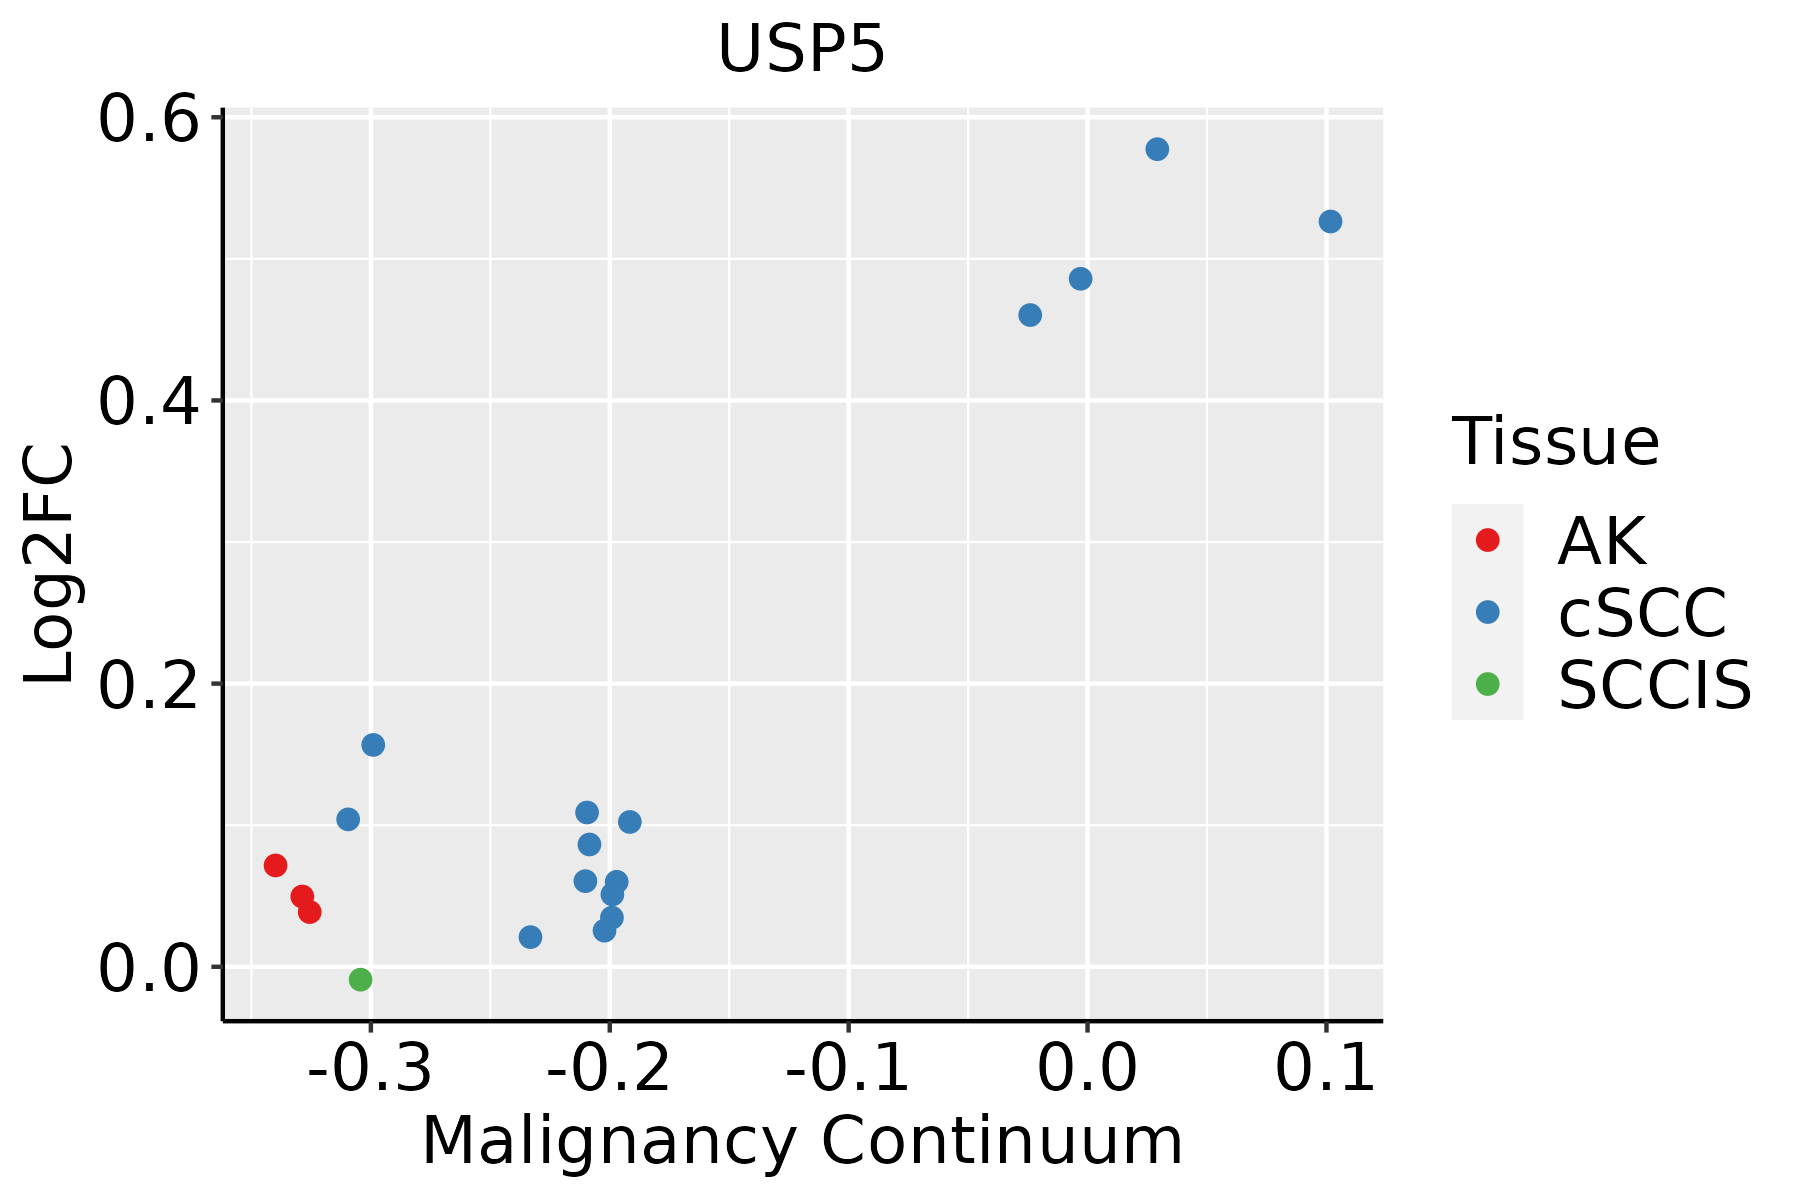 | AK: Actinic keratosis |
| cSCC: Cutaneous squamous cell carcinoma |
| SCCIS:squamous cell carcinoma in situ |
| Thyroid |  | ATC: Anaplastic thyroid cancer |
| HT: Hashimoto's thyroiditis |
| PTC: Papillary thyroid cancer |
| GO ID | Tissue | Disease Stage | Description | Gene Ratio | Bg Ratio | pvalue | p.adjust | Count |
| GO:19030522 | Colorectum | MSS | positive regulation of proteolysis involved in cellular protein catabolic process | 48/3467 | 133/18723 | 1.21e-06 | 4.06e-05 | 48 |
| GO:20000602 | Colorectum | MSS | positive regulation of ubiquitin-dependent protein catabolic process | 39/3467 | 107/18723 | 8.92e-06 | 2.19e-04 | 39 |
| GO:19018002 | Colorectum | MSS | positive regulation of proteasomal protein catabolic process | 40/3467 | 114/18723 | 1.96e-05 | 4.19e-04 | 40 |
| GO:00709972 | Colorectum | MSS | neuron death | 97/3467 | 361/18723 | 5.21e-05 | 9.31e-04 | 97 |
| GO:00324362 | Colorectum | MSS | positive regulation of proteasomal ubiquitin-dependent protein catabolic process | 32/3467 | 90/18723 | 9.56e-05 | 1.50e-03 | 32 |
| GO:00514022 | Colorectum | MSS | neuron apoptotic process | 66/3467 | 246/18723 | 7.94e-04 | 8.36e-03 | 66 |
| GO:0071108 | Colorectum | MSS | protein K48-linked deubiquitination | 13/3467 | 35/18723 | 7.38e-03 | 4.68e-02 | 13 |
| GO:00421763 | Colorectum | MSI-H | regulation of protein catabolic process | 65/1319 | 391/18723 | 6.96e-11 | 1.29e-08 | 65 |
| GO:19033623 | Colorectum | MSI-H | regulation of cellular protein catabolic process | 49/1319 | 255/18723 | 9.82e-11 | 1.66e-08 | 49 |
| GO:19030503 | Colorectum | MSI-H | regulation of proteolysis involved in cellular protein catabolic process | 43/1319 | 221/18723 | 9.16e-10 | 1.27e-07 | 43 |
| GO:00104983 | Colorectum | MSI-H | proteasomal protein catabolic process | 71/1319 | 490/18723 | 4.67e-09 | 6.03e-07 | 71 |
| GO:20000583 | Colorectum | MSI-H | regulation of ubiquitin-dependent protein catabolic process | 34/1319 | 164/18723 | 9.82e-09 | 1.21e-06 | 34 |
| GO:00611363 | Colorectum | MSI-H | regulation of proteasomal protein catabolic process | 34/1319 | 187/18723 | 2.84e-07 | 2.25e-05 | 34 |
| GO:00098963 | Colorectum | MSI-H | positive regulation of catabolic process | 64/1319 | 492/18723 | 1.39e-06 | 9.16e-05 | 64 |
| GO:00324343 | Colorectum | MSI-H | regulation of proteasomal ubiquitin-dependent protein catabolic process | 26/1319 | 134/18723 | 1.98e-06 | 1.25e-04 | 26 |
| GO:00313313 | Colorectum | MSI-H | positive regulation of cellular catabolic process | 56/1319 | 427/18723 | 4.89e-06 | 2.54e-04 | 56 |
| GO:00431613 | Colorectum | MSI-H | proteasome-mediated ubiquitin-dependent protein catabolic process | 53/1319 | 412/18723 | 1.51e-05 | 6.62e-04 | 53 |
| GO:00458623 | Colorectum | MSI-H | positive regulation of proteolysis | 49/1319 | 372/18723 | 1.67e-05 | 7.15e-04 | 49 |
| GO:00457323 | Colorectum | MSI-H | positive regulation of protein catabolic process | 34/1319 | 231/18723 | 3.46e-05 | 1.33e-03 | 34 |
| GO:19033643 | Colorectum | MSI-H | positive regulation of cellular protein catabolic process | 25/1319 | 155/18723 | 8.26e-05 | 2.72e-03 | 25 |
| Hugo Symbol | Variant Class | Variant Classification | dbSNP RS | HGVSc | HGVSp | HGVSp Short | SWISSPROT | BIOTYPE | SIFT | PolyPhen | Tumor Sample Barcode | Tissue | Histology | Sex | Age | Stage | Therapy Types | Drugs | Outcome |
| USP5 | SNV | Missense_Mutation | | c.103N>A | p.Asp35Asn | p.D35N | P45974 | protein_coding | deleterious(0.01) | benign(0.124) | TCGA-A8-A094-01 | Breast | breast invasive carcinoma | Female | >=65 | I/II | Unknown | Unknown | SD |
| USP5 | SNV | Missense_Mutation | | c.891N>C | p.Glu297Asp | p.E297D | P45974 | protein_coding | tolerated(0.09) | benign(0.031) | TCGA-A8-A094-01 | Breast | breast invasive carcinoma | Female | >=65 | I/II | Unknown | Unknown | SD |
| USP5 | SNV | Missense_Mutation | rs782807103 | c.221G>A | p.Arg74Gln | p.R74Q | P45974 | protein_coding | tolerated(0.08) | benign(0.001) | TCGA-AN-A0G0-01 | Breast | breast invasive carcinoma | Female | <65 | I/II | Unknown | Unknown | SD |
| USP5 | SNV | Missense_Mutation | | c.1725N>T | p.Lys575Asn | p.K575N | P45974 | protein_coding | deleterious(0) | probably_damaging(0.988) | TCGA-BH-A0B4-01 | Breast | breast invasive carcinoma | Male | >=65 | III/IV | Hormone Therapy | tamoxiphen | SD |
| USP5 | SNV | Missense_Mutation | novel | c.334N>C | p.Glu112Gln | p.E112Q | P45974 | protein_coding | tolerated(0.37) | possibly_damaging(0.672) | TCGA-BH-A8FZ-01 | Breast | breast invasive carcinoma | Female | <65 | I/II | Unknown | Unknown | SD |
| USP5 | insertion | Frame_Shift_Ins | novel | c.339_340insGAAACCAGCCTGGGCAATATGGCAAGACCTCATC | p.Phe114GlufsTer13 | p.F114Efs*13 | P45974 | protein_coding | | | TCGA-A8-A06X-01 | Breast | breast invasive carcinoma | Female | >=65 | I/II | Unknown | Unknown | SD |
| USP5 | insertion | Nonsense_Mutation | novel | c.480_481insCCATTCTGACCTCCTATTGGACTCAGTTTCTTTTTTTCACCTACT | p.Ala160_Ser161insProPheTerProProIleGlyLeuSerPhePhePheSerProThr | p.A160_S161insPF*PPIGLSFFFSPT | P45974 | protein_coding | | | TCGA-A8-A08Z-01 | Breast | breast invasive carcinoma | Female | >=65 | III/IV | Unknown | Unknown | SD |
| USP5 | deletion | Frame_Shift_Del | novel | c.851_852delNN | p.Leu284GlnfsTer11 | p.L284Qfs*11 | P45974 | protein_coding | | | TCGA-E9-A1RH-01 | Breast | breast invasive carcinoma | Female | <65 | I/II | Chemotherapy | 5-fluorouracil | SD |
| USP5 | deletion | Frame_Shift_Del | | c.1931delN | p.Pro645LeufsTer45 | p.P645Lfs*45 | P45974 | protein_coding | | | TCGA-E9-A226-01 | Breast | breast invasive carcinoma | Female | <65 | III/IV | Hormone Therapy | tamoxiphen | PD |
| USP5 | SNV | Missense_Mutation | novel | c.907N>T | p.Arg303Trp | p.R303W | P45974 | protein_coding | deleterious(0) | probably_damaging(0.999) | TCGA-2W-A8YY-01 | Cervix | cervical & endocervical cancer | Female | <65 | I/II | Chemotherapy | cisplatin | CR |


