
|
|||||
|
 | |
| |
| |
| |
| |
| |
|
Gene: UBC |
Gene summary for UBC |
| Gene information | Species | Human | Gene symbol | UBC | Gene ID | 7316 |
| Gene name | ubiquitin C | |
| Gene Alias | HMG20 | |
| Cytomap | 12q24.31 | |
| Gene Type | protein-coding | GO ID | GO:0006464 | UniProtAcc | P0CG48 |
Top |
Malignant transformation analysis |
| Identification of the aberrant gene expression in precancerous and cancerous lesions by comparing the gene expression of stem-like cells in diseased tissues with normal stem cells |
| Entrez ID | Symbol | Replicates | Species | Organ | Tissue | Adj P-value | Log2FC | Malignancy |
| 7316 | UBC | GSM4909277 | Human | Breast | Precancer | 2.76e-09 | 6.44e-01 | 0.0177 |
| 7316 | UBC | GSM4909285 | Human | Breast | IDC | 1.08e-15 | -3.83e-01 | 0.21 |
| 7316 | UBC | GSM4909286 | Human | Breast | IDC | 5.94e-32 | -5.28e-01 | 0.1081 |
| 7316 | UBC | GSM4909287 | Human | Breast | IDC | 6.69e-03 | 1.34e-01 | 0.2057 |
| 7316 | UBC | GSM4909290 | Human | Breast | IDC | 3.26e-09 | -4.17e-01 | 0.2096 |
| 7316 | UBC | GSM4909296 | Human | Breast | IDC | 3.20e-17 | -5.76e-01 | 0.1524 |
| 7316 | UBC | GSM4909297 | Human | Breast | IDC | 1.84e-06 | 1.25e-02 | 0.1517 |
| 7316 | UBC | GSM4909298 | Human | Breast | IDC | 4.52e-20 | -4.35e-01 | 0.1551 |
| 7316 | UBC | GSM4909301 | Human | Breast | IDC | 1.24e-05 | -3.48e-01 | 0.1577 |
| 7316 | UBC | GSM4909307 | Human | Breast | IDC | 3.88e-14 | -5.28e-01 | 0.1569 |
| 7316 | UBC | GSM4909309 | Human | Breast | IDC | 3.25e-07 | -4.20e-01 | 0.0483 |
| 7316 | UBC | GSM4909311 | Human | Breast | IDC | 2.76e-21 | -3.87e-01 | 0.1534 |
| 7316 | UBC | GSM4909317 | Human | Breast | IDC | 2.50e-04 | 2.35e-01 | 0.1355 |
| 7316 | UBC | GSM4909319 | Human | Breast | IDC | 8.14e-29 | 6.71e-02 | 0.1563 |
| 7316 | UBC | GSM4909320 | Human | Breast | IDC | 5.85e-06 | -5.03e-01 | 0.1575 |
| 7316 | UBC | GSM4909321 | Human | Breast | IDC | 1.97e-28 | 4.17e-01 | 0.1559 |
| 7316 | UBC | ctrl6 | Human | Breast | Precancer | 2.59e-21 | 5.27e-01 | -0.0061 |
| 7316 | UBC | brca1 | Human | Breast | Precancer | 7.36e-03 | 1.19e-01 | -0.0338 |
| 7316 | UBC | brca2 | Human | Breast | Precancer | 2.37e-05 | 7.28e-02 | -0.024 |
| 7316 | UBC | brca3 | Human | Breast | Precancer | 1.03e-15 | 2.62e-01 | -0.0263 |
| Page: 1 2 3 4 5 6 7 8 9 10 11 12 13 14 15 16 17 |
| Tissue | Expression Dynamics | Abbreviation |
| Breast |  | IDC: Invasive ductal carcinoma |
| DCIS: Ductal carcinoma in situ | ||
| Precancer(BRCA1-mut): Precancerous lesion from BRCA1 mutation carriers | ||
| Cervix | 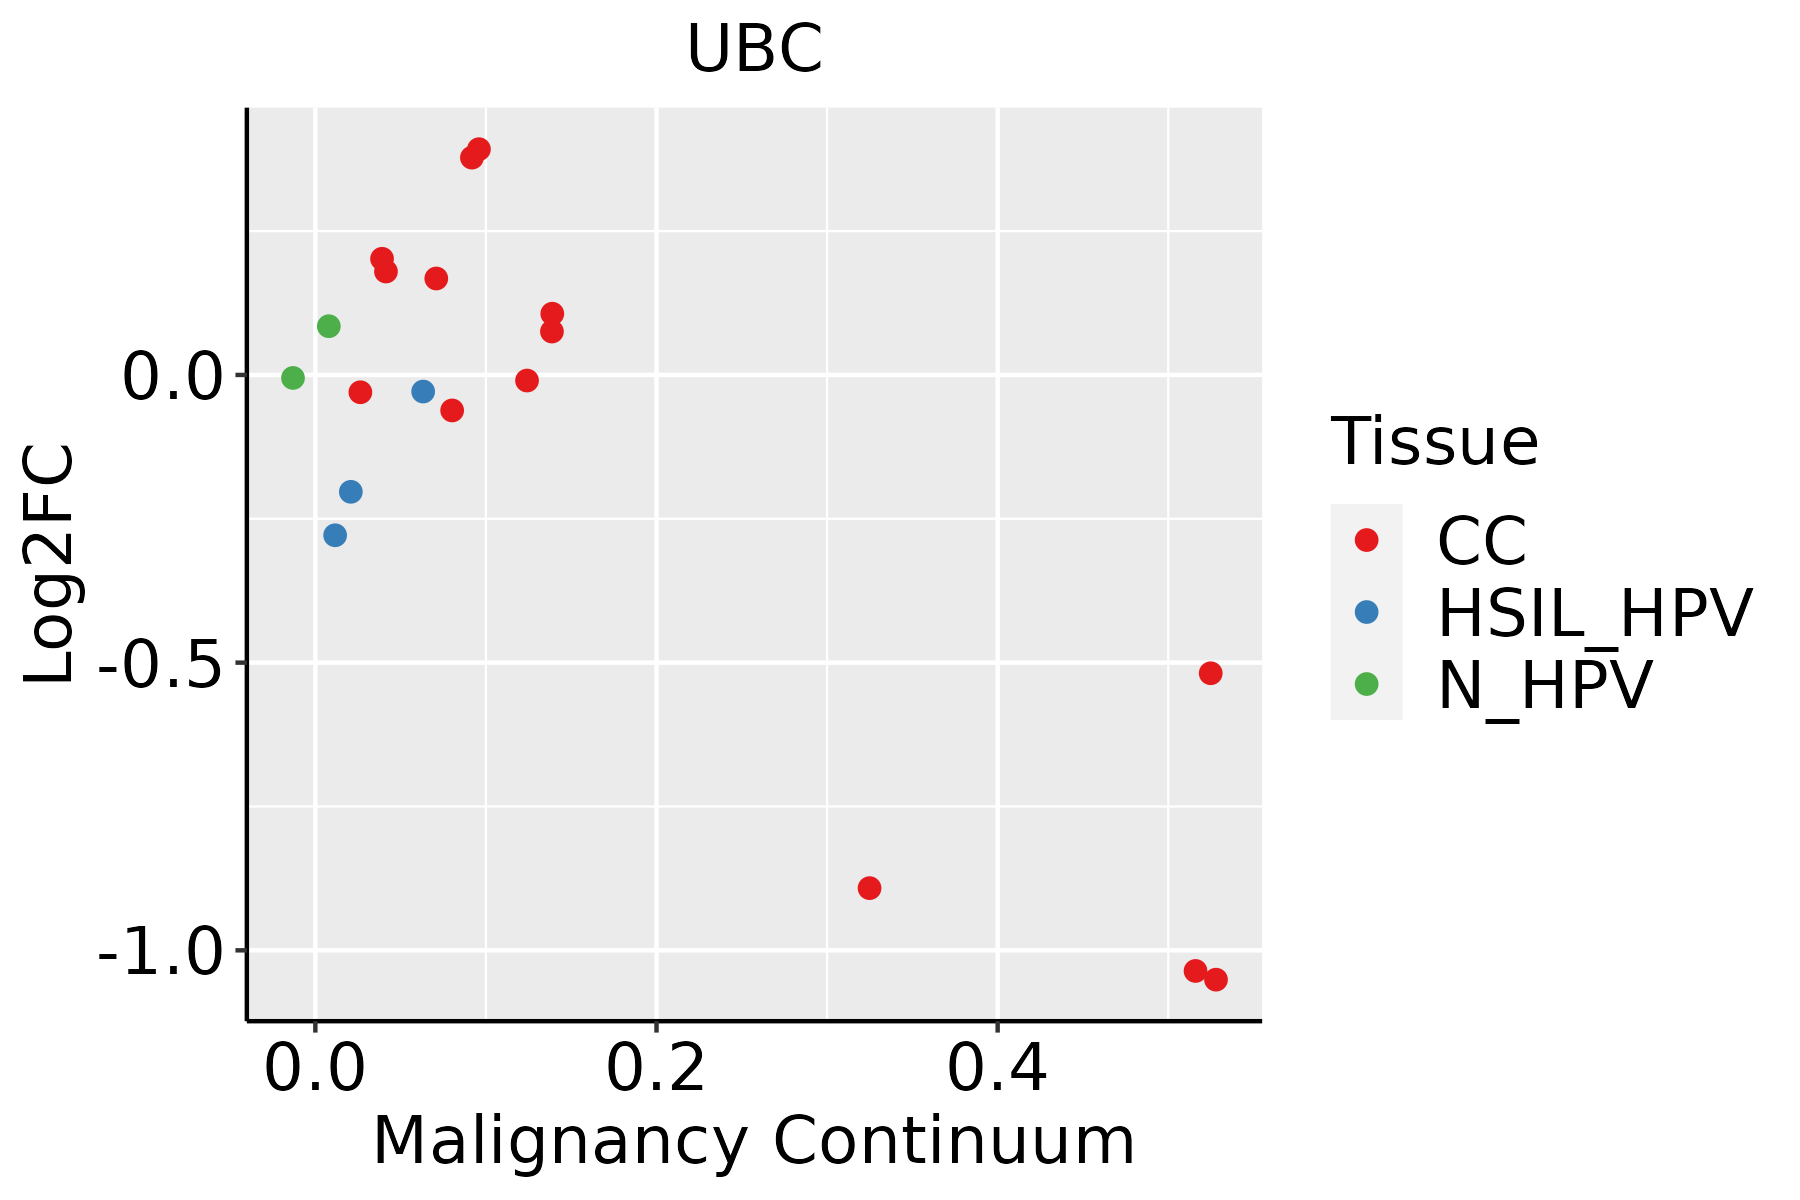 | CC: Cervix cancer |
| HSIL_HPV: HPV-infected high-grade squamous intraepithelial lesions | ||
| N_HPV: HPV-infected normal cervix | ||
| Colorectum (GSE201348) |  | FAP: Familial adenomatous polyposis |
| CRC: Colorectal cancer | ||
| Colorectum (HTA11) |  | AD: Adenomas |
| SER: Sessile serrated lesions | ||
| MSI-H: Microsatellite-high colorectal cancer | ||
| MSS: Microsatellite stable colorectal cancer | ||
| Endometrium |  | AEH: Atypical endometrial hyperplasia |
| EEC: Endometrioid Cancer | ||
| Esophagus | 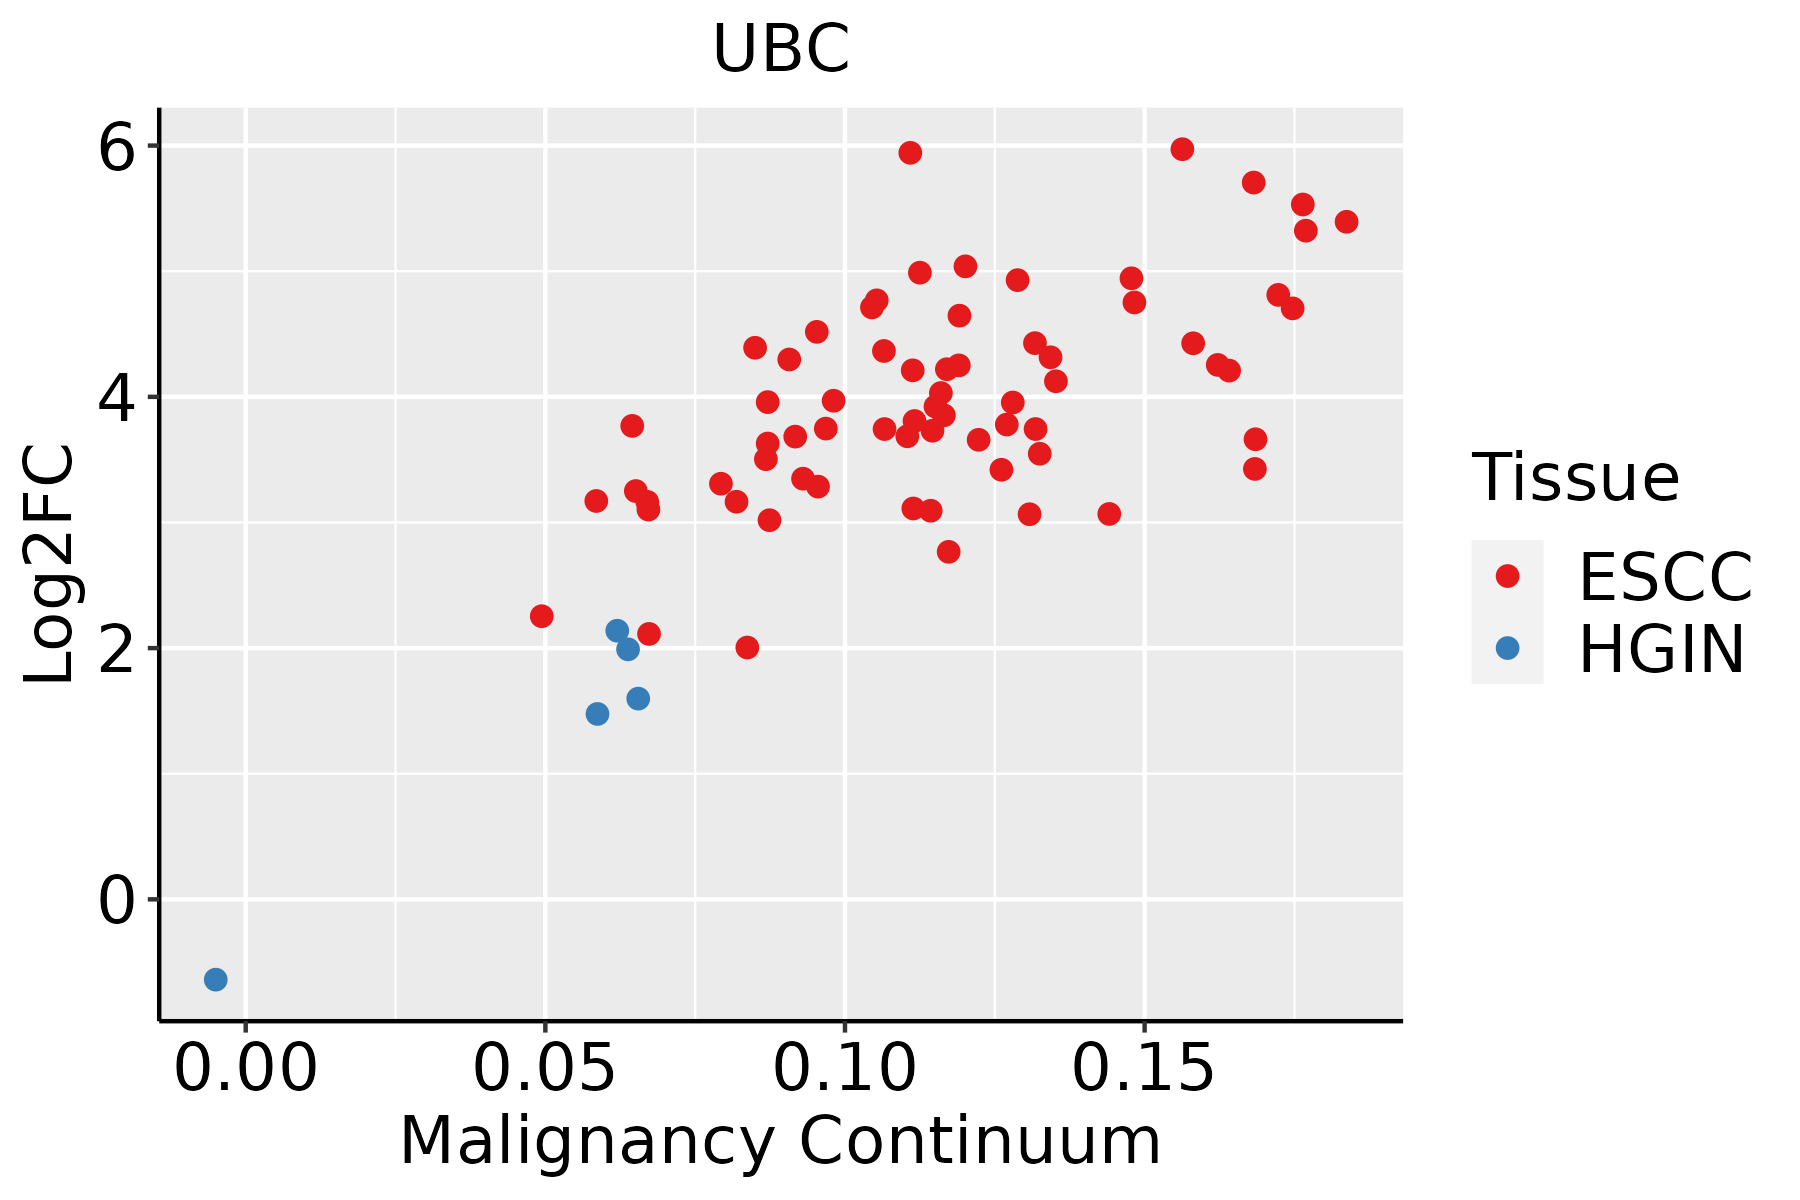 | ESCC: Esophageal squamous cell carcinoma |
| HGIN: High-grade intraepithelial neoplasias | ||
| LGIN: Low-grade intraepithelial neoplasias | ||
| GC | 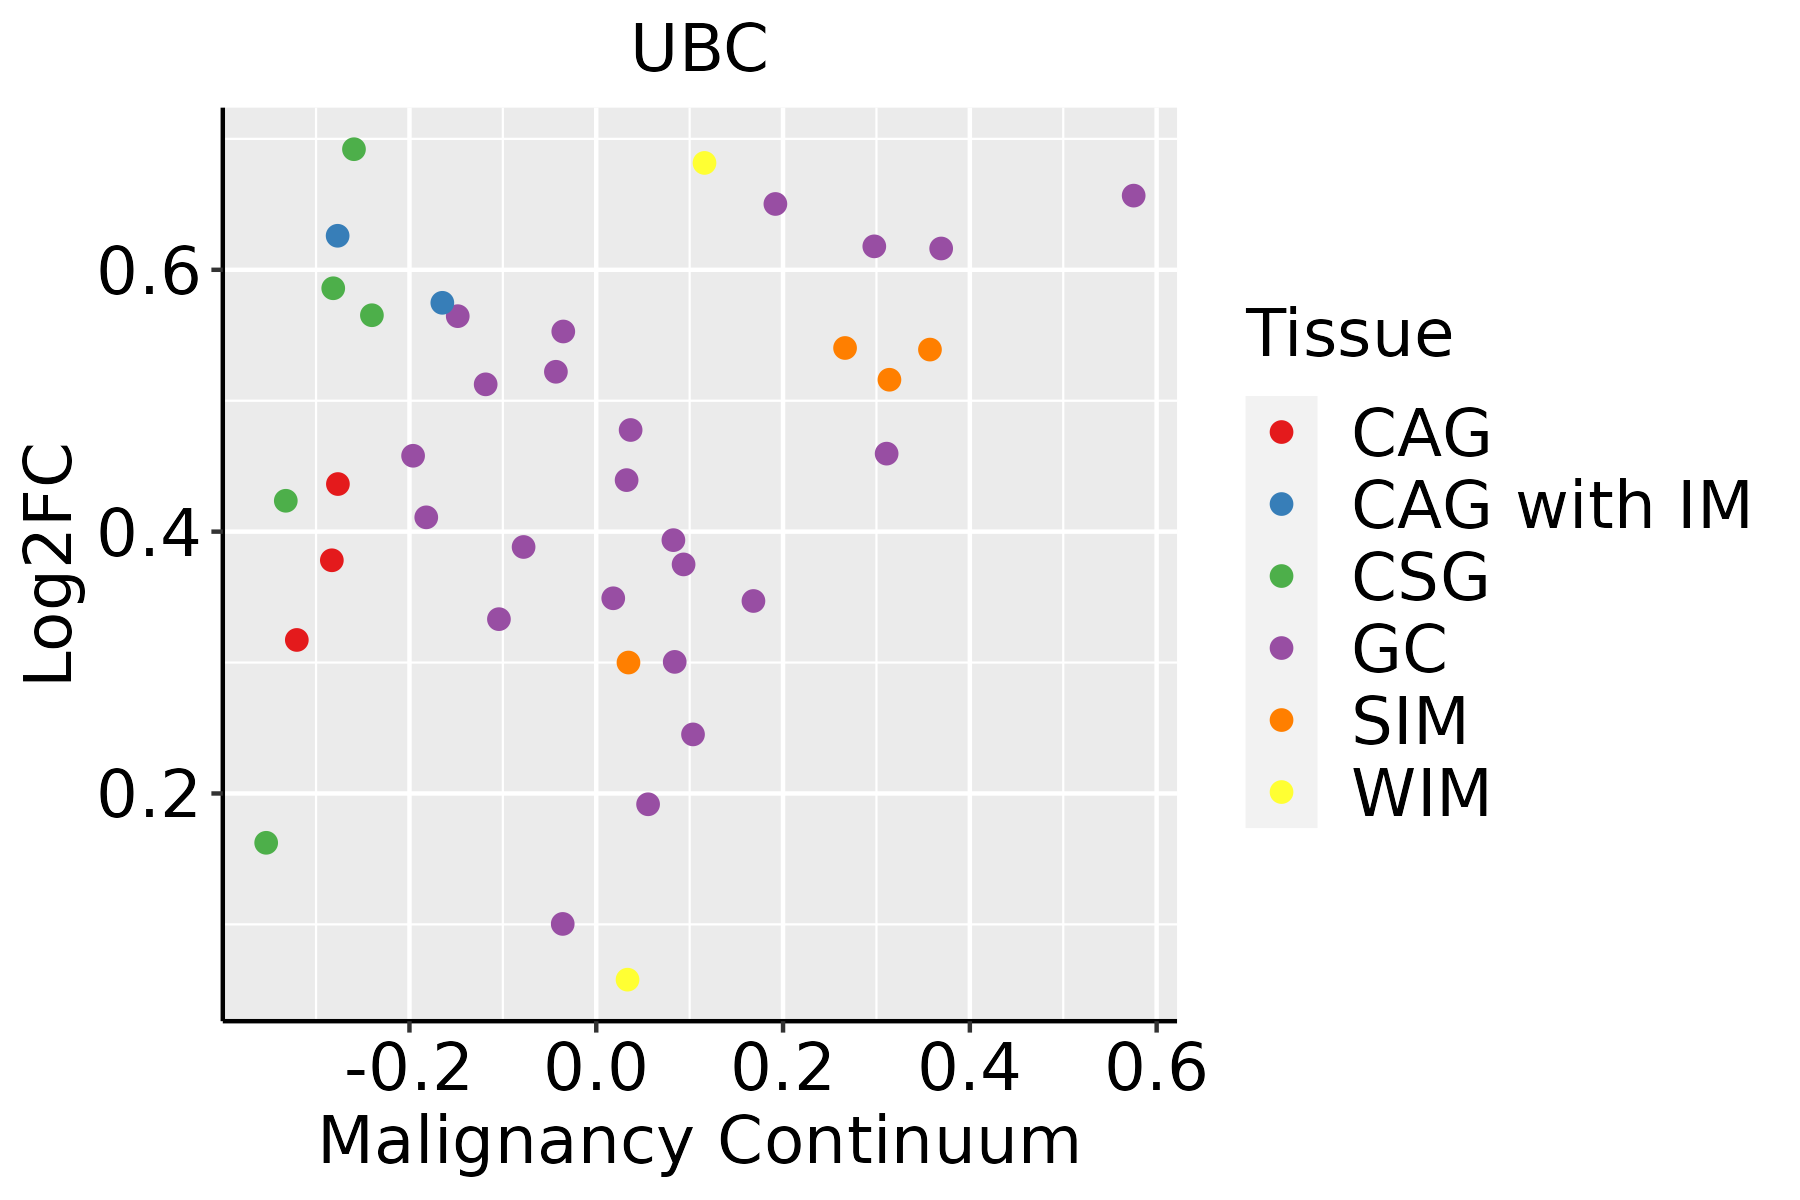 | CAG: Chronic atrophic gastritis |
| CAG with IM: Chronic atrophic gastritis with intestinal metaplasia | ||
| CSG: Chronic superficial gastritis | ||
| GC: Gastric cancer | ||
| SIM: Severe intestinal metaplasia | ||
| WIM: Wild intestinal metaplasia | ||
| Liver |  | HCC: Hepatocellular carcinoma |
| NAFLD: Non-alcoholic fatty liver disease | ||
| Oral Cavity | 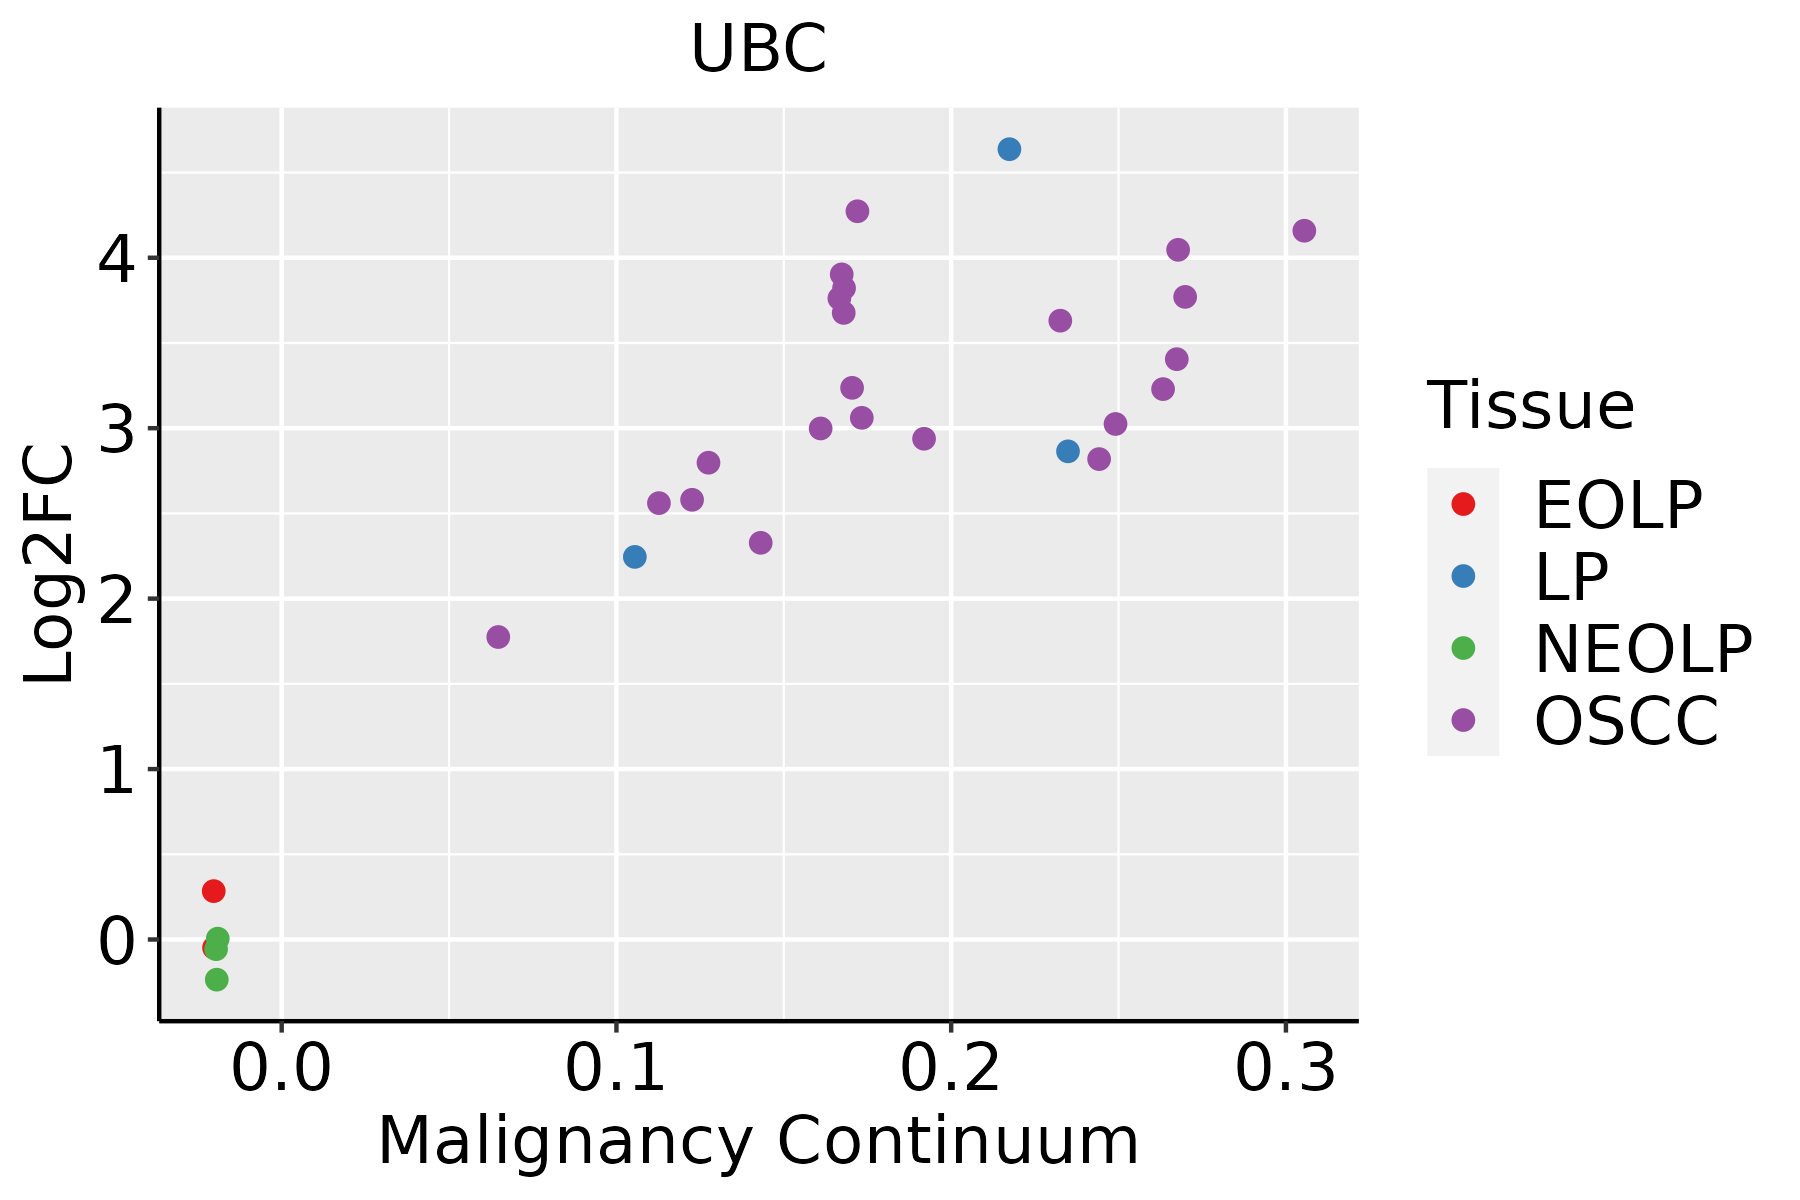 | EOLP: Erosive Oral lichen planus |
| LP: leukoplakia | ||
| NEOLP: Non-erosive oral lichen planus | ||
| OSCC: Oral squamous cell carcinoma | ||
| Prostate | 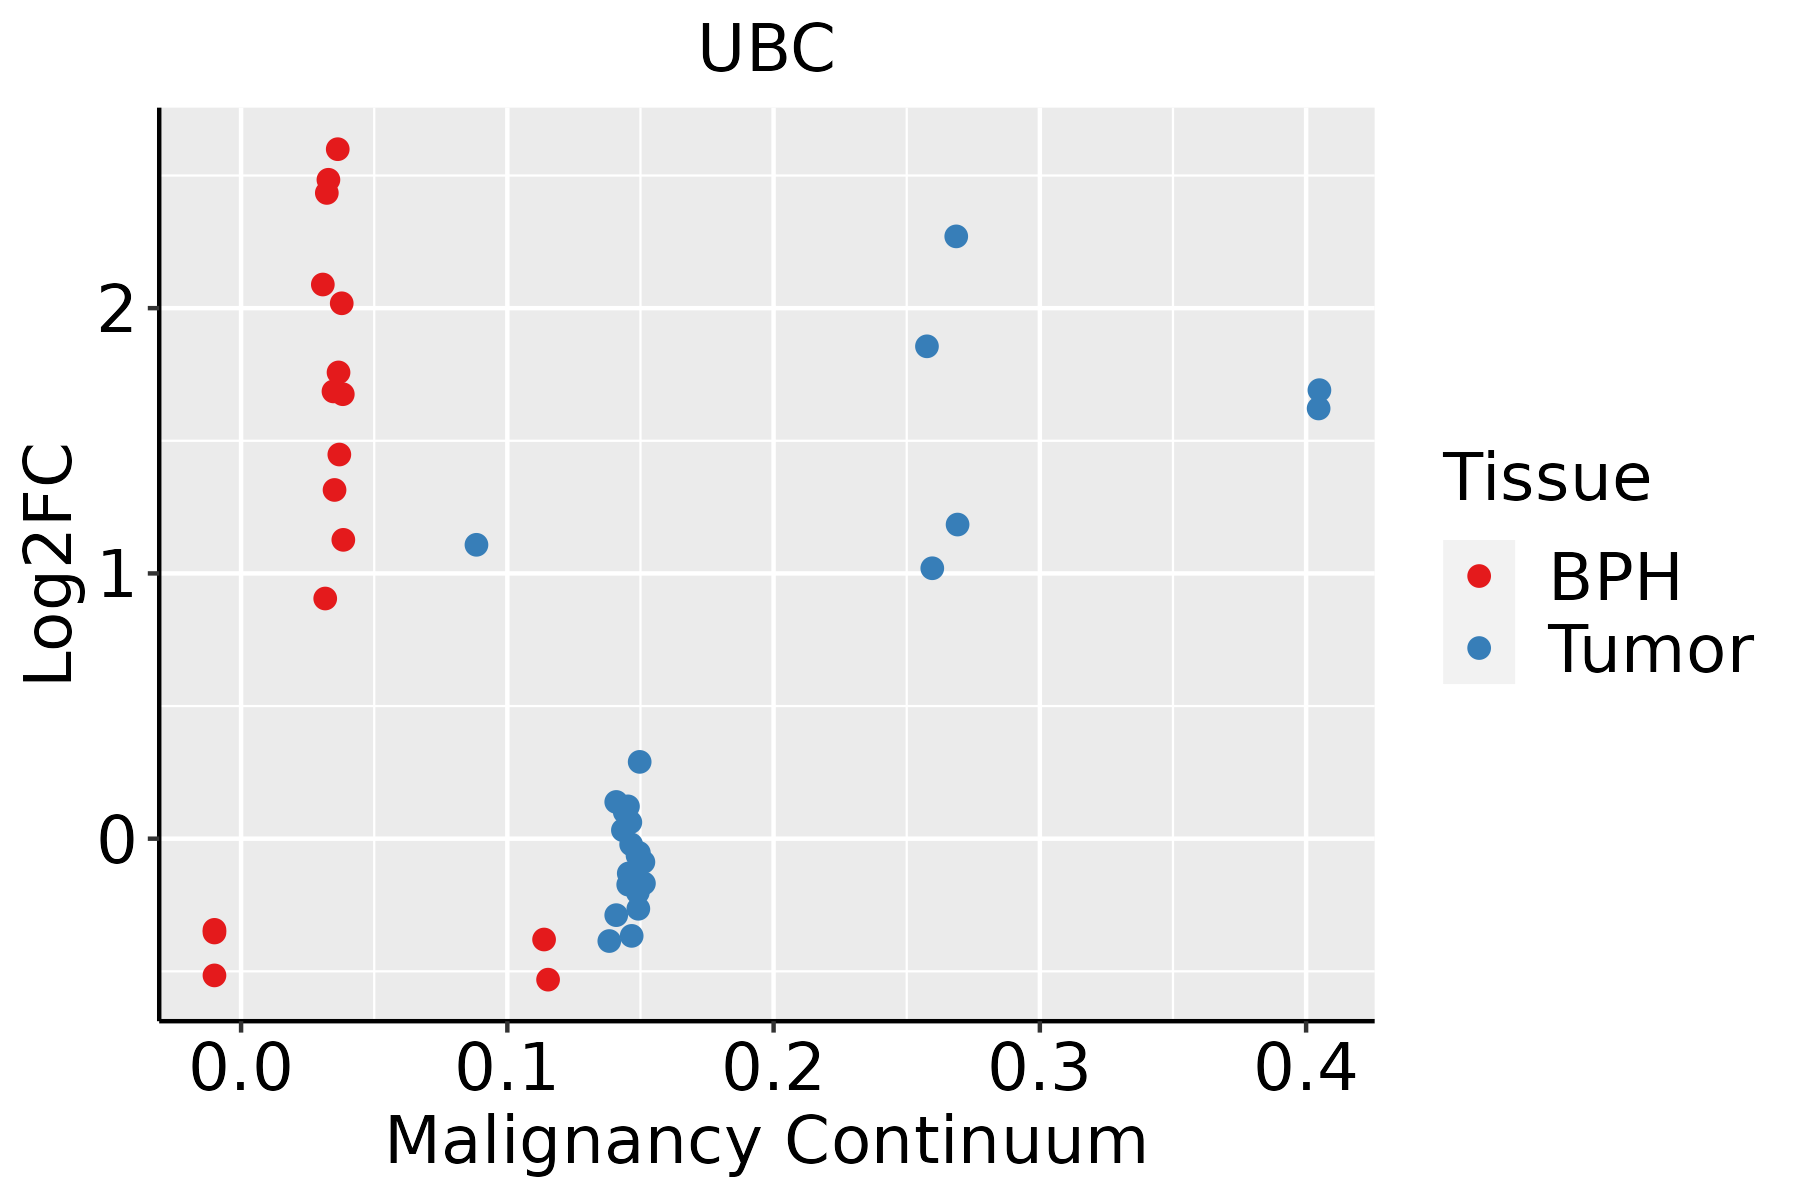 | BPH: Benign Prostatic Hyperplasia |
| Skin | 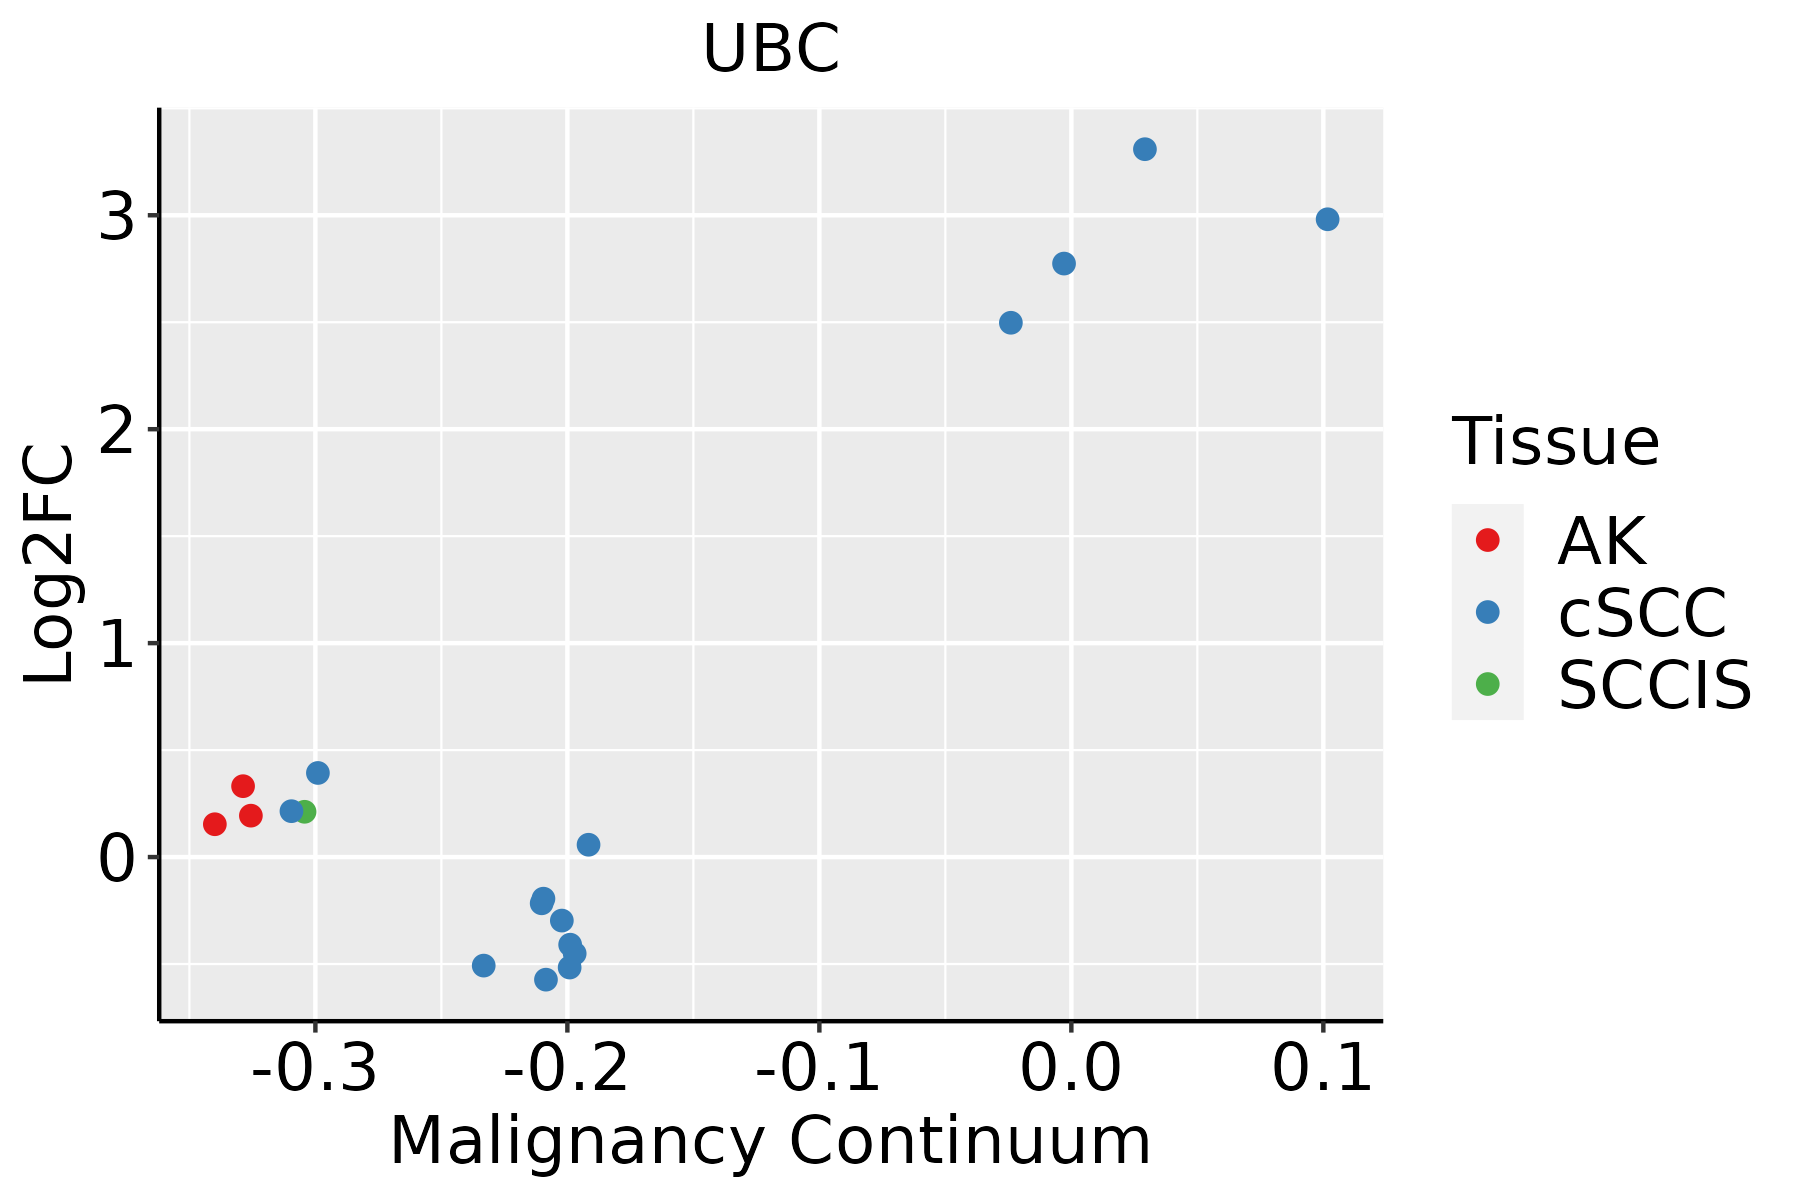 | AK: Actinic keratosis |
| cSCC: Cutaneous squamous cell carcinoma | ||
| SCCIS:squamous cell carcinoma in situ | ||
| Thyroid |  | ATC: Anaplastic thyroid cancer |
| HT: Hashimoto's thyroiditis | ||
| PTC: Papillary thyroid cancer |
| ∗log2FC in expression of this searched gene in stem-like cells from each diseased tissue sample relative to stem-like cells in normal samples in each tissue plotted against the malignancy continuum. Samples are colored based on if they are from different disease stage. |
Top |
Malignant transformation related pathway analysis |
| Find out the enriched GO biological processes and KEGG pathways involved in transition from healthy to precancer to cancer |
| Tissue | Disease Stage | Enriched GO biological Processes |
| Colorectum | AD |  |
| Colorectum | SER |  |
| Colorectum | MSS |  |
| Colorectum | MSI-H |  |
| Colorectum | FAP |  |
| ∗Top 15 enriched GO BP terms are showed in the bar plot of each disease state in each tissue. Each row represents a significant GO biological process which is colored according to the -log10(p.adjust). |
| Page: 1 2 3 4 5 6 7 8 9 |
| GO ID | Tissue | Disease Stage | Description | Gene Ratio | Bg Ratio | pvalue | p.adjust | Count |
| GO:00105074 | Liver | HCC | negative regulation of autophagy | 57/7958 | 85/18723 | 4.10e-06 | 5.27e-05 | 57 |
| GO:00192162 | Liver | HCC | regulation of lipid metabolic process | 181/7958 | 331/18723 | 4.58e-06 | 5.79e-05 | 181 |
| GO:00973521 | Liver | HCC | autophagosome maturation | 30/7958 | 40/18723 | 3.04e-05 | 3.12e-04 | 30 |
| GO:003010021 | Liver | HCC | regulation of endocytosis | 117/7958 | 211/18723 | 9.56e-05 | 8.32e-04 | 117 |
| GO:0016242 | Liver | HCC | negative regulation of macroautophagy | 25/7958 | 34/18723 | 2.42e-04 | 1.81e-03 | 25 |
| GO:00432444 | Liver | HCC | regulation of protein-containing complex disassembly | 66/7958 | 121/18723 | 4.94e-03 | 2.07e-02 | 66 |
| GO:002241119 | Oral cavity | OSCC | cellular component disassembly | 283/7305 | 443/18723 | 9.57e-27 | 3.37e-24 | 283 |
| GO:001623610 | Oral cavity | OSCC | macroautophagy | 192/7305 | 291/18723 | 7.01e-21 | 1.14e-18 | 192 |
| GO:001050610 | Oral cavity | OSCC | regulation of autophagy | 198/7305 | 317/18723 | 1.63e-17 | 1.51e-15 | 198 |
| GO:005134820 | Oral cavity | OSCC | negative regulation of transferase activity | 165/7305 | 268/18723 | 5.02e-14 | 2.74e-12 | 165 |
| GO:001056320 | Oral cavity | OSCC | negative regulation of phosphorus metabolic process | 246/7305 | 442/18723 | 6.12e-13 | 2.89e-11 | 246 |
| GO:004593620 | Oral cavity | OSCC | negative regulation of phosphate metabolic process | 245/7305 | 441/18723 | 8.85e-13 | 4.09e-11 | 245 |
| GO:00162417 | Oral cavity | OSCC | regulation of macroautophagy | 96/7305 | 141/18723 | 2.33e-12 | 9.75e-11 | 96 |
| GO:004232619 | Oral cavity | OSCC | negative regulation of phosphorylation | 214/7305 | 385/18723 | 2.30e-11 | 7.74e-10 | 214 |
| GO:003298410 | Oral cavity | OSCC | protein-containing complex disassembly | 136/7305 | 224/18723 | 3.42e-11 | 1.13e-09 | 136 |
| GO:000989519 | Oral cavity | OSCC | negative regulation of catabolic process | 180/7305 | 320/18723 | 2.44e-10 | 6.86e-09 | 180 |
| GO:003367317 | Oral cavity | OSCC | negative regulation of kinase activity | 140/7305 | 237/18723 | 2.74e-10 | 7.57e-09 | 140 |
| GO:003133020 | Oral cavity | OSCC | negative regulation of cellular catabolic process | 152/7305 | 262/18723 | 3.04e-10 | 8.28e-09 | 152 |
| GO:00719855 | Oral cavity | OSCC | multivesicular body sorting pathway | 31/7305 | 37/18723 | 2.80e-08 | 5.41e-07 | 31 |
| GO:003010016 | Oral cavity | OSCC | regulation of endocytosis | 121/7305 | 211/18723 | 4.74e-08 | 8.80e-07 | 121 |
| Page: 1 2 3 4 5 6 7 8 |
| Pathway ID | Tissue | Disease Stage | Description | Gene Ratio | Bg Ratio | pvalue | p.adjust | qvalue | Count |
| hsa0501218 | Breast | Precancer | Parkinson disease | 99/684 | 266/8465 | 3.58e-42 | 5.65e-40 | 4.33e-40 | 99 |
| hsa0502216 | Breast | Precancer | Pathways of neurodegeneration - multiple diseases | 112/684 | 476/8465 | 6.96e-27 | 2.44e-25 | 1.87e-25 | 112 |
| hsa0513118 | Breast | Precancer | Shigellosis | 44/684 | 247/8465 | 3.91e-07 | 6.86e-06 | 5.26e-06 | 44 |
| hsa0516718 | Breast | Precancer | Kaposi sarcoma-associated herpesvirus infection | 36/684 | 194/8465 | 1.68e-06 | 2.53e-05 | 1.94e-05 | 36 |
| hsa0413716 | Breast | Precancer | Mitophagy - animal | 15/684 | 72/8465 | 5.22e-04 | 3.93e-03 | 3.01e-03 | 15 |
| hsa0501219 | Breast | Precancer | Parkinson disease | 99/684 | 266/8465 | 3.58e-42 | 5.65e-40 | 4.33e-40 | 99 |
| hsa0502217 | Breast | Precancer | Pathways of neurodegeneration - multiple diseases | 112/684 | 476/8465 | 6.96e-27 | 2.44e-25 | 1.87e-25 | 112 |
| hsa0513119 | Breast | Precancer | Shigellosis | 44/684 | 247/8465 | 3.91e-07 | 6.86e-06 | 5.26e-06 | 44 |
| hsa0516719 | Breast | Precancer | Kaposi sarcoma-associated herpesvirus infection | 36/684 | 194/8465 | 1.68e-06 | 2.53e-05 | 1.94e-05 | 36 |
| hsa0413717 | Breast | Precancer | Mitophagy - animal | 15/684 | 72/8465 | 5.22e-04 | 3.93e-03 | 3.01e-03 | 15 |
| hsa0501224 | Breast | IDC | Parkinson disease | 107/867 | 266/8465 | 2.57e-39 | 8.36e-37 | 6.26e-37 | 107 |
| hsa0502223 | Breast | IDC | Pathways of neurodegeneration - multiple diseases | 116/867 | 476/8465 | 3.63e-20 | 1.18e-18 | 8.82e-19 | 116 |
| hsa0513124 | Breast | IDC | Shigellosis | 47/867 | 247/8465 | 1.78e-05 | 2.00e-04 | 1.49e-04 | 47 |
| hsa0516723 | Breast | IDC | Kaposi sarcoma-associated herpesvirus infection | 38/867 | 194/8465 | 5.87e-05 | 5.96e-04 | 4.46e-04 | 38 |
| hsa0413723 | Breast | IDC | Mitophagy - animal | 17/867 | 72/8465 | 7.61e-04 | 6.04e-03 | 4.52e-03 | 17 |
| hsa0501234 | Breast | IDC | Parkinson disease | 107/867 | 266/8465 | 2.57e-39 | 8.36e-37 | 6.26e-37 | 107 |
| hsa0502233 | Breast | IDC | Pathways of neurodegeneration - multiple diseases | 116/867 | 476/8465 | 3.63e-20 | 1.18e-18 | 8.82e-19 | 116 |
| hsa0513134 | Breast | IDC | Shigellosis | 47/867 | 247/8465 | 1.78e-05 | 2.00e-04 | 1.49e-04 | 47 |
| hsa0516733 | Breast | IDC | Kaposi sarcoma-associated herpesvirus infection | 38/867 | 194/8465 | 5.87e-05 | 5.96e-04 | 4.46e-04 | 38 |
| hsa0413733 | Breast | IDC | Mitophagy - animal | 17/867 | 72/8465 | 7.61e-04 | 6.04e-03 | 4.52e-03 | 17 |
| Page: 1 2 3 4 5 6 7 8 9 10 11 12 13 14 15 |
Top |
Cell-cell communication analysis |
| Identification of potential cell-cell interactions between two cell types and their ligand-receptor pairs for different disease states |
| Ligand | Receptor | LRpair | Pathway | Tissue | Disease Stage |
| Page: 1 |
Top |
Single-cell gene regulatory network inference analysis |
| Find out the significant the regulons (TFs) and the target genes of each regulon across cell types for different disease states |
| TF | Cell Type | Tissue | Disease Stage | Target Gene | RSS | Regulon Activity |
| ∗The dot plots of a searched regulon are shown for all cell subpopulations in each disease state of each tissue based on the regulon specific score inferred using pySCENIC and by calculating the average expression. |
| Page: 1 |
Top |
Somatic mutation of malignant transformation related genes |
| Annotation of somatic variants for genes involved in malignant transformation |
| Hugo Symbol | Variant Class | Variant Classification | dbSNP RS | HGVSc | HGVSp | HGVSp Short | SWISSPROT | BIOTYPE | SIFT | PolyPhen | Tumor Sample Barcode | Tissue | Histology | Sex | Age | Stage | Therapy Types | Drugs | Outcome |
| UBC | SNV | Missense_Mutation | novel | c.1255G>T | p.Asp419Tyr | p.D419Y | P0CG48 | protein_coding | deleterious(0.03) | probably_damaging(0.944) | TCGA-A2-A0SU-01 | Breast | breast invasive carcinoma | Female | >=65 | I/II | Hormone Therapy | arimidex | SD |
| UBC | SNV | Missense_Mutation | c.1082N>G | p.Ser361Cys | p.S361C | P0CG48 | protein_coding | deleterious(0) | possibly_damaging(0.789) | TCGA-AC-A23H-01 | Breast | breast invasive carcinoma | Female | >=65 | I/II | Unknown | Unknown | PD | |
| UBC | SNV | Missense_Mutation | novel | c.1133N>C | p.Arg378Thr | p.R378T | P0CG48 | protein_coding | deleterious(0.02) | possibly_damaging(0.511) | TCGA-AC-A5XS-01 | Breast | breast invasive carcinoma | Female | >=65 | I/II | Hormone Therapy | femara | SD |
| UBC | SNV | Missense_Mutation | c.1849A>C | p.Thr617Pro | p.T617P | P0CG48 | protein_coding | deleterious(0.03) | probably_damaging(0.933) | TCGA-AN-A03Y-01 | Breast | breast invasive carcinoma | Female | >=65 | I/II | Unknown | Unknown | SD | |
| UBC | SNV | Missense_Mutation | c.368N>C | p.Gly123Ala | p.G123A | P0CG48 | protein_coding | deleterious(0) | probably_damaging(0.959) | TCGA-B6-A0WZ-01 | Breast | breast invasive carcinoma | Female | <65 | I/II | Unknown | Unknown | PD | |
| UBC | SNV | Missense_Mutation | c.1922N>C | p.Lys641Thr | p.K641T | P0CG48 | protein_coding | deleterious(0) | possibly_damaging(0.735) | TCGA-BH-A18H-01 | Breast | breast invasive carcinoma | Female | <65 | I/II | Chemotherapy | adriamycin | CR | |
| UBC | SNV | Missense_Mutation | c.1361N>C | p.Arg454Thr | p.R454T | P0CG48 | protein_coding | tolerated(0.05) | possibly_damaging(0.889) | TCGA-BH-A18U-01 | Breast | breast invasive carcinoma | Female | >=65 | III/IV | Unknown | Unknown | SD | |
| UBC | SNV | Missense_Mutation | c.373N>G | p.Gln125Glu | p.Q125E | P0CG48 | protein_coding | tolerated(0.08) | benign(0.265) | TCGA-D8-A143-01 | Breast | breast invasive carcinoma | Female | <65 | I/II | Chemotherapy | doxorubicin | SD | |
| UBC | insertion | Frame_Shift_Ins | novel | c.1687_1688insC | p.Gln563ProfsTer9 | p.Q563Pfs*9 | P0CG48 | protein_coding | TCGA-AR-A24N-01 | Breast | breast invasive carcinoma | Female | <65 | I/II | Unknown | Unknown | SD | ||
| UBC | insertion | In_Frame_Ins | novel | c.1579_1580insGTCTAATTTTTTTTG | p.Leu527delinsArgLeuIlePhePheVal | p.L527delinsRLIFFV | P0CG48 | protein_coding | TCGA-B6-A0IA-01 | Breast | breast invasive carcinoma | Female | <65 | I/II | Unknown | Unknown | SD |
| Page: 1 2 3 4 5 6 7 |
Top |
Related drugs of malignant transformation related genes |
| Identification of chemicals and drugs interact with genes involved in malignant transfromation |
| (DGIdb 4.0) |
| Entrez ID | Symbol | Category | Interaction Types | Drug Claim Name | Drug Name | PMIDs |
| 7316 | UBC | KINASE, TRANSCRIPTION FACTOR | PMID25553724-Compound-US20130237529 35 | |||
| 7316 | UBC | KINASE, TRANSCRIPTION FACTOR | PMID25553724-Compound-US20130237529 36 |
| Page: 1 |

Copyright 2023-Present -The University of Texas Health Science Center at Houston |