
|
|||||
|
 | |
| |
| |
| |
| |
| |
|
Gene: TWSG1 |
Gene summary for TWSG1 |
| Gene information | Species | Human | Gene symbol | TWSG1 | Gene ID | 57045 |
| Gene name | twisted gastrulation BMP signaling modulator 1 | |
| Gene Alias | TSG | |
| Cytomap | 18p11.22 | |
| Gene Type | protein-coding | GO ID | GO:0001503 | UniProtAcc | Q9GZX9 |
Top |
Malignant transformation analysis |
| Identification of the aberrant gene expression in precancerous and cancerous lesions by comparing the gene expression of stem-like cells in diseased tissues with normal stem cells |
| Entrez ID | Symbol | Replicates | Species | Organ | Tissue | Adj P-value | Log2FC | Malignancy |
| 57045 | TWSG1 | LZE2T | Human | Esophagus | ESCC | 9.37e-05 | 9.51e-01 | 0.082 |
| 57045 | TWSG1 | LZE7T | Human | Esophagus | ESCC | 2.00e-02 | 3.81e-01 | 0.0667 |
| 57045 | TWSG1 | LZE22T | Human | Esophagus | ESCC | 3.21e-03 | 9.72e-02 | 0.068 |
| 57045 | TWSG1 | LZE24T | Human | Esophagus | ESCC | 1.38e-12 | 4.23e-01 | 0.0596 |
| 57045 | TWSG1 | LZE6T | Human | Esophagus | ESCC | 2.90e-03 | -6.91e-03 | 0.0845 |
| 57045 | TWSG1 | P1T-E | Human | Esophagus | ESCC | 3.49e-06 | 1.71e-01 | 0.0875 |
| 57045 | TWSG1 | P2T-E | Human | Esophagus | ESCC | 7.07e-27 | 7.35e-01 | 0.1177 |
| 57045 | TWSG1 | P4T-E | Human | Esophagus | ESCC | 1.48e-24 | 5.70e-01 | 0.1323 |
| 57045 | TWSG1 | P5T-E | Human | Esophagus | ESCC | 4.20e-09 | 3.46e-01 | 0.1327 |
| 57045 | TWSG1 | P8T-E | Human | Esophagus | ESCC | 9.96e-17 | 3.12e-01 | 0.0889 |
| 57045 | TWSG1 | P9T-E | Human | Esophagus | ESCC | 1.57e-12 | 1.39e-01 | 0.1131 |
| 57045 | TWSG1 | P10T-E | Human | Esophagus | ESCC | 6.06e-09 | 1.77e-01 | 0.116 |
| 57045 | TWSG1 | P11T-E | Human | Esophagus | ESCC | 2.06e-06 | 5.16e-01 | 0.1426 |
| 57045 | TWSG1 | P12T-E | Human | Esophagus | ESCC | 4.95e-31 | 7.79e-01 | 0.1122 |
| 57045 | TWSG1 | P15T-E | Human | Esophagus | ESCC | 6.06e-10 | 2.56e-01 | 0.1149 |
| 57045 | TWSG1 | P16T-E | Human | Esophagus | ESCC | 5.85e-19 | 4.26e-01 | 0.1153 |
| 57045 | TWSG1 | P20T-E | Human | Esophagus | ESCC | 5.88e-12 | 2.22e-01 | 0.1124 |
| 57045 | TWSG1 | P21T-E | Human | Esophagus | ESCC | 5.33e-28 | 4.34e-01 | 0.1617 |
| 57045 | TWSG1 | P22T-E | Human | Esophagus | ESCC | 1.96e-24 | 4.93e-01 | 0.1236 |
| 57045 | TWSG1 | P23T-E | Human | Esophagus | ESCC | 1.76e-27 | 7.51e-01 | 0.108 |
| Page: 1 2 3 4 |
| Tissue | Expression Dynamics | Abbreviation |
| Esophagus | 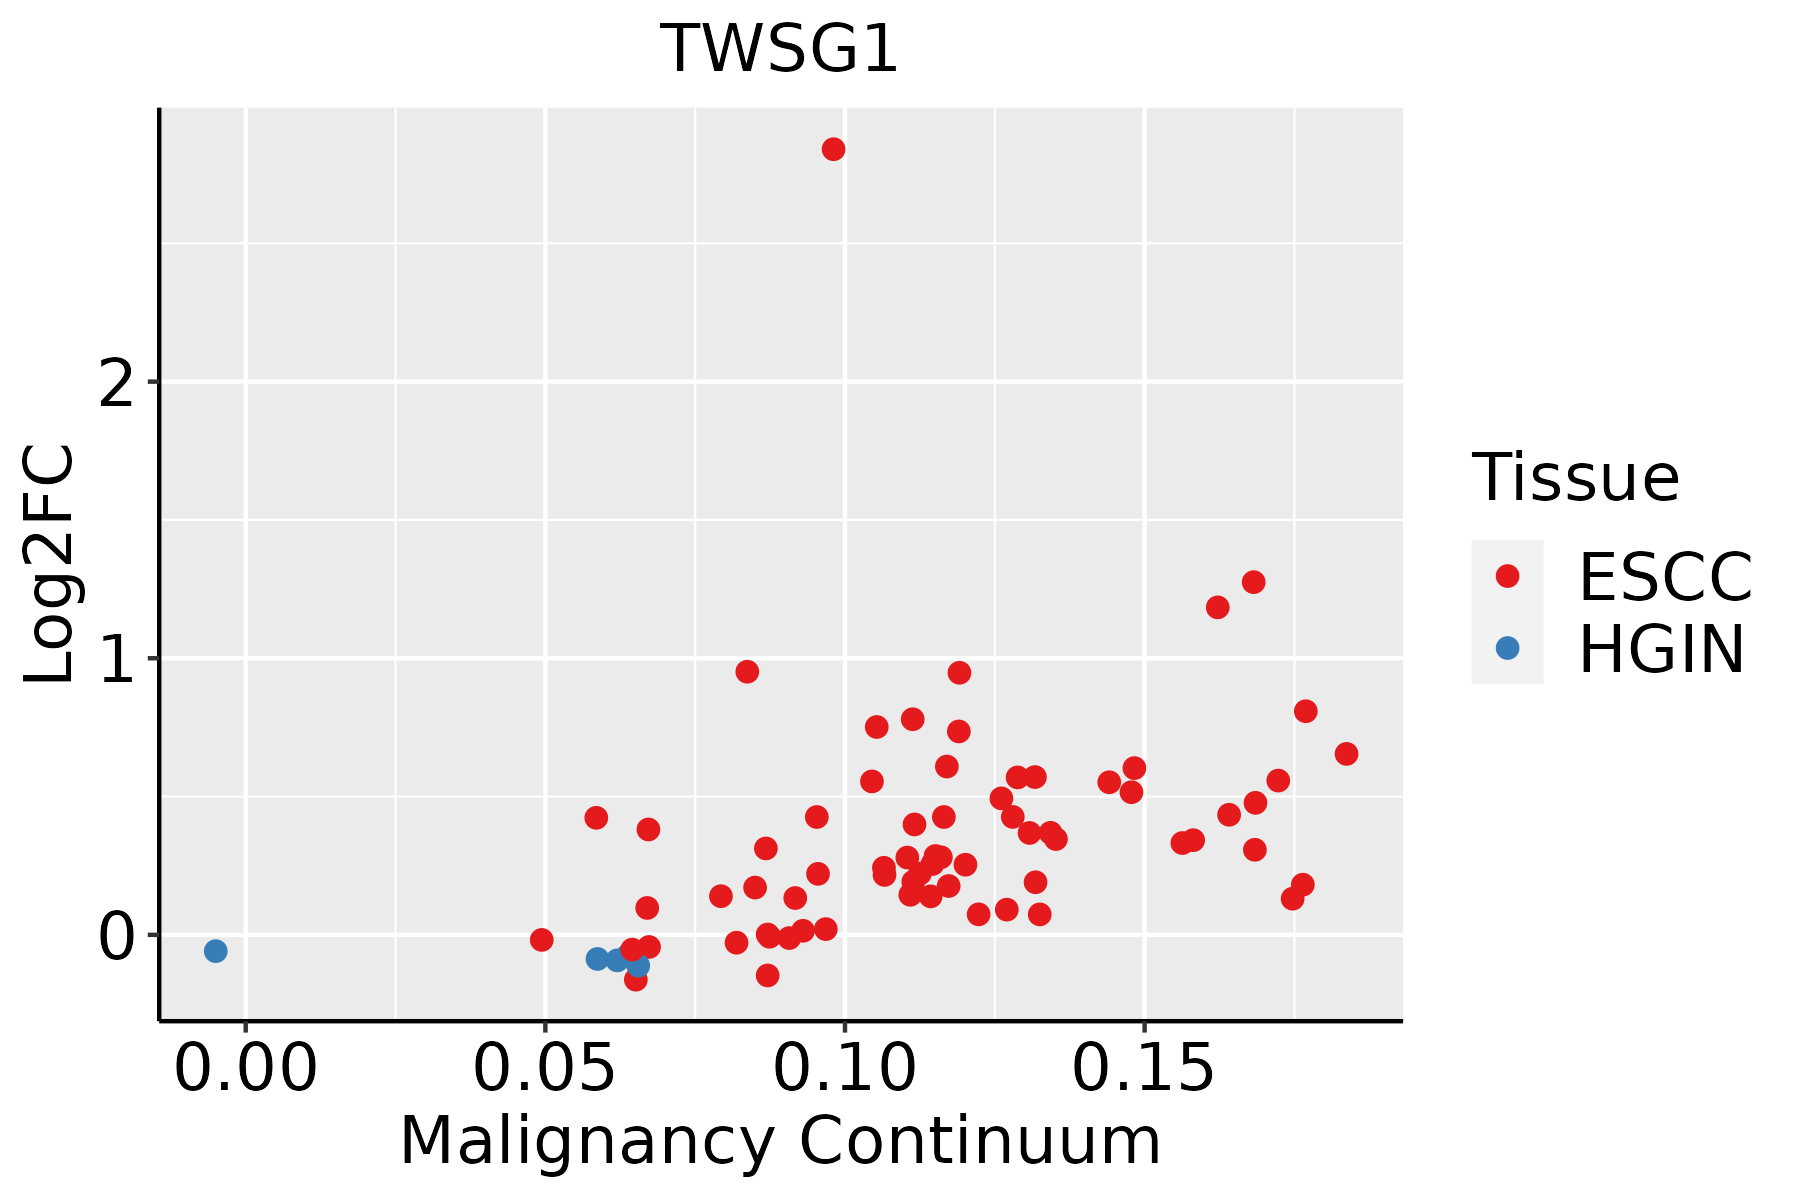 | ESCC: Esophageal squamous cell carcinoma |
| HGIN: High-grade intraepithelial neoplasias | ||
| LGIN: Low-grade intraepithelial neoplasias | ||
| Oral Cavity |  | EOLP: Erosive Oral lichen planus |
| LP: leukoplakia | ||
| NEOLP: Non-erosive oral lichen planus | ||
| OSCC: Oral squamous cell carcinoma | ||
| Skin |  | AK: Actinic keratosis |
| cSCC: Cutaneous squamous cell carcinoma | ||
| SCCIS:squamous cell carcinoma in situ |
| ∗log2FC in expression of this searched gene in stem-like cells from each diseased tissue sample relative to stem-like cells in normal samples in each tissue plotted against the malignancy continuum. Samples are colored based on if they are from different disease stage. |
Top |
Malignant transformation related pathway analysis |
| Find out the enriched GO biological processes and KEGG pathways involved in transition from healthy to precancer to cancer |
| Tissue | Disease Stage | Enriched GO biological Processes |
| Colorectum | AD |  |
| Colorectum | SER |  |
| Colorectum | MSS |  |
| Colorectum | MSI-H |  |
| Colorectum | FAP |  |
| ∗Top 15 enriched GO BP terms are showed in the bar plot of each disease state in each tissue. Each row represents a significant GO biological process which is colored according to the -log10(p.adjust). |
| Page: 1 2 3 4 5 6 7 8 9 |
| GO ID | Tissue | Disease Stage | Description | Gene Ratio | Bg Ratio | pvalue | p.adjust | Count |
| GO:00900924 | Oral cavity | EOLP | regulation of transmembrane receptor protein serine/threonine kinase signaling pathway | 46/2218 | 256/18723 | 2.53e-03 | 1.53e-02 | 46 |
| GO:00901012 | Oral cavity | EOLP | negative regulation of transmembrane receptor protein serine/threonine kinase signaling pathway | 27/2218 | 131/18723 | 2.76e-03 | 1.65e-02 | 27 |
| GO:2000515 | Oral cavity | EOLP | negative regulation of CD4-positive, alpha-beta T cell activation | 10/2218 | 32/18723 | 2.93e-03 | 1.72e-02 | 10 |
| GO:00016542 | Oral cavity | EOLP | eye development | 62/2218 | 371/18723 | 3.18e-03 | 1.85e-02 | 62 |
| GO:0030510 | Oral cavity | EOLP | regulation of BMP signaling pathway | 21/2218 | 96/18723 | 3.75e-03 | 2.10e-02 | 21 |
| GO:01500632 | Oral cavity | EOLP | visual system development | 62/2218 | 375/18723 | 4.07e-03 | 2.24e-02 | 62 |
| GO:000164922 | Oral cavity | EOLP | osteoblast differentiation | 41/2218 | 229/18723 | 4.47e-03 | 2.42e-02 | 41 |
| GO:00488802 | Oral cavity | EOLP | sensory system development | 62/2218 | 381/18723 | 5.82e-03 | 2.94e-02 | 62 |
| GO:00305093 | Oral cavity | EOLP | BMP signaling pathway | 29/2218 | 152/18723 | 6.29e-03 | 3.13e-02 | 29 |
| GO:000170412 | Oral cavity | EOLP | formation of primary germ layer | 24/2218 | 121/18723 | 7.53e-03 | 3.62e-02 | 24 |
| GO:00357391 | Oral cavity | EOLP | CD4-positive, alpha-beta T cell proliferation | 5/2218 | 12/18723 | 8.97e-03 | 4.12e-02 | 5 |
| GO:20005611 | Oral cavity | EOLP | regulation of CD4-positive, alpha-beta T cell proliferation | 5/2218 | 12/18723 | 8.97e-03 | 4.12e-02 | 5 |
| GO:0090288 | Oral cavity | EOLP | negative regulation of cellular response to growth factor stimulus | 22/2218 | 111/18723 | 1.03e-02 | 4.63e-02 | 22 |
| GO:00717724 | Oral cavity | EOLP | response to BMP | 30/2218 | 165/18723 | 1.10e-02 | 4.86e-02 | 30 |
| GO:00717734 | Oral cavity | EOLP | cellular response to BMP stimulus | 30/2218 | 165/18723 | 1.10e-02 | 4.86e-02 | 30 |
| GO:007155924 | Oral cavity | NEOLP | response to transforming growth factor beta | 59/2005 | 256/18723 | 8.84e-09 | 4.49e-07 | 59 |
| GO:007156024 | Oral cavity | NEOLP | cellular response to transforming growth factor beta stimulus | 58/2005 | 250/18723 | 9.13e-09 | 4.56e-07 | 58 |
| GO:000150331 | Oral cavity | NEOLP | ossification | 81/2005 | 408/18723 | 2.67e-08 | 1.15e-06 | 81 |
| GO:000717923 | Oral cavity | NEOLP | transforming growth factor beta receptor signaling pathway | 48/2005 | 198/18723 | 4.01e-08 | 1.66e-06 | 48 |
| GO:000717822 | Oral cavity | NEOLP | transmembrane receptor protein serine/threonine kinase signaling pathway | 70/2005 | 355/18723 | 3.04e-07 | 9.62e-06 | 70 |
| Page: 1 2 3 4 5 6 7 8 |
| Pathway ID | Tissue | Disease Stage | Description | Gene Ratio | Bg Ratio | pvalue | p.adjust | qvalue | Count |
| Page: 1 |
Top |
Cell-cell communication analysis |
| Identification of potential cell-cell interactions between two cell types and their ligand-receptor pairs for different disease states |
| Ligand | Receptor | LRpair | Pathway | Tissue | Disease Stage |
| Page: 1 |
Top |
Single-cell gene regulatory network inference analysis |
| Find out the significant the regulons (TFs) and the target genes of each regulon across cell types for different disease states |
| TF | Cell Type | Tissue | Disease Stage | Target Gene | RSS | Regulon Activity |
| ∗The dot plots of a searched regulon are shown for all cell subpopulations in each disease state of each tissue based on the regulon specific score inferred using pySCENIC and by calculating the average expression. |
| Page: 1 |
Top |
Somatic mutation of malignant transformation related genes |
| Annotation of somatic variants for genes involved in malignant transformation |
| Hugo Symbol | Variant Class | Variant Classification | dbSNP RS | HGVSc | HGVSp | HGVSp Short | SWISSPROT | BIOTYPE | SIFT | PolyPhen | Tumor Sample Barcode | Tissue | Histology | Sex | Age | Stage | Therapy Types | Drugs | Outcome |
| TWSG1 | SNV | Missense_Mutation | c.155A>T | p.Asn52Ile | p.N52I | Q9GZX9 | protein_coding | deleterious(0) | probably_damaging(0.972) | TCGA-D8-A1XQ-01 | Breast | breast invasive carcinoma | Female | >=65 | I/II | Unknown | Unknown | SD | |
| TWSG1 | SNV | Missense_Mutation | c.331G>C | p.Asp111His | p.D111H | Q9GZX9 | protein_coding | tolerated(0.08) | benign(0.05) | TCGA-E2-A1LH-01 | Breast | breast invasive carcinoma | Female | <65 | I/II | Chemotherapy | adriamycin | SD | |
| TWSG1 | deletion | Frame_Shift_Del | novel | c.534delN | p.His179IlefsTer41 | p.H179Ifs*41 | Q9GZX9 | protein_coding | TCGA-D8-A27V-01 | Breast | breast invasive carcinoma | Female | <65 | I/II | Hormone Therapy | tamoxiphen | SD | ||
| TWSG1 | SNV | Missense_Mutation | rs376720221 | c.226N>G | p.Met76Val | p.M76V | Q9GZX9 | protein_coding | deleterious(0.01) | benign(0.07) | TCGA-2W-A8YY-01 | Cervix | cervical & endocervical cancer | Female | <65 | I/II | Chemotherapy | cisplatin | CR |
| TWSG1 | SNV | Missense_Mutation | c.521N>G | p.Asp174Gly | p.D174G | Q9GZX9 | protein_coding | deleterious(0.01) | benign(0.233) | TCGA-AA-3710-01 | Colorectum | colon adenocarcinoma | Female | >=65 | I/II | Unknown | Unknown | SD | |
| TWSG1 | SNV | Missense_Mutation | c.307N>A | p.Leu103Ile | p.L103I | Q9GZX9 | protein_coding | deleterious(0) | probably_damaging(0.984) | TCGA-AA-A010-01 | Colorectum | colon adenocarcinoma | Female | <65 | I/II | Chemotherapy | folinic | CR | |
| TWSG1 | SNV | Missense_Mutation | c.251N>T | p.Asp84Val | p.D84V | Q9GZX9 | protein_coding | deleterious(0.03) | possibly_damaging(0.494) | TCGA-AZ-6598-01 | Colorectum | colon adenocarcinoma | Female | >=65 | I/II | Unknown | Unknown | SD | |
| TWSG1 | SNV | Missense_Mutation | c.454N>G | p.Ser152Gly | p.S152G | Q9GZX9 | protein_coding | tolerated(0.48) | benign(0.003) | TCGA-CM-4743-01 | Colorectum | colon adenocarcinoma | Male | >=65 | I/II | Chemotherapy | capecitabine | SD | |
| TWSG1 | SNV | Missense_Mutation | novel | c.393G>T | p.Glu131Asp | p.E131D | Q9GZX9 | protein_coding | tolerated(0.13) | benign(0.424) | TCGA-AG-A002-01 | Colorectum | rectum adenocarcinoma | Male | <65 | I/II | Unknown | Unknown | SD |
| TWSG1 | SNV | Missense_Mutation | c.325N>C | p.Glu109Gln | p.E109Q | Q9GZX9 | protein_coding | deleterious(0.01) | benign(0.054) | TCGA-CI-6620-01 | Colorectum | rectum adenocarcinoma | Female | <65 | I/II | Ancillary | leucovorin | PD |
| Page: 1 2 3 |
Top |
Related drugs of malignant transformation related genes |
| Identification of chemicals and drugs interact with genes involved in malignant transfromation |
| (DGIdb 4.0) |
| Entrez ID | Symbol | Category | Interaction Types | Drug Claim Name | Drug Name | PMIDs |
| Page: 1 |

Copyright 2023-Present -The University of Texas Health Science Center at Houston |