
|
|||||
|
 | |
| |
| |
| |
| |
| |
|
Gene: TST |
Gene summary for TST |
| Gene information | Species | Human | Gene symbol | TST | Gene ID | 7263 |
| Gene name | thiosulfate sulfurtransferase | |
| Gene Alias | RDS | |
| Cytomap | 22q12.3 | |
| Gene Type | protein-coding | GO ID | GO:0000096 | UniProtAcc | Q16762 |
Top |
Malignant transformation analysis |
| Identification of the aberrant gene expression in precancerous and cancerous lesions by comparing the gene expression of stem-like cells in diseased tissues with normal stem cells |
| Entrez ID | Symbol | Replicates | Species | Organ | Tissue | Adj P-value | Log2FC | Malignancy |
| 7263 | TST | HTA11_3410_2000001011 | Human | Colorectum | AD | 2.11e-24 | 6.32e-01 | 0.0155 |
| 7263 | TST | HTA11_2487_2000001011 | Human | Colorectum | SER | 3.29e-52 | 2.13e+00 | -0.1808 |
| 7263 | TST | HTA11_2951_2000001011 | Human | Colorectum | AD | 1.85e-08 | 8.96e-01 | 0.0216 |
| 7263 | TST | HTA11_1938_2000001011 | Human | Colorectum | AD | 6.91e-33 | 1.42e+00 | -0.0811 |
| 7263 | TST | HTA11_78_2000001011 | Human | Colorectum | AD | 4.79e-17 | 1.01e+00 | -0.1088 |
| 7263 | TST | HTA11_347_2000001011 | Human | Colorectum | AD | 2.63e-70 | 1.73e+00 | -0.1954 |
| 7263 | TST | HTA11_411_2000001011 | Human | Colorectum | SER | 1.22e-15 | 2.62e+00 | -0.2602 |
| 7263 | TST | HTA11_2112_2000001011 | Human | Colorectum | SER | 2.03e-16 | 1.99e+00 | -0.2196 |
| 7263 | TST | HTA11_3361_2000001011 | Human | Colorectum | AD | 1.45e-37 | 1.61e+00 | -0.1207 |
| 7263 | TST | HTA11_83_2000001011 | Human | Colorectum | SER | 1.89e-41 | 1.98e+00 | -0.1526 |
| 7263 | TST | HTA11_696_2000001011 | Human | Colorectum | AD | 1.14e-69 | 1.81e+00 | -0.1464 |
| 7263 | TST | HTA11_866_2000001011 | Human | Colorectum | AD | 1.17e-40 | 1.17e+00 | -0.1001 |
| 7263 | TST | HTA11_1391_2000001011 | Human | Colorectum | AD | 3.00e-51 | 1.65e+00 | -0.059 |
| 7263 | TST | HTA11_2992_2000001011 | Human | Colorectum | SER | 7.90e-27 | 2.25e+00 | -0.1706 |
| 7263 | TST | HTA11_5212_2000001011 | Human | Colorectum | AD | 1.69e-35 | 2.39e+00 | -0.2061 |
| 7263 | TST | HTA11_5216_2000001011 | Human | Colorectum | SER | 1.47e-21 | 2.06e+00 | -0.1462 |
| 7263 | TST | HTA11_546_2000001011 | Human | Colorectum | AD | 1.44e-35 | 1.48e+00 | -0.0842 |
| 7263 | TST | HTA11_9341_2000001011 | Human | Colorectum | SER | 6.71e-08 | 1.05e+00 | -0.00410000000000005 |
| 7263 | TST | HTA11_7862_2000001011 | Human | Colorectum | AD | 3.63e-22 | 1.22e+00 | -0.0179 |
| 7263 | TST | HTA11_866_3004761011 | Human | Colorectum | AD | 7.13e-38 | 1.04e+00 | 0.096 |
| Page: 1 2 3 4 5 6 7 |
| Tissue | Expression Dynamics | Abbreviation |
| Colorectum (GSE201348) |  | FAP: Familial adenomatous polyposis |
| CRC: Colorectal cancer | ||
| Colorectum (HTA11) |  | AD: Adenomas |
| SER: Sessile serrated lesions | ||
| MSI-H: Microsatellite-high colorectal cancer | ||
| MSS: Microsatellite stable colorectal cancer | ||
| Esophagus | 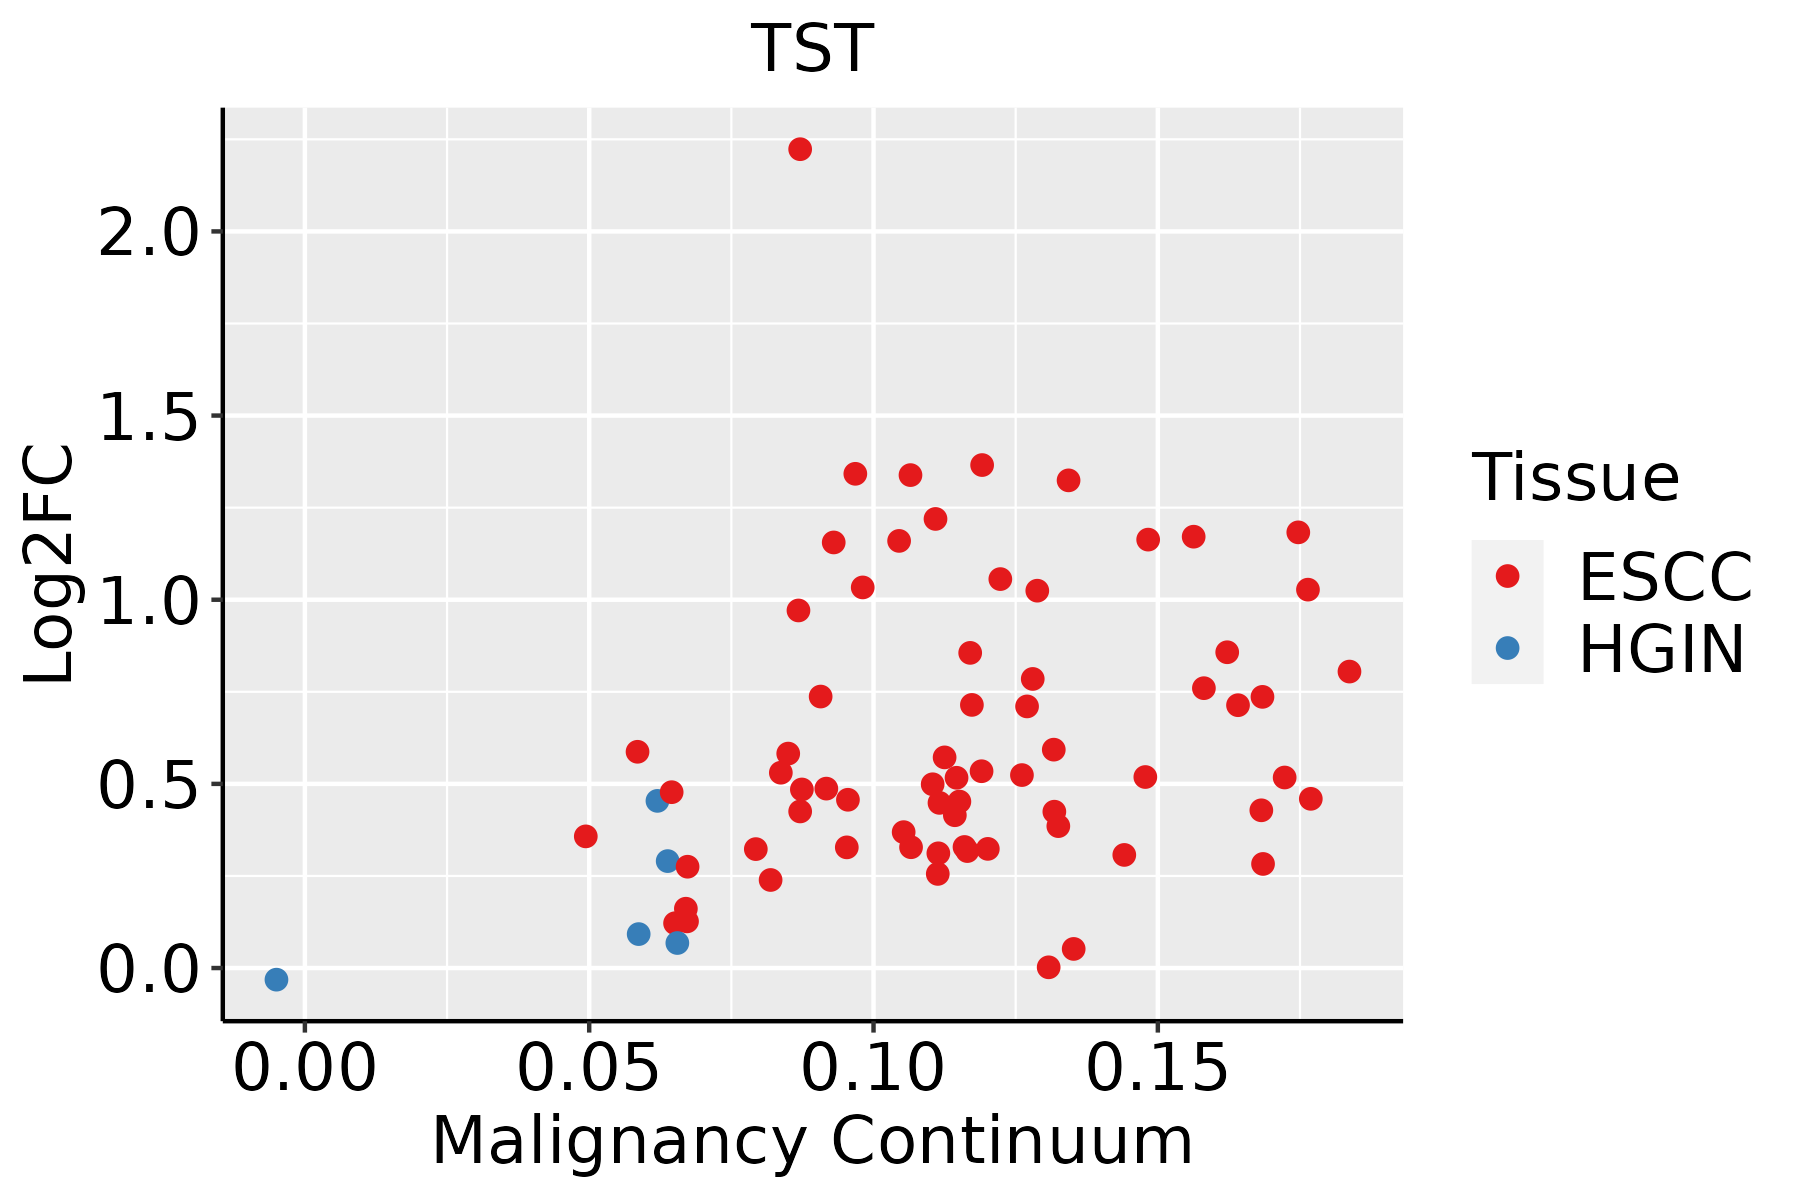 | ESCC: Esophageal squamous cell carcinoma |
| HGIN: High-grade intraepithelial neoplasias | ||
| LGIN: Low-grade intraepithelial neoplasias | ||
| Liver |  | HCC: Hepatocellular carcinoma |
| NAFLD: Non-alcoholic fatty liver disease | ||
| Oral Cavity | 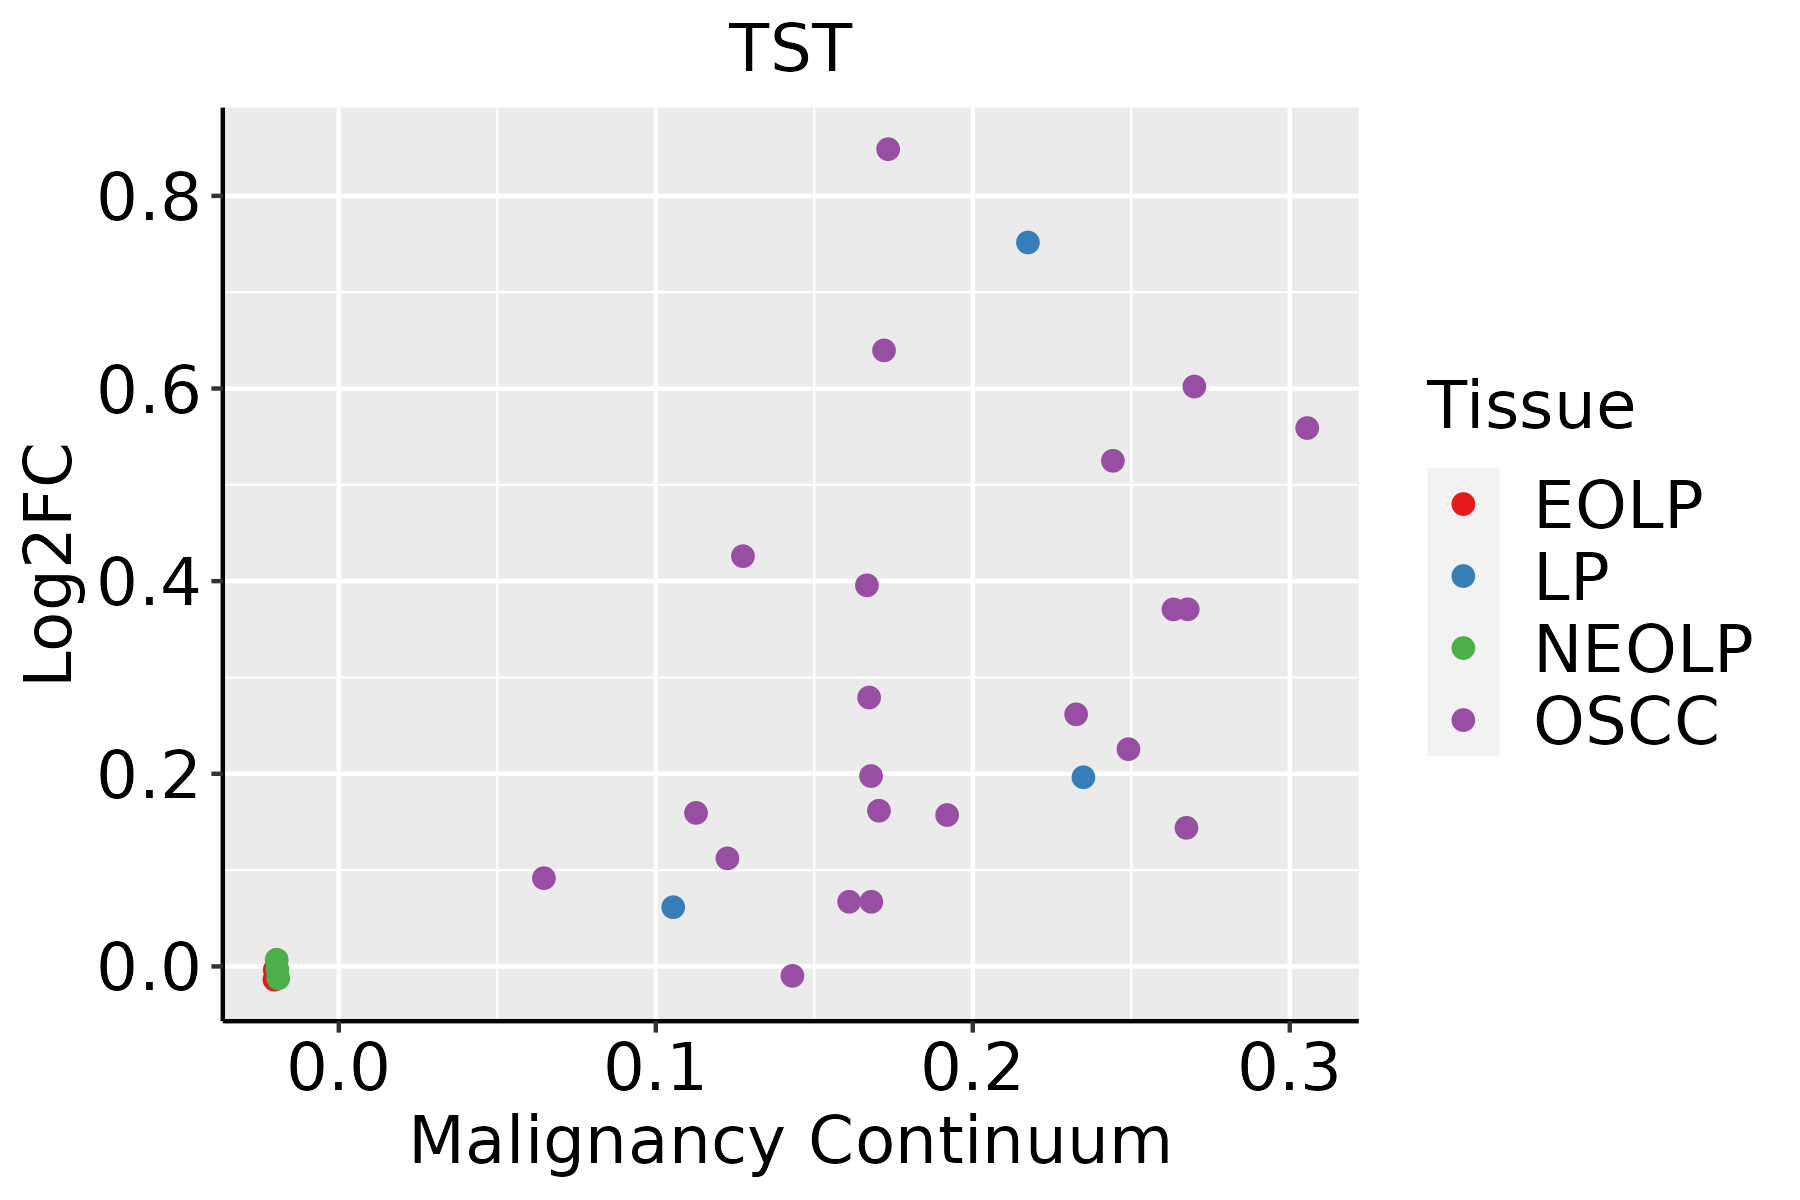 | EOLP: Erosive Oral lichen planus |
| LP: leukoplakia | ||
| NEOLP: Non-erosive oral lichen planus | ||
| OSCC: Oral squamous cell carcinoma |
| ∗log2FC in expression of this searched gene in stem-like cells from each diseased tissue sample relative to stem-like cells in normal samples in each tissue plotted against the malignancy continuum. Samples are colored based on if they are from different disease stage. |
Top |
Malignant transformation related pathway analysis |
| Find out the enriched GO biological processes and KEGG pathways involved in transition from healthy to precancer to cancer |
| Tissue | Disease Stage | Enriched GO biological Processes |
| Colorectum | AD |  |
| Colorectum | SER |  |
| Colorectum | MSS |  |
| Colorectum | MSI-H |  |
| Colorectum | FAP |  |
| ∗Top 15 enriched GO BP terms are showed in the bar plot of each disease state in each tissue. Each row represents a significant GO biological process which is colored according to the -log10(p.adjust). |
| Page: 1 2 3 4 5 6 7 8 9 |
| GO ID | Tissue | Disease Stage | Description | Gene Ratio | Bg Ratio | pvalue | p.adjust | Count |
| GO:19905425 | Liver | Cirrhotic | mitochondrial transmembrane transport | 41/4634 | 102/18723 | 4.08e-04 | 3.37e-03 | 41 |
| GO:004427021 | Liver | HCC | cellular nitrogen compound catabolic process | 303/7958 | 451/18723 | 9.76e-27 | 3.64e-24 | 303 |
| GO:000683912 | Liver | HCC | mitochondrial transport | 184/7958 | 254/18723 | 2.30e-22 | 3.83e-20 | 184 |
| GO:000640321 | Liver | HCC | RNA localization | 151/7958 | 201/18723 | 3.72e-21 | 5.89e-19 | 151 |
| GO:005123621 | Liver | HCC | establishment of RNA localization | 121/7958 | 166/18723 | 1.61e-15 | 1.19e-13 | 121 |
| GO:005065711 | Liver | HCC | nucleic acid transport | 118/7958 | 163/18723 | 8.30e-15 | 5.60e-13 | 118 |
| GO:005065811 | Liver | HCC | RNA transport | 118/7958 | 163/18723 | 8.30e-15 | 5.60e-13 | 118 |
| GO:001593111 | Liver | HCC | nucleobase-containing compound transport | 150/7958 | 222/18723 | 3.17e-14 | 2.03e-12 | 150 |
| GO:000679021 | Liver | HCC | sulfur compound metabolic process | 212/7958 | 339/18723 | 5.60e-14 | 3.39e-12 | 212 |
| GO:199054212 | Liver | HCC | mitochondrial transmembrane transport | 78/7958 | 102/18723 | 2.73e-12 | 1.26e-10 | 78 |
| GO:004428221 | Liver | HCC | small molecule catabolic process | 225/7958 | 376/18723 | 6.50e-12 | 2.80e-10 | 225 |
| GO:001605421 | Liver | HCC | organic acid catabolic process | 152/7958 | 240/18723 | 5.11e-11 | 1.92e-09 | 152 |
| GO:19016052 | Liver | HCC | alpha-amino acid metabolic process | 124/7958 | 195/18723 | 2.07e-09 | 5.79e-08 | 124 |
| GO:00065202 | Liver | HCC | cellular amino acid metabolic process | 167/7958 | 284/18723 | 1.91e-08 | 4.56e-07 | 167 |
| GO:00000962 | Liver | HCC | sulfur amino acid metabolic process | 29/7958 | 34/18723 | 3.26e-07 | 5.62e-06 | 29 |
| GO:00090692 | Liver | HCC | serine family amino acid metabolic process | 29/7958 | 40/18723 | 1.17e-04 | 9.87e-04 | 29 |
| GO:00065341 | Liver | HCC | cysteine metabolic process | 10/7958 | 12/18723 | 4.79e-03 | 2.02e-02 | 10 |
| GO:0050667 | Liver | HCC | homocysteine metabolic process | 11/7958 | 14/18723 | 6.81e-03 | 2.73e-02 | 11 |
| GO:000640318 | Oral cavity | OSCC | RNA localization | 150/7305 | 201/18723 | 6.90e-25 | 1.98e-22 | 150 |
| GO:005065714 | Oral cavity | OSCC | nucleic acid transport | 120/7305 | 163/18723 | 2.31e-19 | 3.18e-17 | 120 |
| Page: 1 2 3 4 5 6 |
| Pathway ID | Tissue | Disease Stage | Description | Gene Ratio | Bg Ratio | pvalue | p.adjust | qvalue | Count |
| hsa00920 | Colorectum | AD | Sulfur metabolism | 8/2092 | 10/8465 | 3.78e-04 | 2.82e-03 | 1.80e-03 | 8 |
| hsa009201 | Colorectum | AD | Sulfur metabolism | 8/2092 | 10/8465 | 3.78e-04 | 2.82e-03 | 1.80e-03 | 8 |
| hsa009202 | Colorectum | SER | Sulfur metabolism | 8/1580 | 10/8465 | 4.56e-05 | 5.22e-04 | 3.79e-04 | 8 |
| hsa009203 | Colorectum | SER | Sulfur metabolism | 8/1580 | 10/8465 | 4.56e-05 | 5.22e-04 | 3.79e-04 | 8 |
| hsa009204 | Colorectum | MSS | Sulfur metabolism | 6/1875 | 10/8465 | 1.07e-02 | 3.74e-02 | 2.29e-02 | 6 |
| hsa009205 | Colorectum | MSS | Sulfur metabolism | 6/1875 | 10/8465 | 1.07e-02 | 3.74e-02 | 2.29e-02 | 6 |
| hsa0092010 | Esophagus | ESCC | Sulfur metabolism | 9/4205 | 10/8465 | 1.01e-02 | 2.38e-02 | 1.22e-02 | 9 |
| hsa0092011 | Esophagus | ESCC | Sulfur metabolism | 9/4205 | 10/8465 | 1.01e-02 | 2.38e-02 | 1.22e-02 | 9 |
| hsa00270 | Liver | Cirrhotic | Cysteine and methionine metabolism | 27/2530 | 52/8465 | 6.98e-04 | 4.15e-03 | 2.56e-03 | 27 |
| hsa002701 | Liver | Cirrhotic | Cysteine and methionine metabolism | 27/2530 | 52/8465 | 6.98e-04 | 4.15e-03 | 2.56e-03 | 27 |
| hsa002702 | Liver | HCC | Cysteine and methionine metabolism | 35/4020 | 52/8465 | 3.03e-03 | 9.94e-03 | 5.53e-03 | 35 |
| hsa002703 | Liver | HCC | Cysteine and methionine metabolism | 35/4020 | 52/8465 | 3.03e-03 | 9.94e-03 | 5.53e-03 | 35 |
| Page: 1 |
Top |
Cell-cell communication analysis |
| Identification of potential cell-cell interactions between two cell types and their ligand-receptor pairs for different disease states |
| Ligand | Receptor | LRpair | Pathway | Tissue | Disease Stage |
| Page: 1 |
Top |
Single-cell gene regulatory network inference analysis |
| Find out the significant the regulons (TFs) and the target genes of each regulon across cell types for different disease states |
| TF | Cell Type | Tissue | Disease Stage | Target Gene | RSS | Regulon Activity |
| ∗The dot plots of a searched regulon are shown for all cell subpopulations in each disease state of each tissue based on the regulon specific score inferred using pySCENIC and by calculating the average expression. |
| Page: 1 |
Top |
Somatic mutation of malignant transformation related genes |
| Annotation of somatic variants for genes involved in malignant transformation |
| Hugo Symbol | Variant Class | Variant Classification | dbSNP RS | HGVSc | HGVSp | HGVSp Short | SWISSPROT | BIOTYPE | SIFT | PolyPhen | Tumor Sample Barcode | Tissue | Histology | Sex | Age | Stage | Therapy Types | Drugs | Outcome |
| TST | SNV | Missense_Mutation | c.682N>A | p.Glu228Lys | p.E228K | Q16762 | protein_coding | tolerated(0.11) | benign(0.022) | TCGA-C5-A1BQ-01 | Cervix | cervical & endocervical cancer | Female | >=65 | III/IV | Chemotherapy | cisplatin | CR | |
| TST | SNV | Missense_Mutation | c.178N>C | p.Asp60His | p.D60H | Q16762 | protein_coding | deleterious(0) | probably_damaging(0.986) | TCGA-C5-A1MK-01 | Cervix | cervical & endocervical cancer | Female | >=65 | III/IV | Chemotherapy | carboplatin | PD | |
| TST | SNV | Missense_Mutation | novel | c.113N>T | p.Ser38Leu | p.S38L | Q16762 | protein_coding | tolerated(1) | benign(0) | TCGA-EA-A3Y4-01 | Cervix | cervical & endocervical cancer | Female | <65 | I/II | Unknown | Unknown | SD |
| TST | SNV | Missense_Mutation | rs148918180 | c.862C>T | p.Arg288Cys | p.R288C | Q16762 | protein_coding | tolerated(0.14) | benign(0.39) | TCGA-AA-A01R-01 | Colorectum | colon adenocarcinoma | Male | <65 | III/IV | Chemotherapy | 5-fluorouracil | PD |
| TST | SNV | Missense_Mutation | c.506N>G | p.Leu169Arg | p.L169R | Q16762 | protein_coding | tolerated(0.49) | benign(0.02) | TCGA-NH-A5IV-01 | Colorectum | colon adenocarcinoma | Female | >=65 | I/II | Unknown | Unknown | SD | |
| TST | SNV | Missense_Mutation | novel | c.311T>C | p.Leu104Pro | p.L104P | Q16762 | protein_coding | tolerated(0.15) | benign(0.123) | TCGA-AJ-A23O-01 | Endometrium | uterine corpus endometrioid carcinoma | Female | >=65 | I/II | Unknown | Unknown | SD |
| TST | SNV | Missense_Mutation | novel | c.467C>T | p.Thr156Ile | p.T156I | Q16762 | protein_coding | deleterious(0.02) | benign(0.025) | TCGA-AJ-A2QO-01 | Endometrium | uterine corpus endometrioid carcinoma | Female | >=65 | I/II | Unknown | Unknown | SD |
| TST | SNV | Missense_Mutation | novel | c.510N>T | p.Glu170Asp | p.E170D | Q16762 | protein_coding | tolerated(0.31) | benign(0.003) | TCGA-AP-A1DV-01 | Endometrium | uterine corpus endometrioid carcinoma | Female | <65 | I/II | Unknown | Unknown | SD |
| TST | SNV | Missense_Mutation | c.321N>A | p.Phe107Leu | p.F107L | Q16762 | protein_coding | tolerated(0.06) | benign(0.035) | TCGA-BS-A0UF-01 | Endometrium | uterine corpus endometrioid carcinoma | Female | >=65 | I/II | Unknown | Unknown | SD | |
| TST | SNV | Missense_Mutation | c.708N>T | p.Lys236Asn | p.K236N | Q16762 | protein_coding | tolerated(0.11) | benign(0.054) | TCGA-D1-A16X-01 | Endometrium | uterine corpus endometrioid carcinoma | Female | <65 | I/II | Unknown | Unknown | SD |
| Page: 1 2 |
Top |
Related drugs of malignant transformation related genes |
| Identification of chemicals and drugs interact with genes involved in malignant transfromation |
| (DGIdb 4.0) |
| Entrez ID | Symbol | Category | Interaction Types | Drug Claim Name | Drug Name | PMIDs |
| Page: 1 |

Copyright 2023-Present -The University of Texas Health Science Center at Houston |