
|
|||||
|
 | |
| |
| |
| |
| |
| |
|
Gene: TRIM8 |
Gene summary for TRIM8 |
| Gene information | Species | Human | Gene symbol | TRIM8 | Gene ID | 81603 |
| Gene name | tripartite motif containing 8 | |
| Gene Alias | FSGSNEDS | |
| Cytomap | 10q24.32 | |
| Gene Type | protein-coding | GO ID | GO:0002376 | UniProtAcc | Q9BZR9 |
Top |
Malignant transformation analysis |
| Identification of the aberrant gene expression in precancerous and cancerous lesions by comparing the gene expression of stem-like cells in diseased tissues with normal stem cells |
| Entrez ID | Symbol | Replicates | Species | Organ | Tissue | Adj P-value | Log2FC | Malignancy |
| 81603 | TRIM8 | HCC1_Meng | Human | Liver | HCC | 3.88e-34 | -4.54e-02 | 0.0246 |
| 81603 | TRIM8 | HCC2_Meng | Human | Liver | HCC | 6.44e-27 | 1.14e-01 | 0.0107 |
| 81603 | TRIM8 | HCC1 | Human | Liver | HCC | 1.52e-14 | 4.61e+00 | 0.5336 |
| 81603 | TRIM8 | HCC2 | Human | Liver | HCC | 1.28e-36 | 4.98e+00 | 0.5341 |
| 81603 | TRIM8 | S014 | Human | Liver | HCC | 2.65e-25 | 1.37e+00 | 0.2254 |
| 81603 | TRIM8 | S015 | Human | Liver | HCC | 3.97e-15 | 1.27e+00 | 0.2375 |
| 81603 | TRIM8 | S016 | Human | Liver | HCC | 8.82e-28 | 1.26e+00 | 0.2243 |
| 81603 | TRIM8 | S027 | Human | Liver | HCC | 3.00e-13 | 1.44e+00 | 0.2446 |
| 81603 | TRIM8 | S028 | Human | Liver | HCC | 2.72e-30 | 1.57e+00 | 0.2503 |
| 81603 | TRIM8 | S029 | Human | Liver | HCC | 3.25e-24 | 1.44e+00 | 0.2581 |
| 81603 | TRIM8 | C04 | Human | Oral cavity | OSCC | 4.01e-09 | 5.82e-01 | 0.2633 |
| 81603 | TRIM8 | C21 | Human | Oral cavity | OSCC | 1.26e-02 | 3.55e-01 | 0.2678 |
| 81603 | TRIM8 | C30 | Human | Oral cavity | OSCC | 4.45e-19 | 9.69e-01 | 0.3055 |
| 81603 | TRIM8 | C38 | Human | Oral cavity | OSCC | 5.54e-08 | 7.62e-01 | 0.172 |
| 81603 | TRIM8 | C43 | Human | Oral cavity | OSCC | 7.29e-06 | 8.78e-02 | 0.1704 |
| 81603 | TRIM8 | C46 | Human | Oral cavity | OSCC | 2.73e-10 | 3.45e-01 | 0.1673 |
| 81603 | TRIM8 | C51 | Human | Oral cavity | OSCC | 8.18e-05 | 4.36e-01 | 0.2674 |
| 81603 | TRIM8 | C06 | Human | Oral cavity | OSCC | 5.62e-04 | 1.01e+00 | 0.2699 |
| 81603 | TRIM8 | C08 | Human | Oral cavity | OSCC | 1.22e-11 | 2.79e-01 | 0.1919 |
| 81603 | TRIM8 | C09 | Human | Oral cavity | OSCC | 1.34e-06 | 3.77e-01 | 0.1431 |
| Page: 1 2 3 |
| Tissue | Expression Dynamics | Abbreviation |
| Liver | 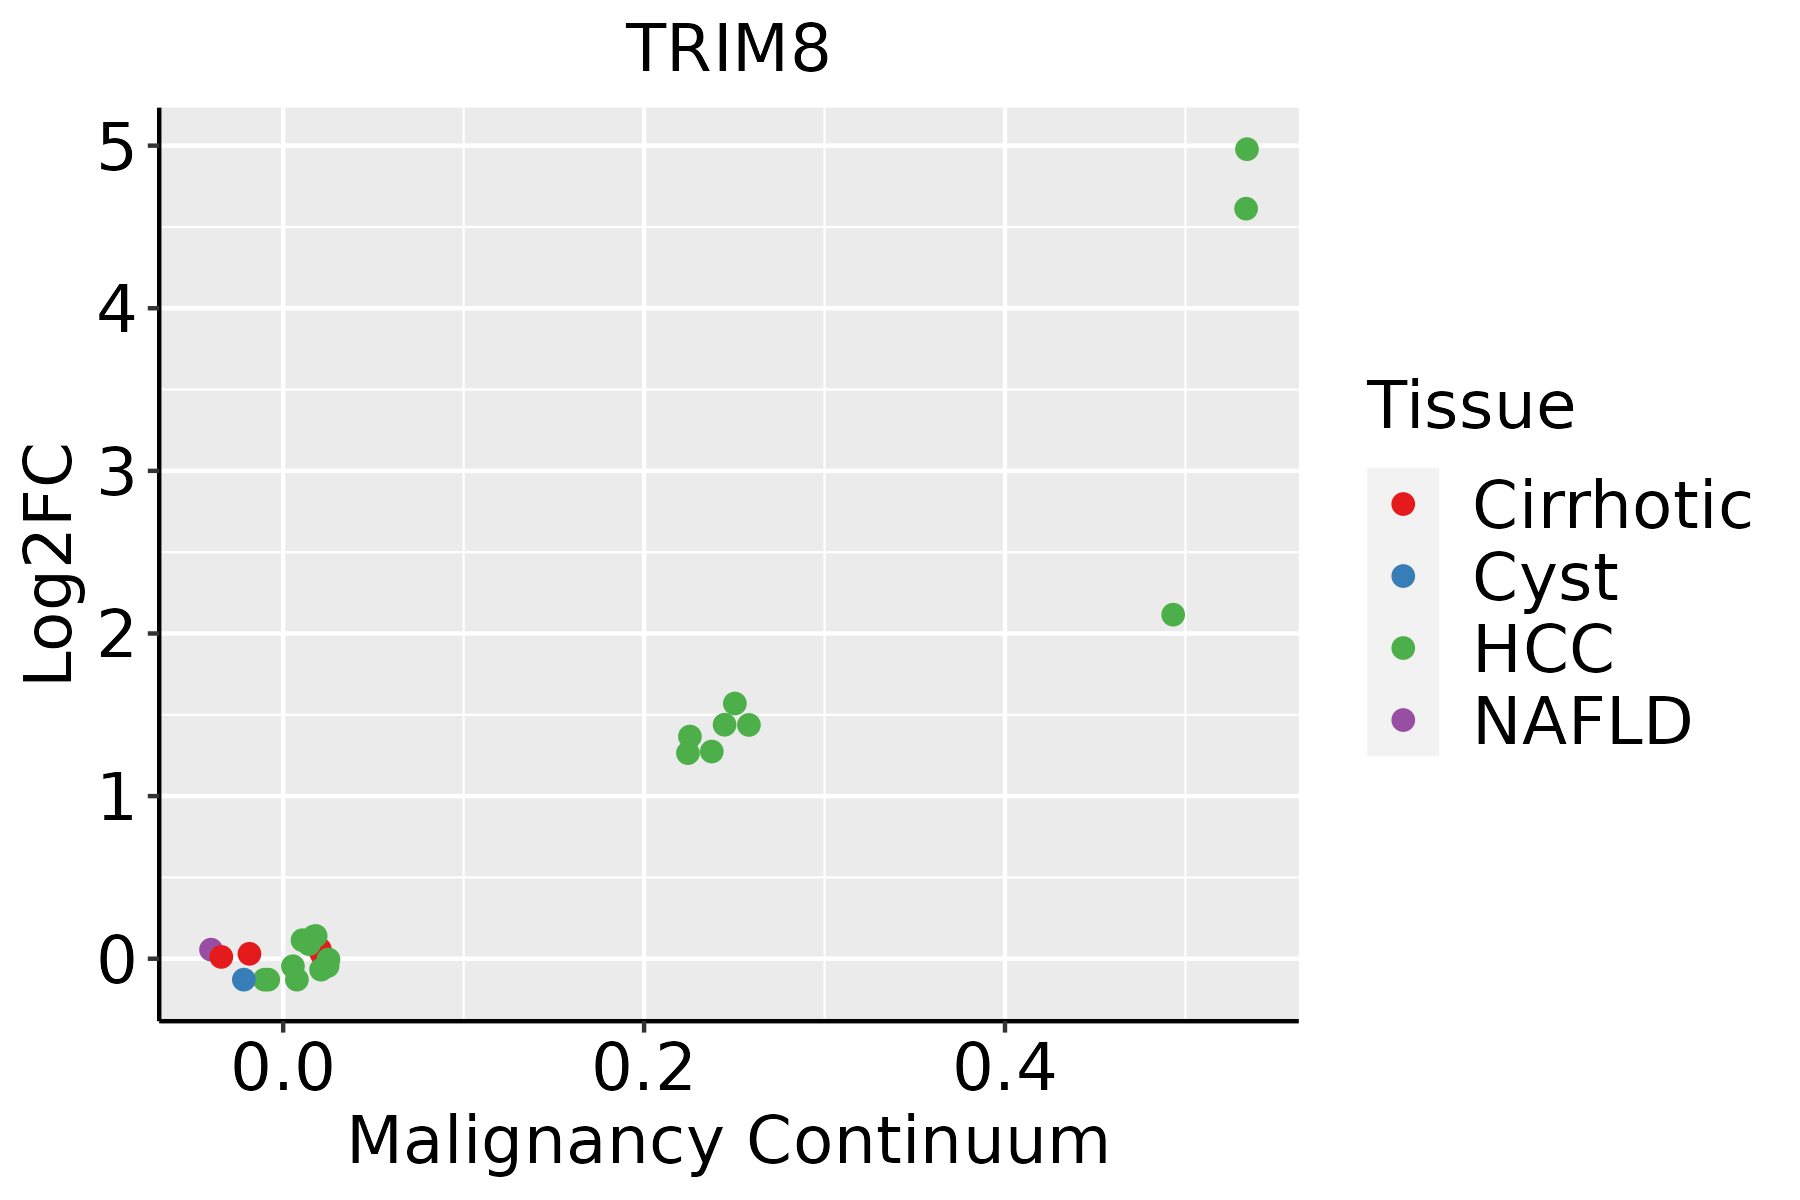 | HCC: Hepatocellular carcinoma |
| NAFLD: Non-alcoholic fatty liver disease | ||
| Oral Cavity | 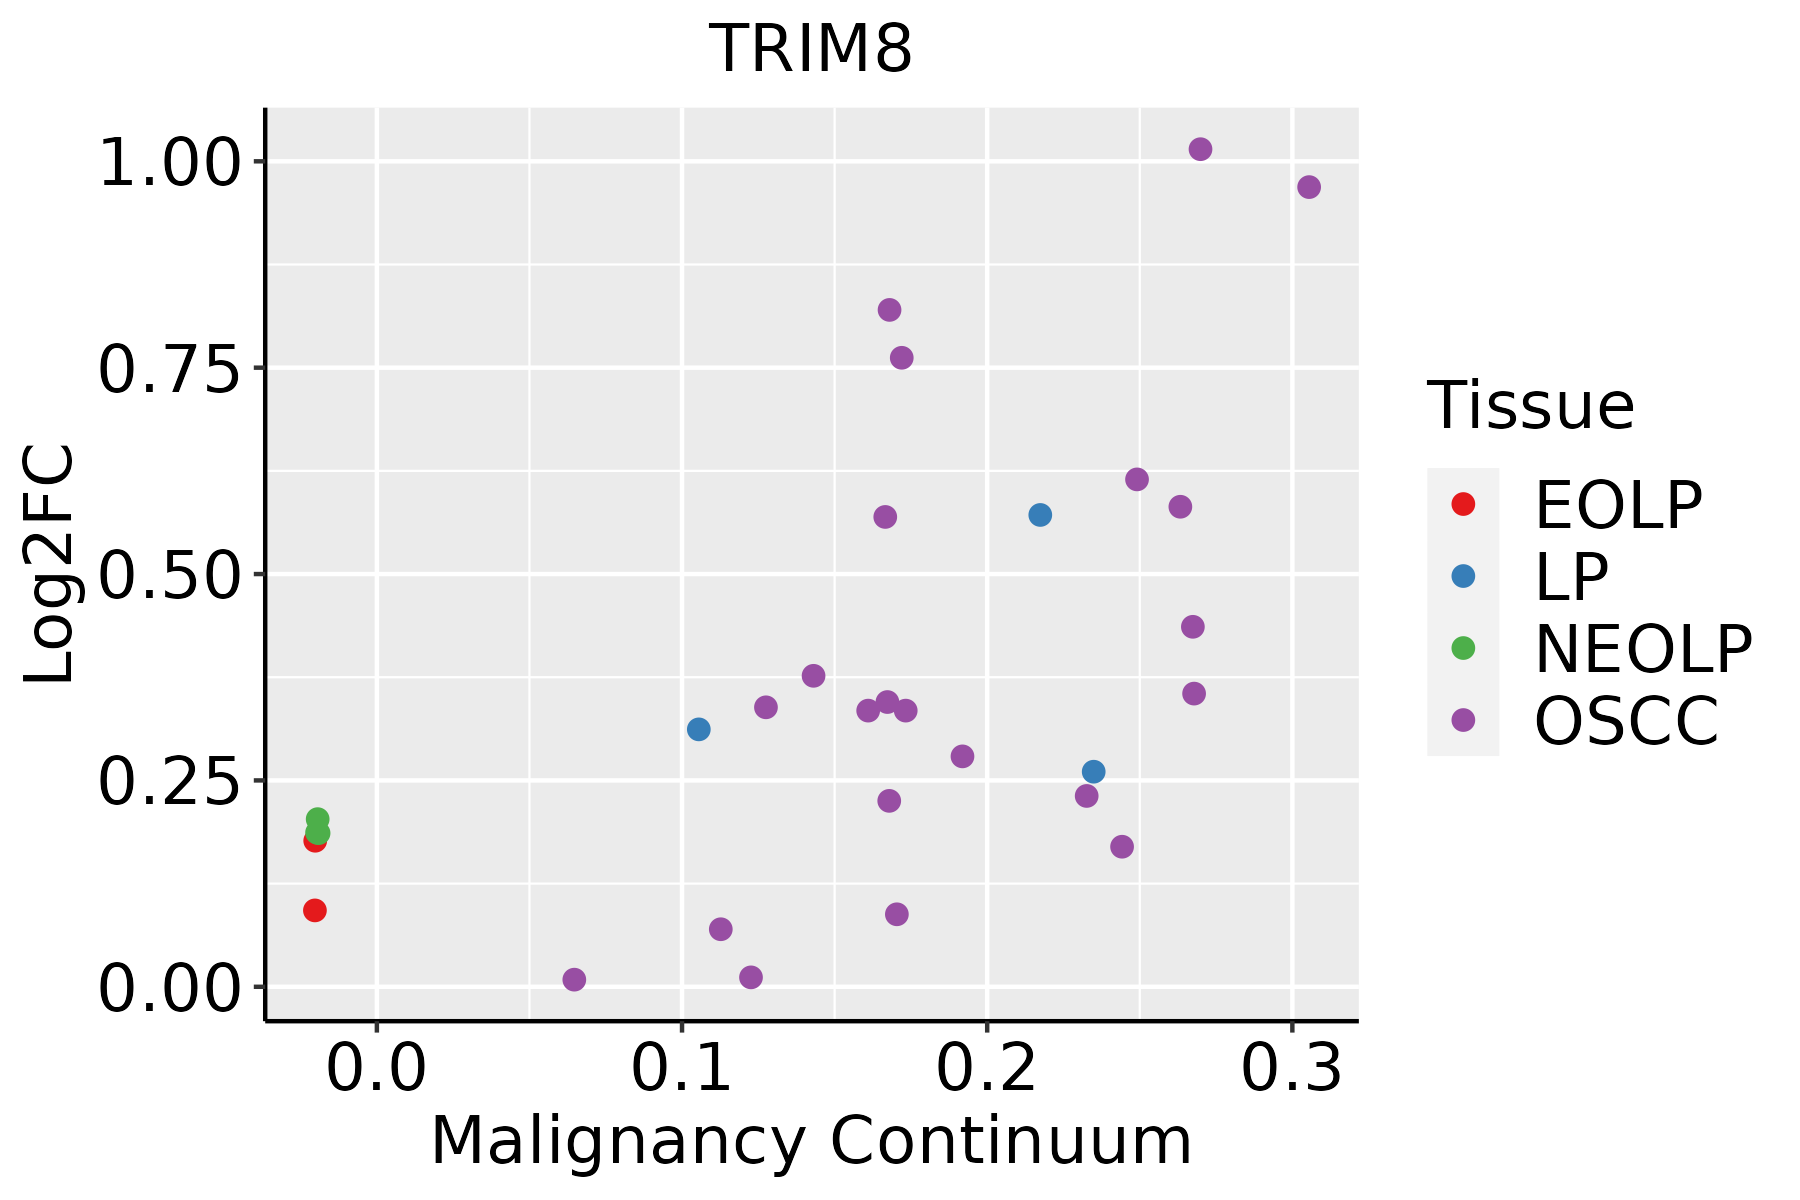 | EOLP: Erosive Oral lichen planus |
| LP: leukoplakia | ||
| NEOLP: Non-erosive oral lichen planus | ||
| OSCC: Oral squamous cell carcinoma | ||
| Prostate | 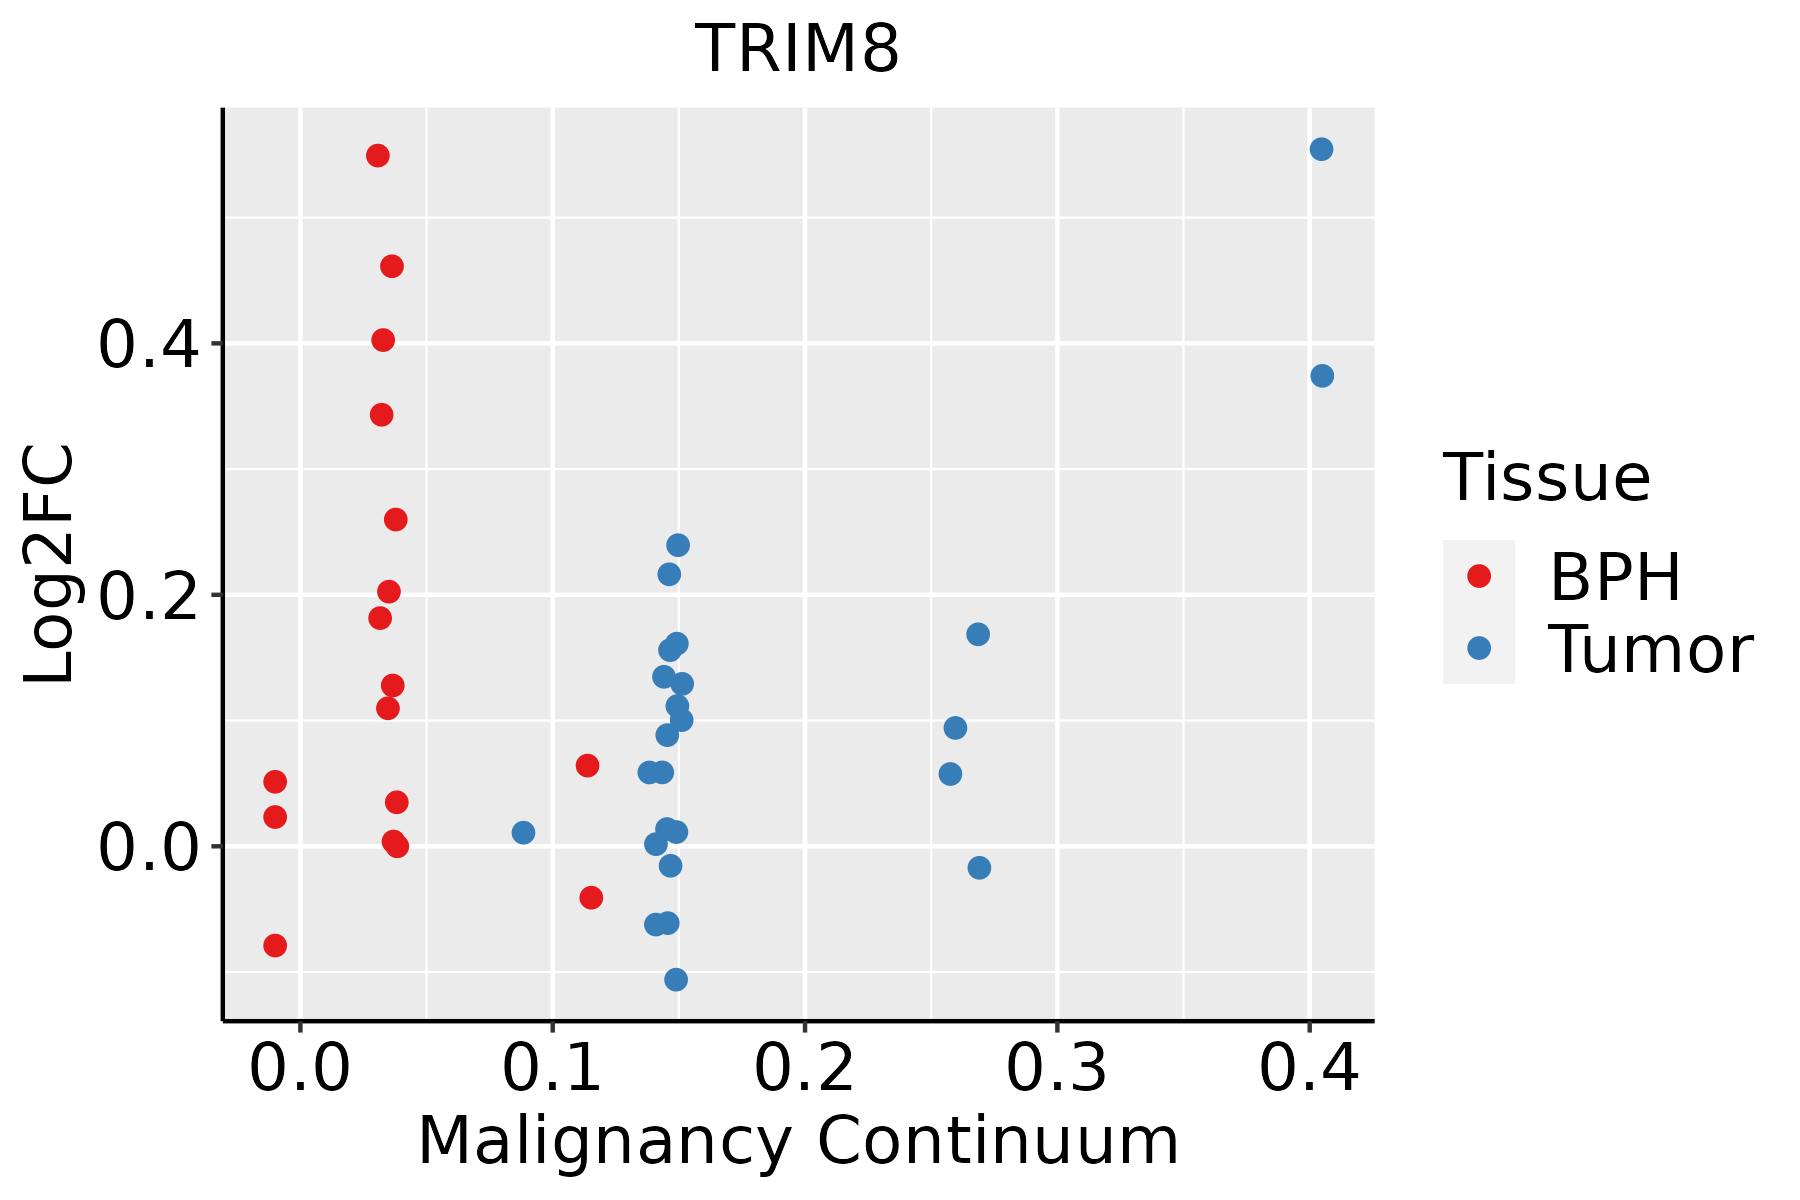 | BPH: Benign Prostatic Hyperplasia |
| Thyroid | 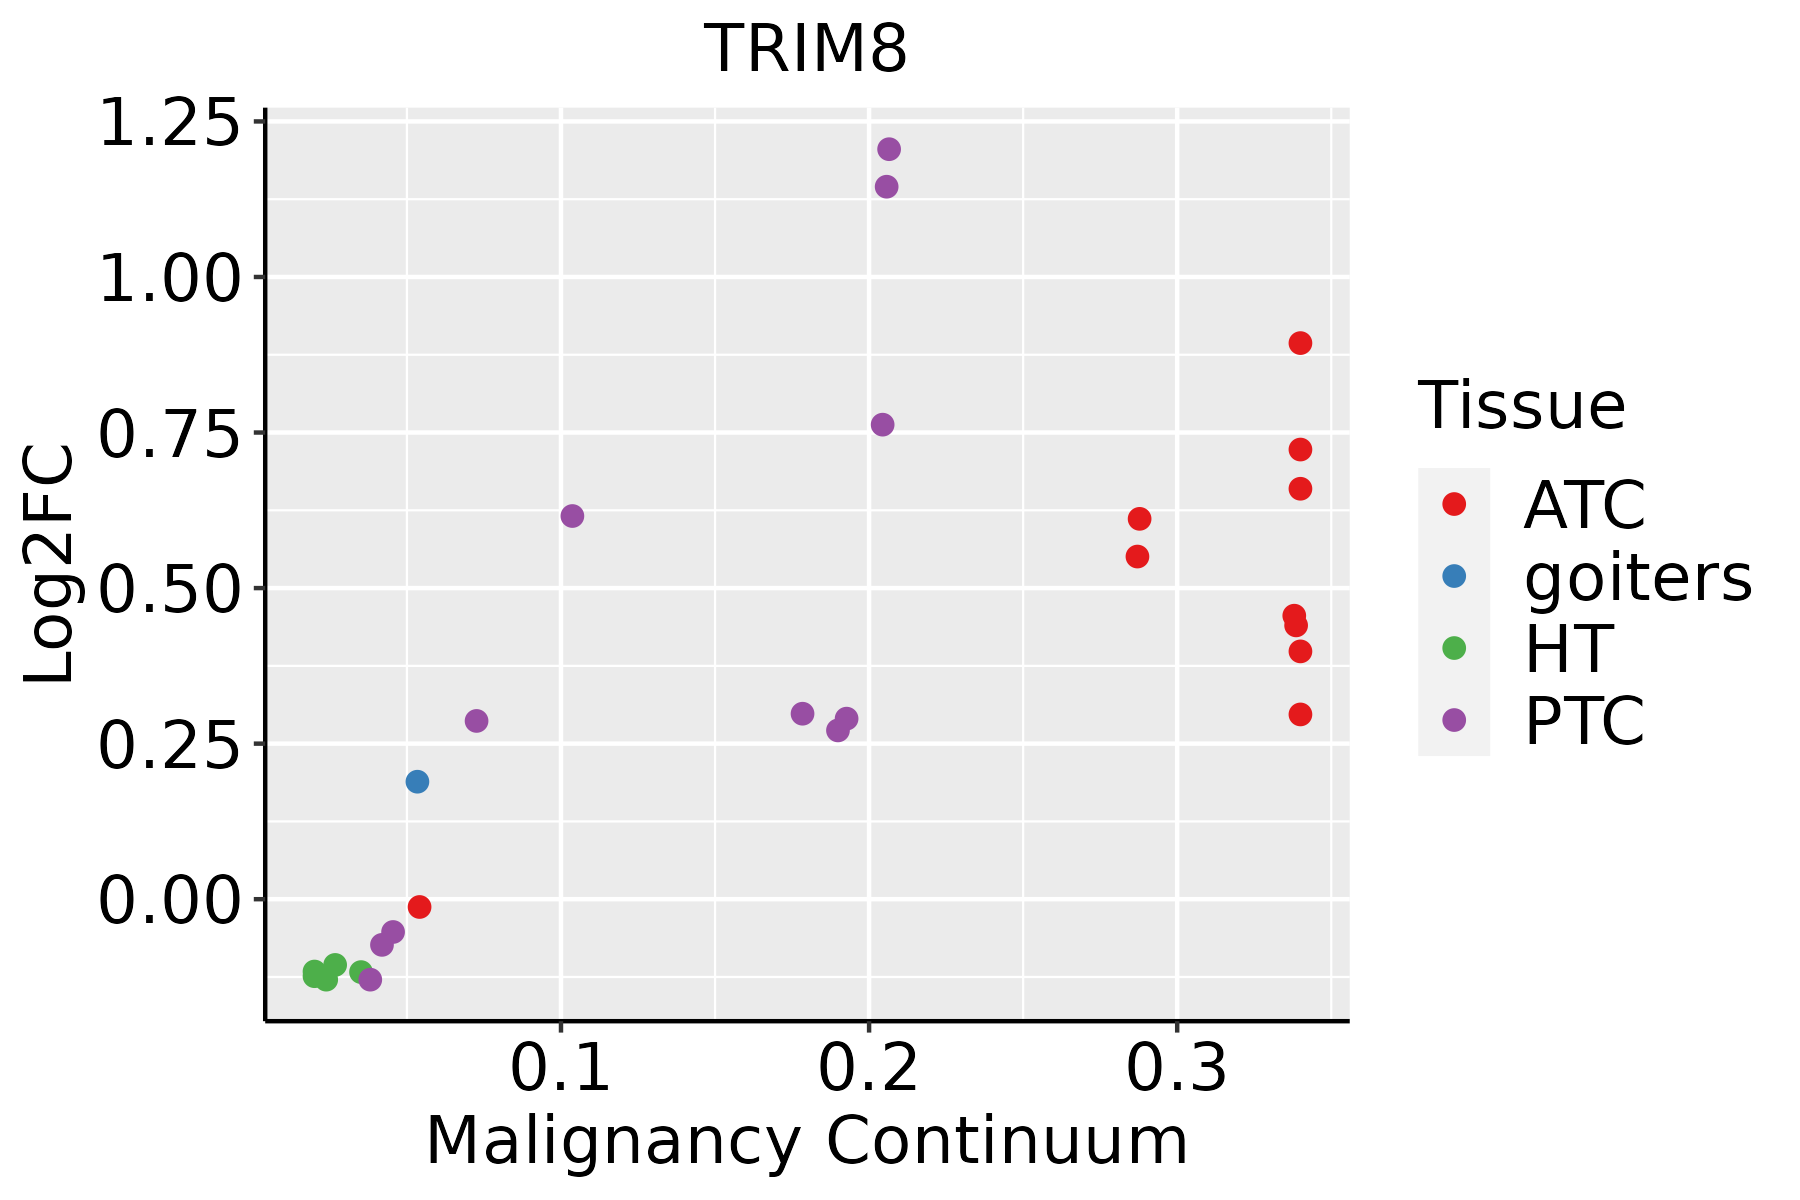 | ATC: Anaplastic thyroid cancer |
| HT: Hashimoto's thyroiditis | ||
| PTC: Papillary thyroid cancer |
| ∗log2FC in expression of this searched gene in stem-like cells from each diseased tissue sample relative to stem-like cells in normal samples in each tissue plotted against the malignancy continuum. Samples are colored based on if they are from different disease stage. |
Top |
Malignant transformation related pathway analysis |
| Find out the enriched GO biological processes and KEGG pathways involved in transition from healthy to precancer to cancer |
| Tissue | Disease Stage | Enriched GO biological Processes |
| Colorectum | AD |  |
| Colorectum | SER |  |
| Colorectum | MSS |  |
| Colorectum | MSI-H |  |
| Colorectum | FAP |  |
| ∗Top 15 enriched GO BP terms are showed in the bar plot of each disease state in each tissue. Each row represents a significant GO biological process which is colored according to the -log10(p.adjust). |
| Page: 1 2 3 4 5 6 7 8 9 |
| GO ID | Tissue | Disease Stage | Description | Gene Ratio | Bg Ratio | pvalue | p.adjust | Count |
| GO:001050821 | Oral cavity | EOLP | positive regulation of autophagy | 33/2218 | 124/18723 | 5.07e-06 | 1.03e-04 | 33 |
| GO:005079224 | Oral cavity | EOLP | regulation of viral process | 39/2218 | 164/18723 | 1.40e-05 | 2.35e-04 | 39 |
| GO:004312322 | Oral cavity | EOLP | positive regulation of I-kappaB kinase/NF-kappaB signaling | 42/2218 | 186/18723 | 2.54e-05 | 3.75e-04 | 42 |
| GO:005109021 | Oral cavity | EOLP | regulation of DNA-binding transcription factor activity | 80/2218 | 440/18723 | 5.77e-05 | 7.31e-04 | 80 |
| GO:004440325 | Oral cavity | EOLP | biological process involved in symbiotic interaction | 57/2218 | 290/18723 | 7.75e-05 | 9.39e-04 | 57 |
| GO:190390024 | Oral cavity | EOLP | regulation of viral life cycle | 32/2218 | 148/18723 | 5.04e-04 | 4.39e-03 | 32 |
| GO:190018021 | Oral cavity | EOLP | regulation of protein localization to nucleus | 30/2218 | 136/18723 | 5.23e-04 | 4.52e-03 | 30 |
| GO:005170126 | Oral cavity | EOLP | biological process involved in interaction with host | 40/2218 | 203/18723 | 8.05e-04 | 6.31e-03 | 40 |
| GO:004852522 | Oral cavity | EOLP | negative regulation of viral process | 22/2218 | 92/18723 | 9.05e-04 | 6.92e-03 | 22 |
| GO:190018221 | Oral cavity | EOLP | positive regulation of protein localization to nucleus | 21/2218 | 87/18723 | 1.03e-03 | 7.63e-03 | 21 |
| GO:001908022 | Oral cavity | EOLP | viral gene expression | 22/2218 | 94/18723 | 1.23e-03 | 8.84e-03 | 22 |
| GO:004440926 | Oral cavity | EOLP | entry into host | 31/2218 | 151/18723 | 1.50e-03 | 1.01e-02 | 31 |
| GO:19039017 | Oral cavity | EOLP | negative regulation of viral life cycle | 9/2218 | 25/18723 | 1.56e-03 | 1.05e-02 | 9 |
| GO:005212626 | Oral cavity | EOLP | movement in host environment | 34/2218 | 175/18723 | 2.43e-03 | 1.48e-02 | 34 |
| GO:004671826 | Oral cavity | EOLP | viral entry into host cell | 29/2218 | 144/18723 | 2.82e-03 | 1.68e-02 | 29 |
| GO:005109221 | Oral cavity | EOLP | positive regulation of NF-kappaB transcription factor activity | 29/2218 | 152/18723 | 6.29e-03 | 3.13e-02 | 29 |
| GO:00465972 | Oral cavity | EOLP | negative regulation of viral entry into host cell | 7/2218 | 21/18723 | 8.36e-03 | 3.91e-02 | 7 |
| GO:001603233 | Oral cavity | NEOLP | viral process | 101/2005 | 415/18723 | 1.08e-15 | 5.85e-13 | 101 |
| GO:000989633 | Oral cavity | NEOLP | positive regulation of catabolic process | 111/2005 | 492/18723 | 1.19e-14 | 4.72e-12 | 111 |
| GO:003133133 | Oral cavity | NEOLP | positive regulation of cellular catabolic process | 97/2005 | 427/18723 | 3.77e-13 | 1.07e-10 | 97 |
| Page: 1 2 3 4 5 6 7 8 9 10 11 12 13 |
| Pathway ID | Tissue | Disease Stage | Description | Gene Ratio | Bg Ratio | pvalue | p.adjust | qvalue | Count |
| Page: 1 |
Top |
Cell-cell communication analysis |
| Identification of potential cell-cell interactions between two cell types and their ligand-receptor pairs for different disease states |
| Ligand | Receptor | LRpair | Pathway | Tissue | Disease Stage |
| Page: 1 |
Top |
Single-cell gene regulatory network inference analysis |
| Find out the significant the regulons (TFs) and the target genes of each regulon across cell types for different disease states |
| TF | Cell Type | Tissue | Disease Stage | Target Gene | RSS | Regulon Activity |
| ∗The dot plots of a searched regulon are shown for all cell subpopulations in each disease state of each tissue based on the regulon specific score inferred using pySCENIC and by calculating the average expression. |
| Page: 1 |
Top |
Somatic mutation of malignant transformation related genes |
| Annotation of somatic variants for genes involved in malignant transformation |
| Hugo Symbol | Variant Class | Variant Classification | dbSNP RS | HGVSc | HGVSp | HGVSp Short | SWISSPROT | BIOTYPE | SIFT | PolyPhen | Tumor Sample Barcode | Tissue | Histology | Sex | Age | Stage | Therapy Types | Drugs | Outcome |
| TRIM8 | SNV | Missense_Mutation | novel | c.1217N>T | p.Ala406Val | p.A406V | Q9BZR9 | protein_coding | tolerated_low_confidence(0.28) | benign(0.038) | TCGA-5M-AAT6-01 | Colorectum | colon adenocarcinoma | Female | <65 | III/IV | Unknown | Unknown | PD |
| TRIM8 | SNV | Missense_Mutation | rs747235303 | c.595C>T | p.Arg199Trp | p.R199W | Q9BZR9 | protein_coding | deleterious(0) | probably_damaging(0.988) | TCGA-A6-6781-01 | Colorectum | colon adenocarcinoma | Male | <65 | III/IV | Chemotherapy | oxaliplatin | SD |
| TRIM8 | SNV | Missense_Mutation | novel | c.697N>T | p.Arg233Trp | p.R233W | Q9BZR9 | protein_coding | deleterious(0) | possibly_damaging(0.642) | TCGA-AA-A00N-01 | Colorectum | colon adenocarcinoma | Male | >=65 | I/II | Unknown | Unknown | PD |
| TRIM8 | SNV | Missense_Mutation | c.1157N>T | p.Ala386Val | p.A386V | Q9BZR9 | protein_coding | deleterious_low_confidence(0.03) | benign(0.068) | TCGA-CK-4951-01 | Colorectum | colon adenocarcinoma | Female | >=65 | I/II | Unknown | Unknown | PD | |
| TRIM8 | SNV | Missense_Mutation | rs772676859 | c.1534N>A | p.Val512Ile | p.V512I | Q9BZR9 | protein_coding | tolerated_low_confidence(0.09) | benign(0.147) | TCGA-D5-6928-01 | Colorectum | colon adenocarcinoma | Male | >=65 | I/II | Unknown | Unknown | SD |
| TRIM8 | SNV | Missense_Mutation | rs751046151 | c.1142C>T | p.Thr381Met | p.T381M | Q9BZR9 | protein_coding | tolerated_low_confidence(0.37) | benign(0) | TCGA-WS-AB45-01 | Colorectum | colon adenocarcinoma | Female | <65 | I/II | Unknown | Unknown | SD |
| TRIM8 | SNV | Missense_Mutation | novel | c.862N>A | p.Leu288Met | p.L288M | Q9BZR9 | protein_coding | tolerated(0.26) | benign(0.001) | TCGA-A5-A0G1-01 | Endometrium | uterine corpus endometrioid carcinoma | Female | >=65 | I/II | Unknown | Unknown | SD |
| TRIM8 | SNV | Missense_Mutation | novel | c.775N>A | p.Ala259Thr | p.A259T | Q9BZR9 | protein_coding | tolerated(0.4) | benign(0.013) | TCGA-A5-A1OF-01 | Endometrium | uterine corpus endometrioid carcinoma | Female | <65 | I/II | Unknown | Unknown | SD |
| TRIM8 | SNV | Missense_Mutation | novel | c.325N>T | p.Arg109Cys | p.R109C | Q9BZR9 | protein_coding | deleterious(0) | probably_damaging(0.996) | TCGA-AJ-A2QO-01 | Endometrium | uterine corpus endometrioid carcinoma | Female | >=65 | I/II | Unknown | Unknown | SD |
| TRIM8 | SNV | Missense_Mutation | rs753886521 | c.878N>T | p.Thr293Met | p.T293M | Q9BZR9 | protein_coding | deleterious(0.01) | possibly_damaging(0.572) | TCGA-AJ-A8CW-01 | Endometrium | uterine corpus endometrioid carcinoma | Female | <65 | I/II | Unknown | Unknown | SD |
| Page: 1 2 3 4 |
Top |
Related drugs of malignant transformation related genes |
| Identification of chemicals and drugs interact with genes involved in malignant transfromation |
| (DGIdb 4.0) |
| Entrez ID | Symbol | Category | Interaction Types | Drug Claim Name | Drug Name | PMIDs |
| Page: 1 |

Copyright 2023-Present -The University of Texas Health Science Center at Houston |