
|
|||||
|
 | |
| |
| |
| |
| |
| |
|
Gene: TPBG |
Gene summary for TPBG |
| Gene information | Species | Human | Gene symbol | TPBG | Gene ID | 7162 |
| Gene name | trophoblast glycoprotein | |
| Gene Alias | 5T4 | |
| Cytomap | 6q14.1 | |
| Gene Type | protein-coding | GO ID | GO:0000165 | UniProtAcc | Q13641 |
Top |
Malignant transformation analysis |
| Identification of the aberrant gene expression in precancerous and cancerous lesions by comparing the gene expression of stem-like cells in diseased tissues with normal stem cells |
| Entrez ID | Symbol | Replicates | Species | Organ | Tissue | Adj P-value | Log2FC | Malignancy |
| 7162 | TPBG | CA_HPV_1 | Human | Cervix | CC | 4.13e-06 | -1.81e-01 | 0.0264 |
| 7162 | TPBG | Tumor | Human | Cervix | CC | 3.60e-08 | 3.67e-01 | 0.1241 |
| 7162 | TPBG | sample3 | Human | Cervix | CC | 1.18e-28 | 5.35e-01 | 0.1387 |
| 7162 | TPBG | T1 | Human | Cervix | CC | 9.41e-03 | 2.32e-01 | 0.0918 |
| 7162 | TPBG | T2 | Human | Cervix | CC | 8.51e-05 | 4.18e-01 | 0.0709 |
| 7162 | TPBG | T3 | Human | Cervix | CC | 7.66e-23 | 5.21e-01 | 0.1389 |
| 7162 | TPBG | AEH-subject1 | Human | Endometrium | AEH | 1.71e-04 | -3.12e-01 | -0.3059 |
| 7162 | TPBG | AEH-subject2 | Human | Endometrium | AEH | 6.46e-09 | -3.19e-01 | -0.2525 |
| 7162 | TPBG | AEH-subject3 | Human | Endometrium | AEH | 6.10e-09 | -3.88e-01 | -0.2576 |
| 7162 | TPBG | AEH-subject4 | Human | Endometrium | AEH | 5.98e-07 | -3.61e-01 | -0.2657 |
| 7162 | TPBG | AEH-subject5 | Human | Endometrium | AEH | 2.77e-10 | -4.41e-01 | -0.2953 |
| 7162 | TPBG | EEC-subject1 | Human | Endometrium | EEC | 1.14e-14 | -3.72e-01 | -0.2682 |
| 7162 | TPBG | EEC-subject2 | Human | Endometrium | EEC | 6.51e-12 | -4.10e-01 | -0.2607 |
| 7162 | TPBG | EEC-subject3 | Human | Endometrium | EEC | 4.98e-17 | -3.94e-01 | -0.2525 |
| 7162 | TPBG | EEC-subject4 | Human | Endometrium | EEC | 2.97e-05 | -3.55e-01 | -0.2571 |
| 7162 | TPBG | EEC-subject5 | Human | Endometrium | EEC | 2.25e-09 | -3.87e-01 | -0.249 |
| 7162 | TPBG | GSM5276934 | Human | Endometrium | EEC | 1.23e-02 | -1.27e-01 | -0.0913 |
| 7162 | TPBG | GSM5276935 | Human | Endometrium | EEC | 7.46e-07 | -3.45e-01 | -0.123 |
| 7162 | TPBG | GSM6177620_NYU_UCEC1_lib1_lib1 | Human | Endometrium | EEC | 2.52e-22 | -4.23e-01 | -0.1869 |
| 7162 | TPBG | GSM6177620_NYU_UCEC1_lib2_lib2 | Human | Endometrium | EEC | 1.01e-20 | -4.16e-01 | -0.1875 |
| Page: 1 2 3 4 5 6 7 |
| Tissue | Expression Dynamics | Abbreviation |
| Cervix | 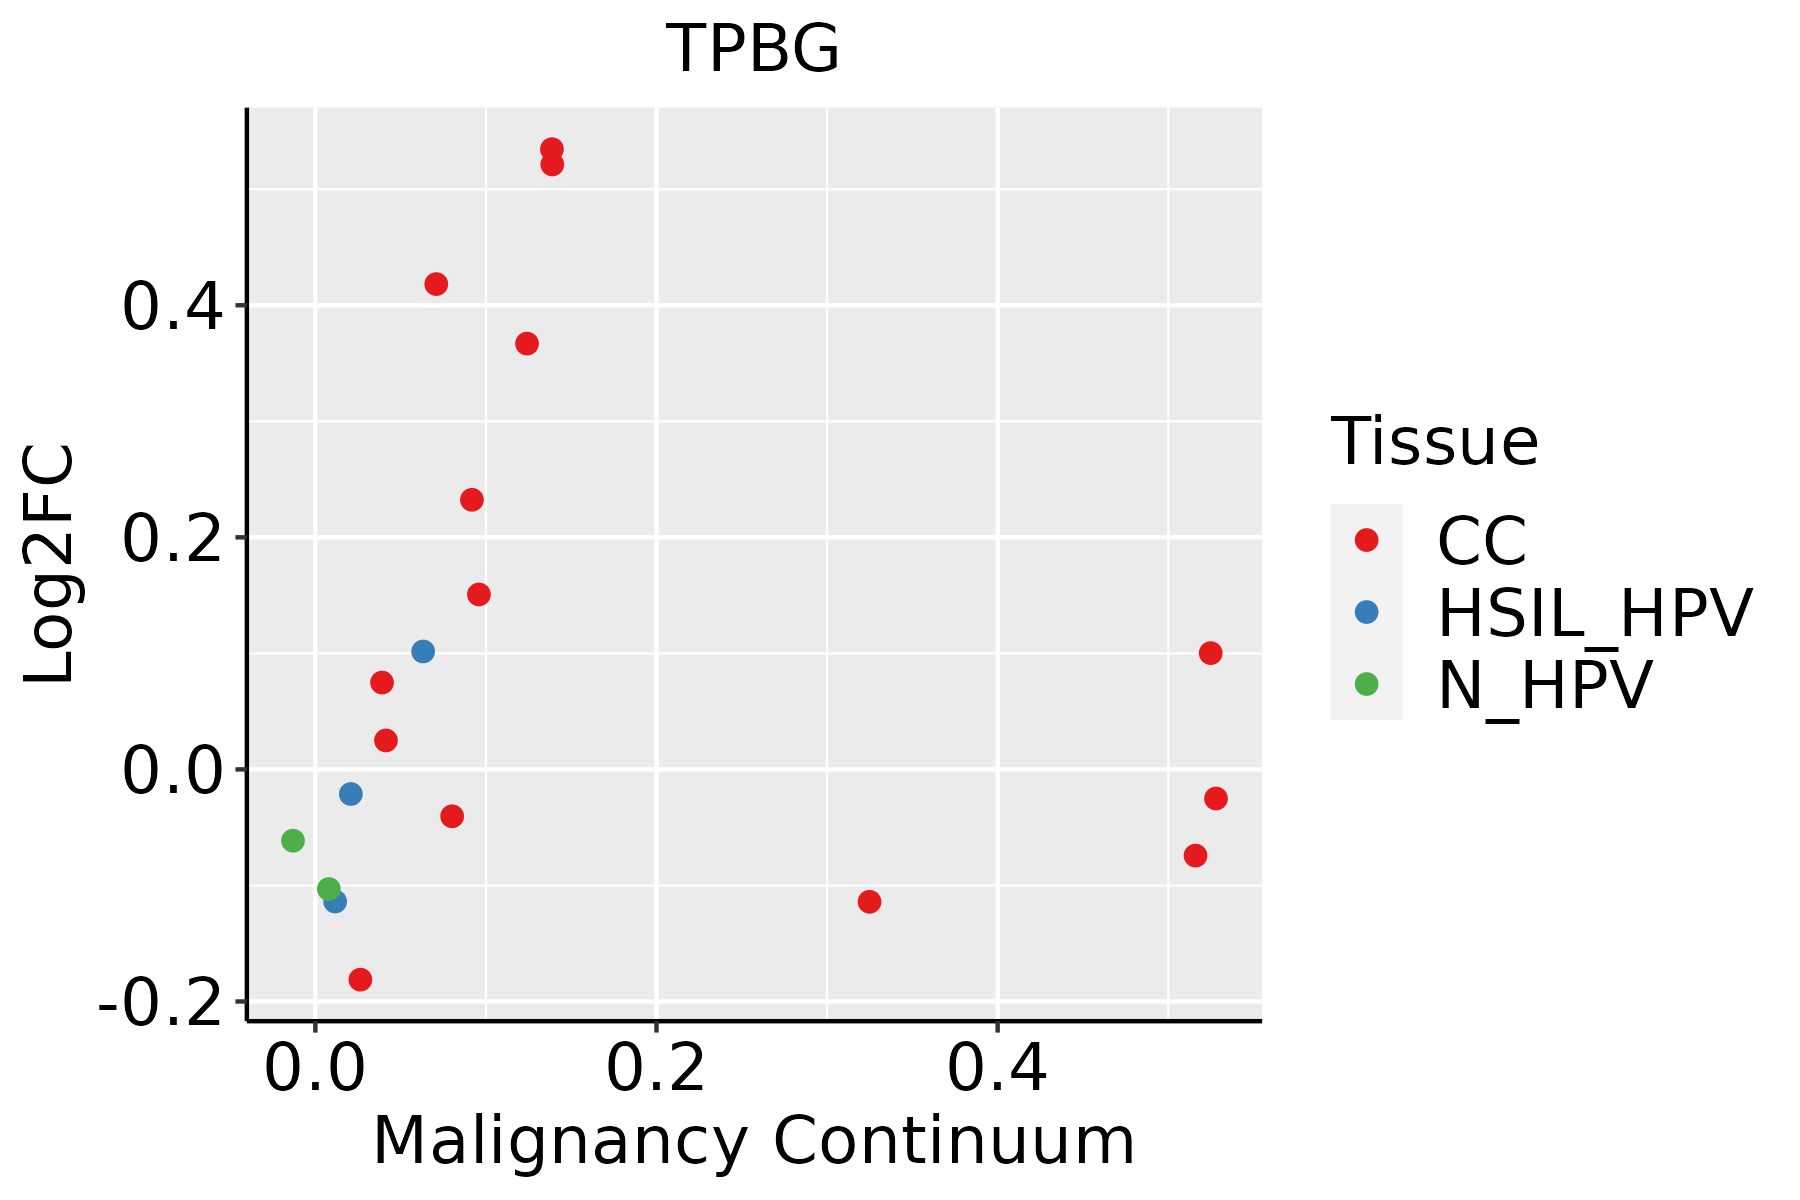 | CC: Cervix cancer |
| HSIL_HPV: HPV-infected high-grade squamous intraepithelial lesions | ||
| N_HPV: HPV-infected normal cervix | ||
| Endometrium |  | AEH: Atypical endometrial hyperplasia |
| EEC: Endometrioid Cancer | ||
| Esophagus | 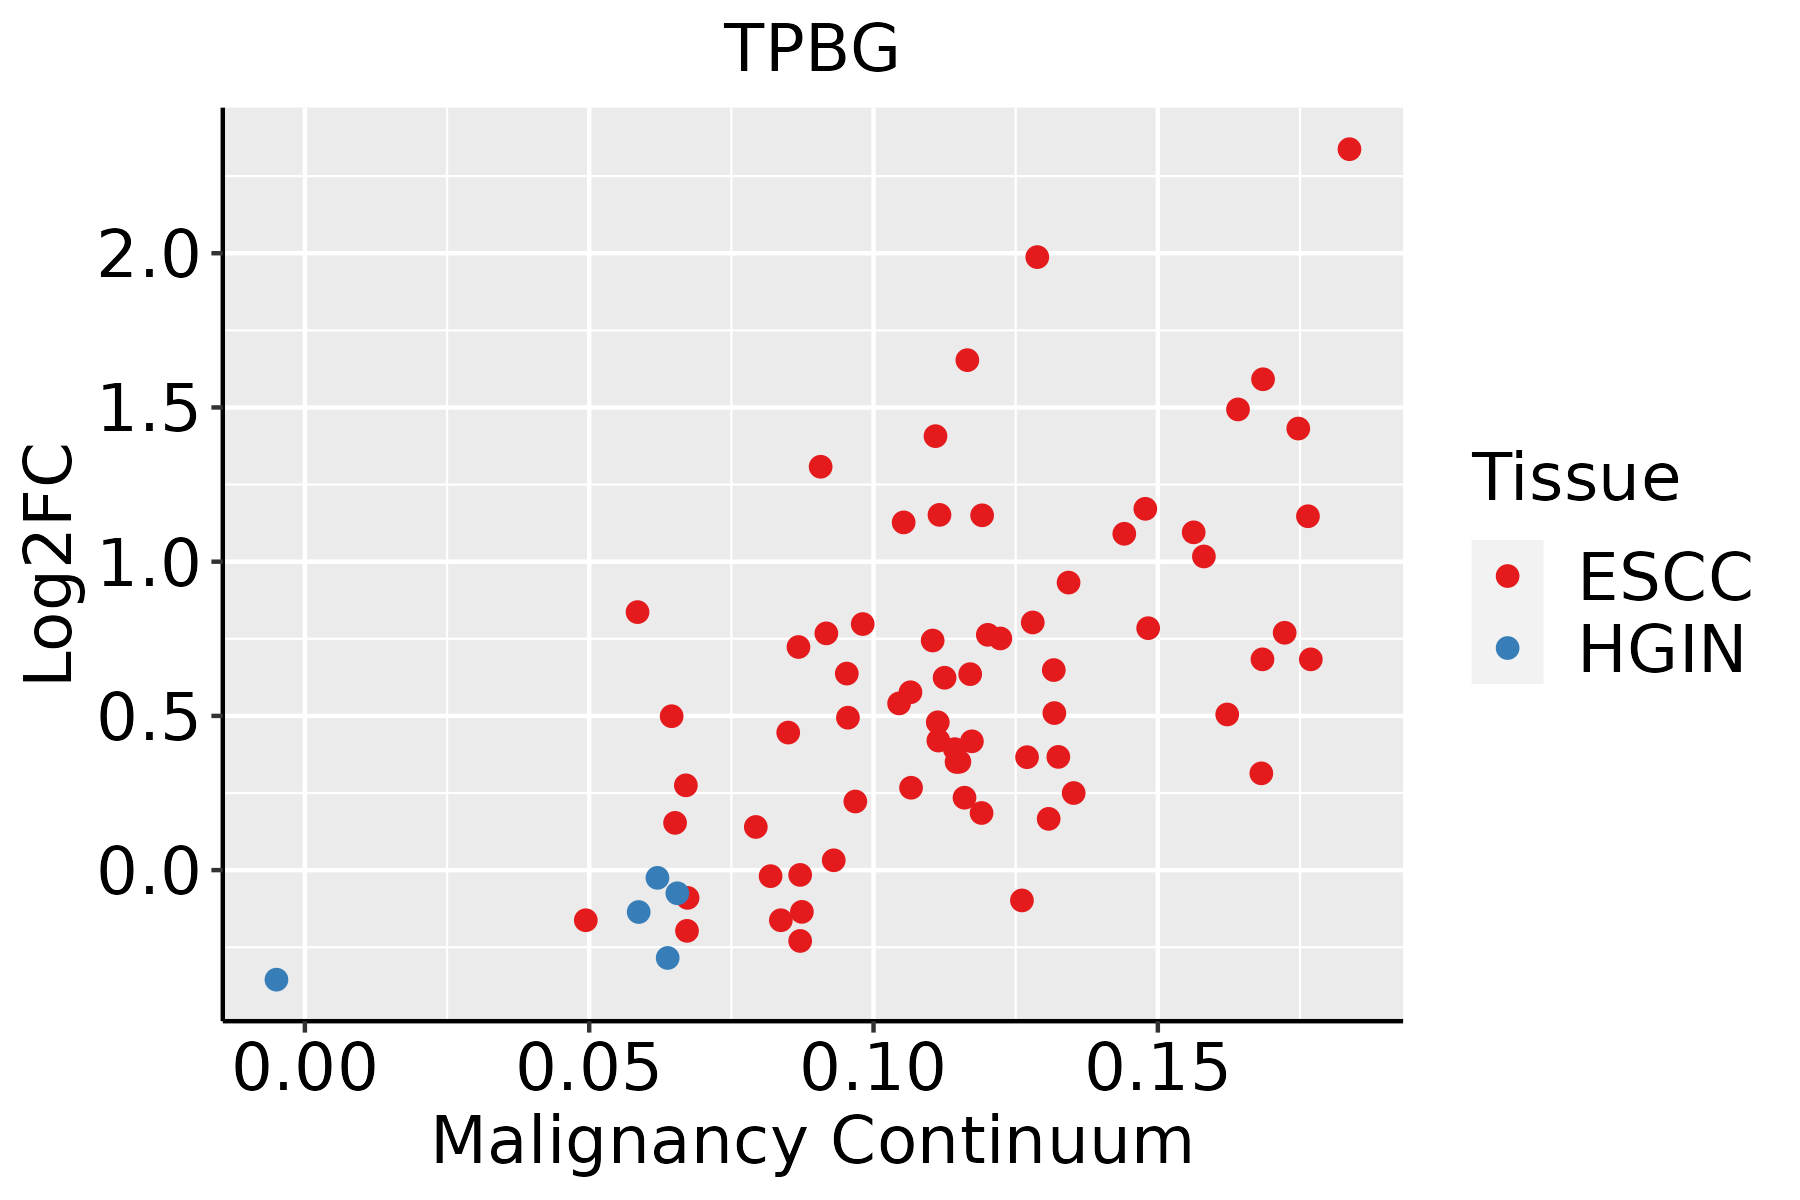 | ESCC: Esophageal squamous cell carcinoma |
| HGIN: High-grade intraepithelial neoplasias | ||
| LGIN: Low-grade intraepithelial neoplasias | ||
| Oral Cavity |  | EOLP: Erosive Oral lichen planus |
| LP: leukoplakia | ||
| NEOLP: Non-erosive oral lichen planus | ||
| OSCC: Oral squamous cell carcinoma | ||
| Prostate | 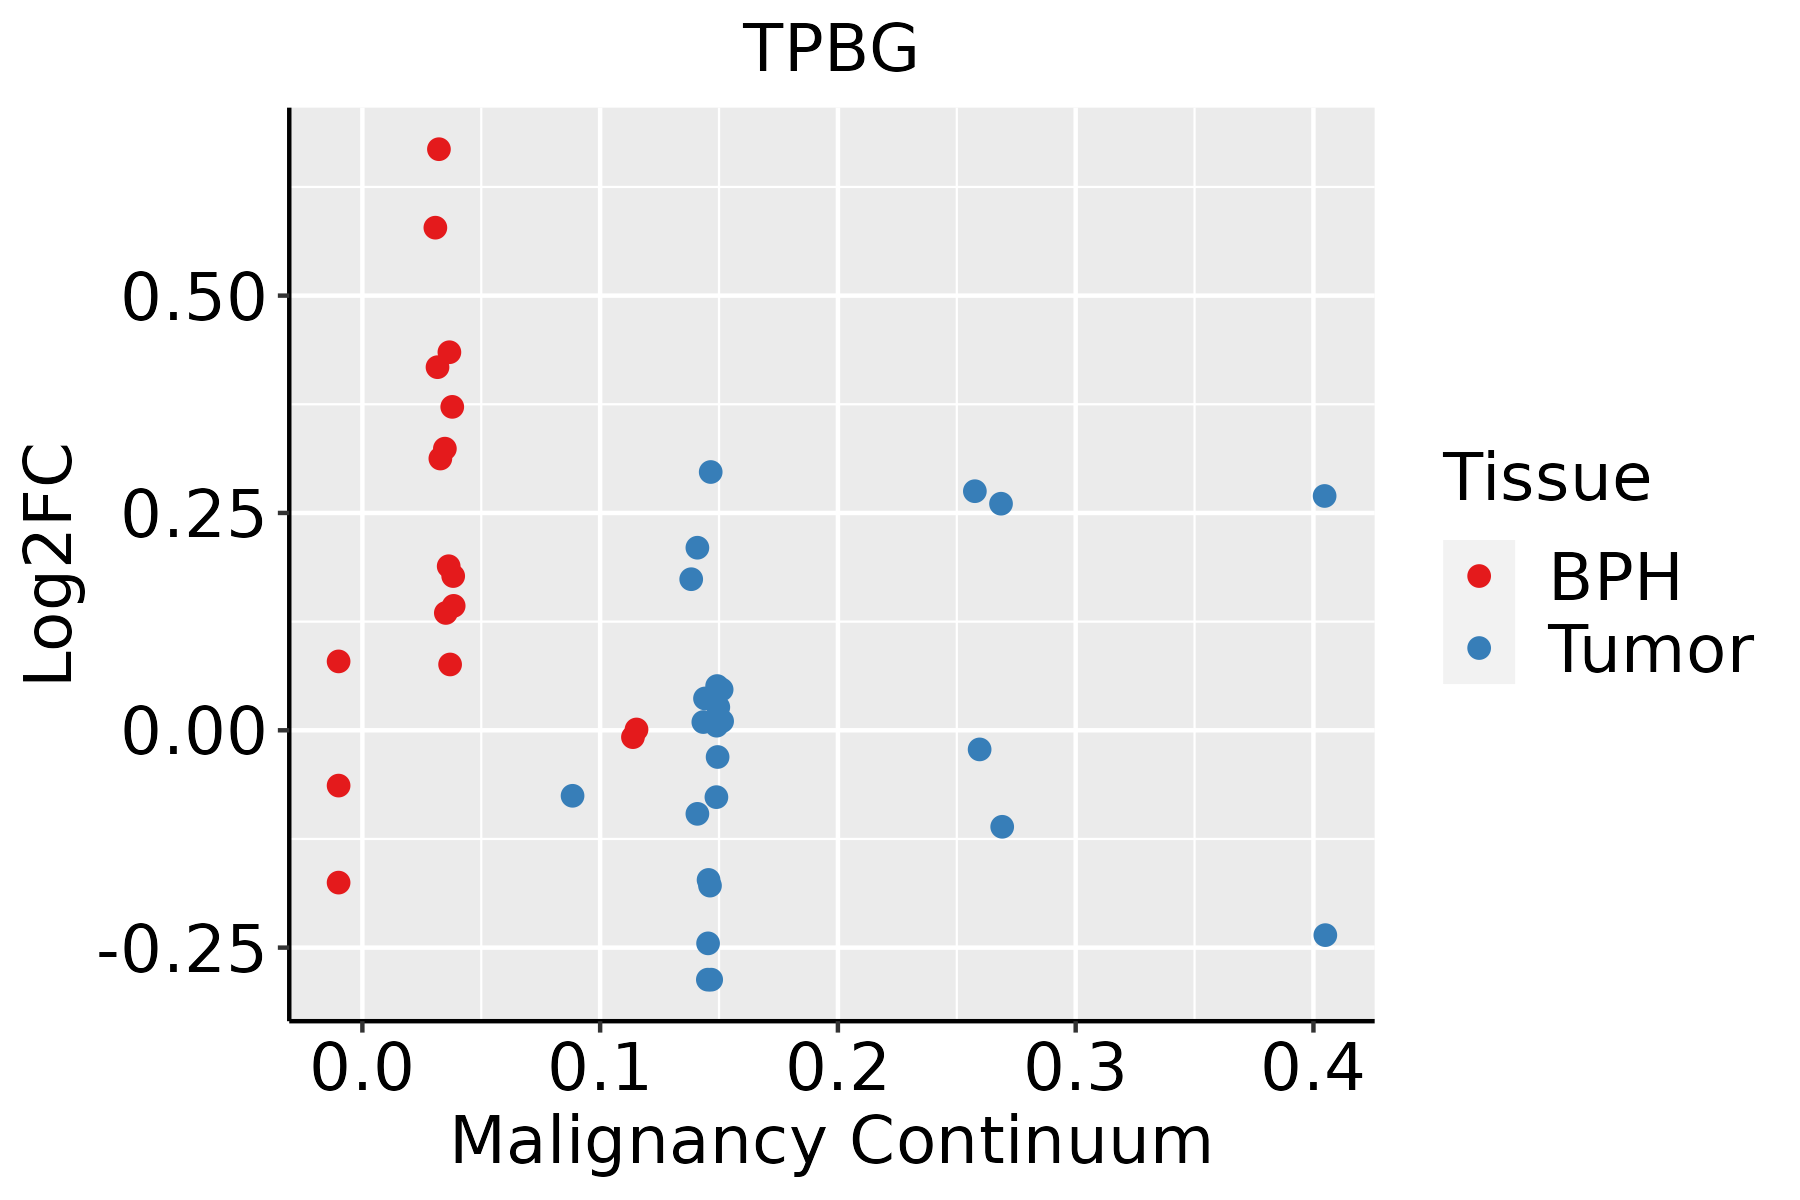 | BPH: Benign Prostatic Hyperplasia |
| Skin |  | AK: Actinic keratosis |
| cSCC: Cutaneous squamous cell carcinoma | ||
| SCCIS:squamous cell carcinoma in situ | ||
| Thyroid | 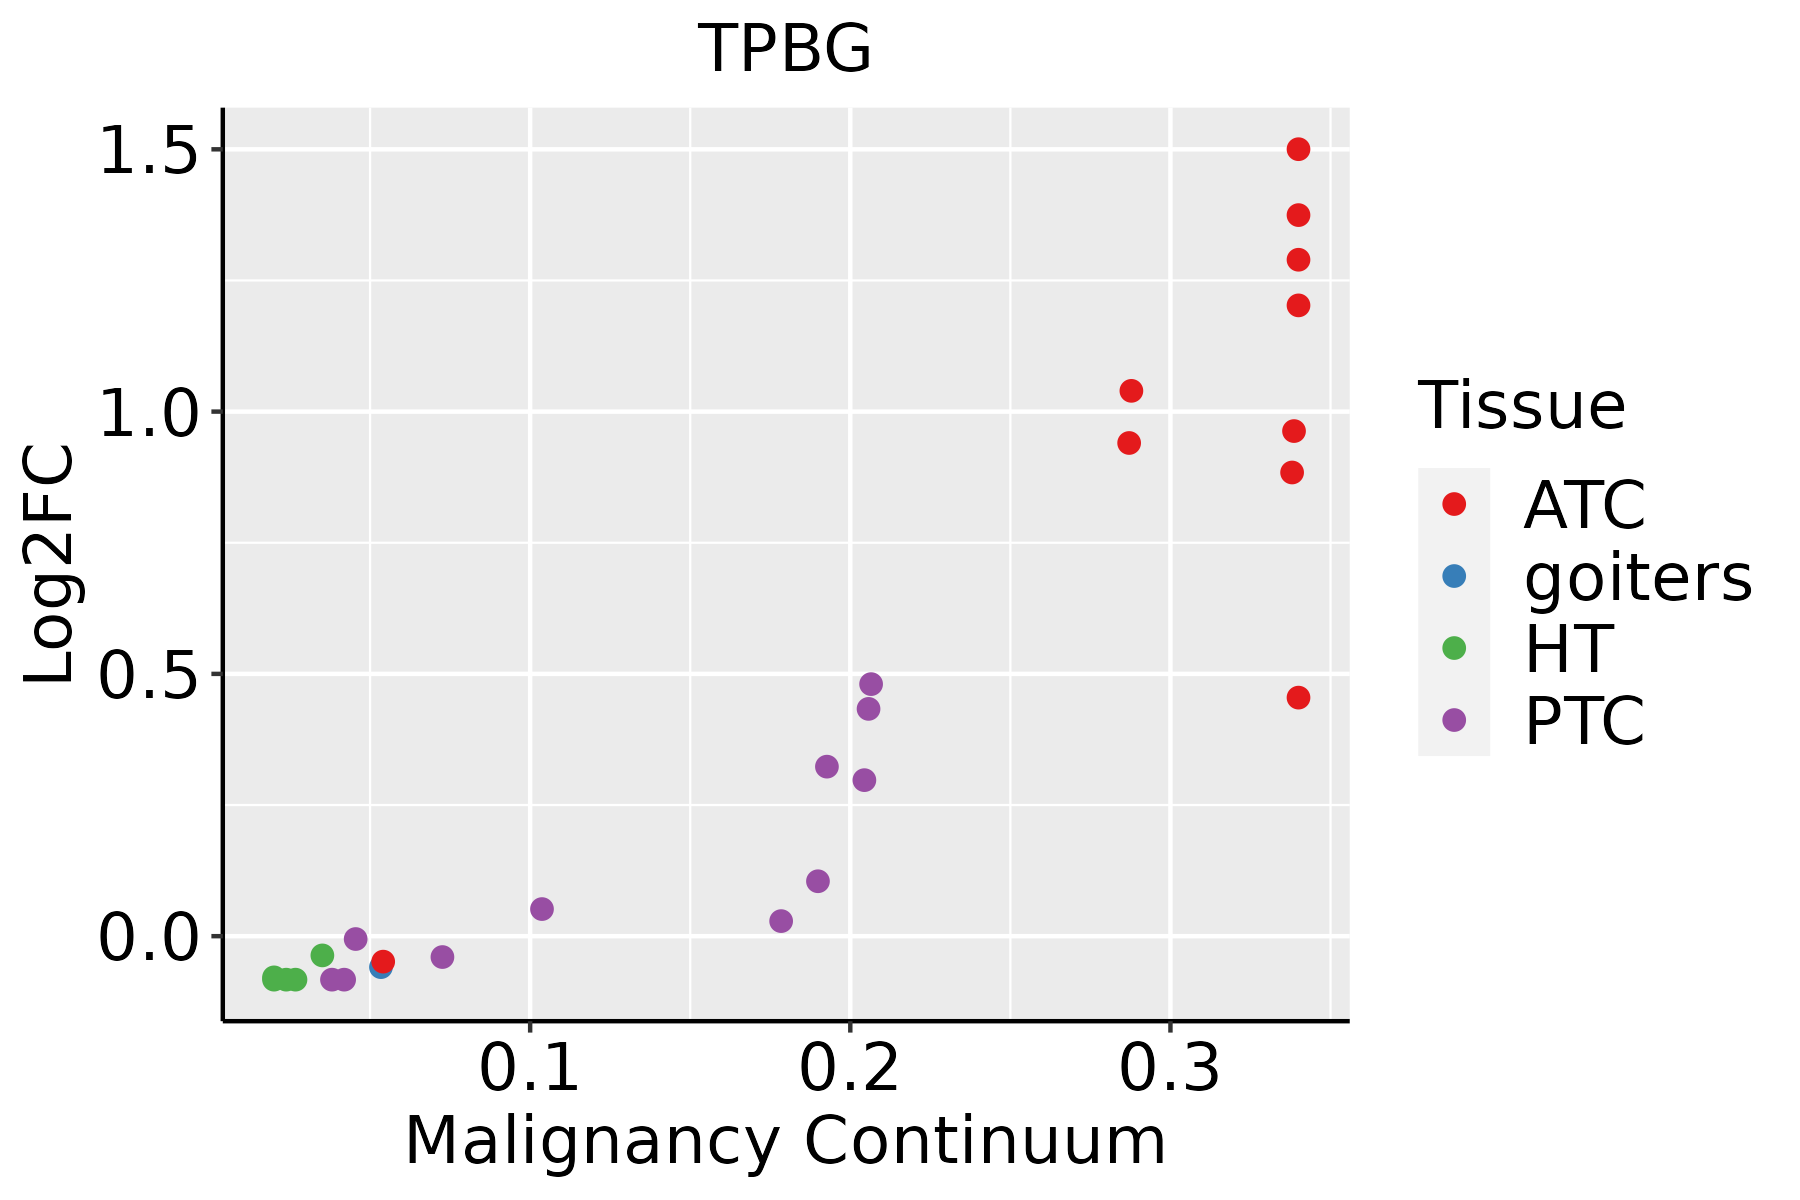 | ATC: Anaplastic thyroid cancer |
| HT: Hashimoto's thyroiditis | ||
| PTC: Papillary thyroid cancer |
| ∗log2FC in expression of this searched gene in stem-like cells from each diseased tissue sample relative to stem-like cells in normal samples in each tissue plotted against the malignancy continuum. Samples are colored based on if they are from different disease stage. |
Top |
Malignant transformation related pathway analysis |
| Find out the enriched GO biological processes and KEGG pathways involved in transition from healthy to precancer to cancer |
| Tissue | Disease Stage | Enriched GO biological Processes |
| Colorectum | AD |  |
| Colorectum | SER |  |
| Colorectum | MSS |  |
| Colorectum | MSI-H |  |
| Colorectum | FAP |  |
| ∗Top 15 enriched GO BP terms are showed in the bar plot of each disease state in each tissue. Each row represents a significant GO biological process which is colored according to the -log10(p.adjust). |
| Page: 1 2 3 4 5 6 7 8 9 |
| GO ID | Tissue | Disease Stage | Description | Gene Ratio | Bg Ratio | pvalue | p.adjust | Count |
| GO:006082817 | Esophagus | ESCC | regulation of canonical Wnt signaling pathway | 153/8552 | 253/18723 | 1.38e-06 | 1.67e-05 | 153 |
| GO:003432918 | Esophagus | ESCC | cell junction assembly | 227/8552 | 420/18723 | 3.06e-04 | 1.83e-03 | 227 |
| GO:00519606 | Esophagus | ESCC | regulation of nervous system development | 237/8552 | 443/18723 | 5.02e-04 | 2.78e-03 | 237 |
| GO:000166720 | Esophagus | ESCC | ameboidal-type cell migration | 250/8552 | 475/18723 | 1.22e-03 | 5.97e-03 | 250 |
| GO:00519625 | Esophagus | ESCC | positive regulation of nervous system development | 149/8552 | 272/18723 | 1.50e-03 | 7.06e-03 | 149 |
| GO:00301788 | Esophagus | ESCC | negative regulation of Wnt signaling pathway | 97/8552 | 170/18723 | 1.81e-03 | 8.31e-03 | 97 |
| GO:00900905 | Esophagus | ESCC | negative regulation of canonical Wnt signaling pathway | 78/8552 | 137/18723 | 5.17e-03 | 1.95e-02 | 78 |
| GO:001635816 | Esophagus | ESCC | dendrite development | 130/8552 | 243/18723 | 8.33e-03 | 2.95e-02 | 130 |
| GO:190188810 | Esophagus | ESCC | regulation of cell junction assembly | 109/8552 | 204/18723 | 1.53e-02 | 4.96e-02 | 109 |
| GO:007265918 | Oral cavity | OSCC | protein localization to plasma membrane | 169/7305 | 284/18723 | 1.69e-12 | 7.21e-11 | 169 |
| GO:199077816 | Oral cavity | OSCC | protein localization to cell periphery | 190/7305 | 333/18723 | 1.46e-11 | 5.13e-10 | 190 |
| GO:001605510 | Oral cavity | OSCC | Wnt signaling pathway | 227/7305 | 444/18723 | 1.10e-07 | 1.87e-06 | 227 |
| GO:019873810 | Oral cavity | OSCC | cell-cell signaling by wnt | 227/7305 | 446/18723 | 1.75e-07 | 2.86e-06 | 227 |
| GO:003011110 | Oral cavity | OSCC | regulation of Wnt signaling pathway | 165/7305 | 328/18723 | 1.87e-05 | 1.80e-04 | 165 |
| GO:000166719 | Oral cavity | OSCC | ameboidal-type cell migration | 228/7305 | 475/18723 | 3.46e-05 | 3.10e-04 | 228 |
| GO:006082810 | Oral cavity | OSCC | regulation of canonical Wnt signaling pathway | 128/7305 | 253/18723 | 1.11e-04 | 8.16e-04 | 128 |
| GO:00321037 | Oral cavity | OSCC | positive regulation of response to external stimulus | 203/7305 | 427/18723 | 1.79e-04 | 1.22e-03 | 203 |
| GO:00519624 | Oral cavity | OSCC | positive regulation of nervous system development | 135/7305 | 272/18723 | 2.20e-04 | 1.44e-03 | 135 |
| GO:00509216 | Oral cavity | OSCC | positive regulation of chemotaxis | 76/7305 | 141/18723 | 2.30e-04 | 1.49e-03 | 76 |
| GO:006007010 | Oral cavity | OSCC | canonical Wnt signaling pathway | 148/7305 | 303/18723 | 2.89e-04 | 1.82e-03 | 148 |
| Page: 1 2 3 4 5 6 7 8 9 10 11 12 |
| Pathway ID | Tissue | Disease Stage | Description | Gene Ratio | Bg Ratio | pvalue | p.adjust | qvalue | Count |
| Page: 1 |
Top |
Cell-cell communication analysis |
| Identification of potential cell-cell interactions between two cell types and their ligand-receptor pairs for different disease states |
| Ligand | Receptor | LRpair | Pathway | Tissue | Disease Stage |
| Page: 1 |
Top |
Single-cell gene regulatory network inference analysis |
| Find out the significant the regulons (TFs) and the target genes of each regulon across cell types for different disease states |
| TF | Cell Type | Tissue | Disease Stage | Target Gene | RSS | Regulon Activity |
| ∗The dot plots of a searched regulon are shown for all cell subpopulations in each disease state of each tissue based on the regulon specific score inferred using pySCENIC and by calculating the average expression. |
| Page: 1 |
Top |
Somatic mutation of malignant transformation related genes |
| Annotation of somatic variants for genes involved in malignant transformation |
| Hugo Symbol | Variant Class | Variant Classification | dbSNP RS | HGVSc | HGVSp | HGVSp Short | SWISSPROT | BIOTYPE | SIFT | PolyPhen | Tumor Sample Barcode | Tissue | Histology | Sex | Age | Stage | Therapy Types | Drugs | Outcome |
| TPBG | SNV | Missense_Mutation | c.1198N>T | p.His400Tyr | p.H400Y | Q13641 | protein_coding | deleterious(0) | probably_damaging(0.946) | TCGA-EK-A2RJ-01 | Cervix | cervical & endocervical cancer | Female | <65 | I/II | Unknown | Unknown | SD | |
| TPBG | SNV | Missense_Mutation | novel | c.805N>A | p.Ala269Thr | p.A269T | Q13641 | protein_coding | deleterious(0.04) | possibly_damaging(0.556) | TCGA-VS-A94Z-01 | Cervix | cervical & endocervical cancer | Female | <65 | I/II | Chemotherapy | cisplatin | CR |
| TPBG | SNV | Missense_Mutation | c.602N>T | p.Ala201Val | p.A201V | Q13641 | protein_coding | deleterious(0.02) | benign(0.01) | TCGA-AA-3815-01 | Colorectum | colon adenocarcinoma | Female | >=65 | I/II | Unknown | Unknown | SD | |
| TPBG | SNV | Missense_Mutation | c.1133N>A | p.Arg378His | p.R378H | Q13641 | protein_coding | deleterious(0) | probably_damaging(0.991) | TCGA-AD-5900-01 | Colorectum | colon adenocarcinoma | Male | >=65 | I/II | Unknown | Unknown | SD | |
| TPBG | SNV | Missense_Mutation | novel | c.863N>T | p.Arg288Met | p.R288M | Q13641 | protein_coding | deleterious(0) | benign(0.436) | TCGA-AZ-4315-01 | Colorectum | colon adenocarcinoma | Male | <65 | I/II | Unknown | Unknown | SD |
| TPBG | SNV | Missense_Mutation | c.1220N>T | p.Ala407Val | p.A407V | Q13641 | protein_coding | deleterious(0) | possibly_damaging(0.715) | TCGA-AZ-6598-01 | Colorectum | colon adenocarcinoma | Female | >=65 | I/II | Unknown | Unknown | SD | |
| TPBG | SNV | Missense_Mutation | novel | c.983N>T | p.Lys328Ile | p.K328I | Q13641 | protein_coding | deleterious(0.05) | benign(0.326) | TCGA-CA-6717-01 | Colorectum | colon adenocarcinoma | Male | <65 | I/II | Chemotherapy | oxaliplatin | CR |
| TPBG | insertion | Frame_Shift_Ins | novel | c.185_186insC | p.Ala64ArgfsTer16 | p.A64Rfs*16 | Q13641 | protein_coding | TCGA-AA-3864-01 | Colorectum | colon adenocarcinoma | Male | >=65 | I/II | Unknown | Unknown | SD | ||
| TPBG | SNV | Missense_Mutation | novel | c.545N>G | p.His182Arg | p.H182R | Q13641 | protein_coding | tolerated(0.44) | benign(0) | TCGA-A5-A0G2-01 | Endometrium | uterine corpus endometrioid carcinoma | Female | <65 | III/IV | Unknown | Unknown | SD |
| TPBG | SNV | Missense_Mutation | novel | c.491G>A | p.Gly164Asp | p.G164D | Q13641 | protein_coding | tolerated(0.64) | benign(0.241) | TCGA-AP-A1DV-01 | Endometrium | uterine corpus endometrioid carcinoma | Female | <65 | I/II | Unknown | Unknown | SD |
| Page: 1 2 3 4 |
Top |
Related drugs of malignant transformation related genes |
| Identification of chemicals and drugs interact with genes involved in malignant transfromation |
| (DGIdb 4.0) |
| Entrez ID | Symbol | Category | Interaction Types | Drug Claim Name | Drug Name | PMIDs |
| 7162 | TPBG | CELL SURFACE, DRUGGABLE GENOME | CHEMBL1743045 | NAPTUMOMAB ESTAFENATOX | ||
| 7162 | TPBG | CELL SURFACE, DRUGGABLE GENOME | antibody | 374883834 | ||
| 7162 | TPBG | CELL SURFACE, DRUGGABLE GENOME | CHEMBL2108248 | ANATUMOMAB MAFENATOX | ||
| 7162 | TPBG | CELL SURFACE, DRUGGABLE GENOME | PF-06263507 | PF-06263507 | ||
| 7162 | TPBG | CELL SURFACE, DRUGGABLE GENOME | Naptumomab estafenatox | |||
| 7162 | TPBG | CELL SURFACE, DRUGGABLE GENOME | CV-9201 | |||
| 7162 | TPBG | CELL SURFACE, DRUGGABLE GENOME | TroVax | TROVAX | ||
| 7162 | TPBG | CELL SURFACE, DRUGGABLE GENOME | antibody | 374883835 |
| Page: 1 |

Copyright 2023-Present -The University of Texas Health Science Center at Houston |