
|
|||||
|
 | |
| |
| |
| |
| |
| |
|
Gene: TNFRSF14 |
Gene summary for TNFRSF14 |
| Gene information | Species | Human | Gene symbol | TNFRSF14 | Gene ID | 8764 |
| Gene name | TNF receptor superfamily member 14 | |
| Gene Alias | ATAR | |
| Cytomap | 1p36.32 | |
| Gene Type | protein-coding | GO ID | GO:0001775 | UniProtAcc | A0A024R052 |
Top |
Malignant transformation analysis |
| Identification of the aberrant gene expression in precancerous and cancerous lesions by comparing the gene expression of stem-like cells in diseased tissues with normal stem cells |
| Entrez ID | Symbol | Replicates | Species | Organ | Tissue | Adj P-value | Log2FC | Malignancy |
| 8764 | TNFRSF14 | LZE4T | Human | Esophagus | ESCC | 1.30e-10 | 2.25e-01 | 0.0811 |
| 8764 | TNFRSF14 | LZE8T | Human | Esophagus | ESCC | 8.91e-12 | 3.24e-01 | 0.067 |
| 8764 | TNFRSF14 | LZE20T | Human | Esophagus | ESCC | 1.28e-05 | 3.26e-01 | 0.0662 |
| 8764 | TNFRSF14 | LZE22D1 | Human | Esophagus | HGIN | 4.94e-03 | 1.18e-01 | 0.0595 |
| 8764 | TNFRSF14 | LZE22T | Human | Esophagus | ESCC | 3.61e-03 | 1.32e-01 | 0.068 |
| 8764 | TNFRSF14 | LZE24T | Human | Esophagus | ESCC | 1.01e-12 | 4.09e-01 | 0.0596 |
| 8764 | TNFRSF14 | LZE6T | Human | Esophagus | ESCC | 2.02e-04 | 1.91e-01 | 0.0845 |
| 8764 | TNFRSF14 | P1T-E | Human | Esophagus | ESCC | 2.56e-04 | 4.21e-01 | 0.0875 |
| 8764 | TNFRSF14 | P2T-E | Human | Esophagus | ESCC | 4.53e-28 | 3.31e-01 | 0.1177 |
| 8764 | TNFRSF14 | P4T-E | Human | Esophagus | ESCC | 2.28e-11 | 2.84e-01 | 0.1323 |
| 8764 | TNFRSF14 | P5T-E | Human | Esophagus | ESCC | 1.36e-10 | 1.17e-01 | 0.1327 |
| 8764 | TNFRSF14 | P8T-E | Human | Esophagus | ESCC | 6.64e-45 | 9.33e-01 | 0.0889 |
| 8764 | TNFRSF14 | P9T-E | Human | Esophagus | ESCC | 6.55e-04 | 1.83e-01 | 0.1131 |
| 8764 | TNFRSF14 | P10T-E | Human | Esophagus | ESCC | 1.21e-07 | 2.22e-02 | 0.116 |
| 8764 | TNFRSF14 | P11T-E | Human | Esophagus | ESCC | 6.67e-10 | 4.77e-01 | 0.1426 |
| 8764 | TNFRSF14 | P12T-E | Human | Esophagus | ESCC | 2.88e-05 | 6.19e-02 | 0.1122 |
| 8764 | TNFRSF14 | P15T-E | Human | Esophagus | ESCC | 2.32e-07 | 2.56e-01 | 0.1149 |
| 8764 | TNFRSF14 | P16T-E | Human | Esophagus | ESCC | 1.81e-16 | 1.28e-01 | 0.1153 |
| 8764 | TNFRSF14 | P17T-E | Human | Esophagus | ESCC | 1.14e-08 | 4.40e-01 | 0.1278 |
| 8764 | TNFRSF14 | P20T-E | Human | Esophagus | ESCC | 9.66e-12 | 3.23e-01 | 0.1124 |
| Page: 1 2 3 4 5 6 |
| Tissue | Expression Dynamics | Abbreviation |
| Esophagus | 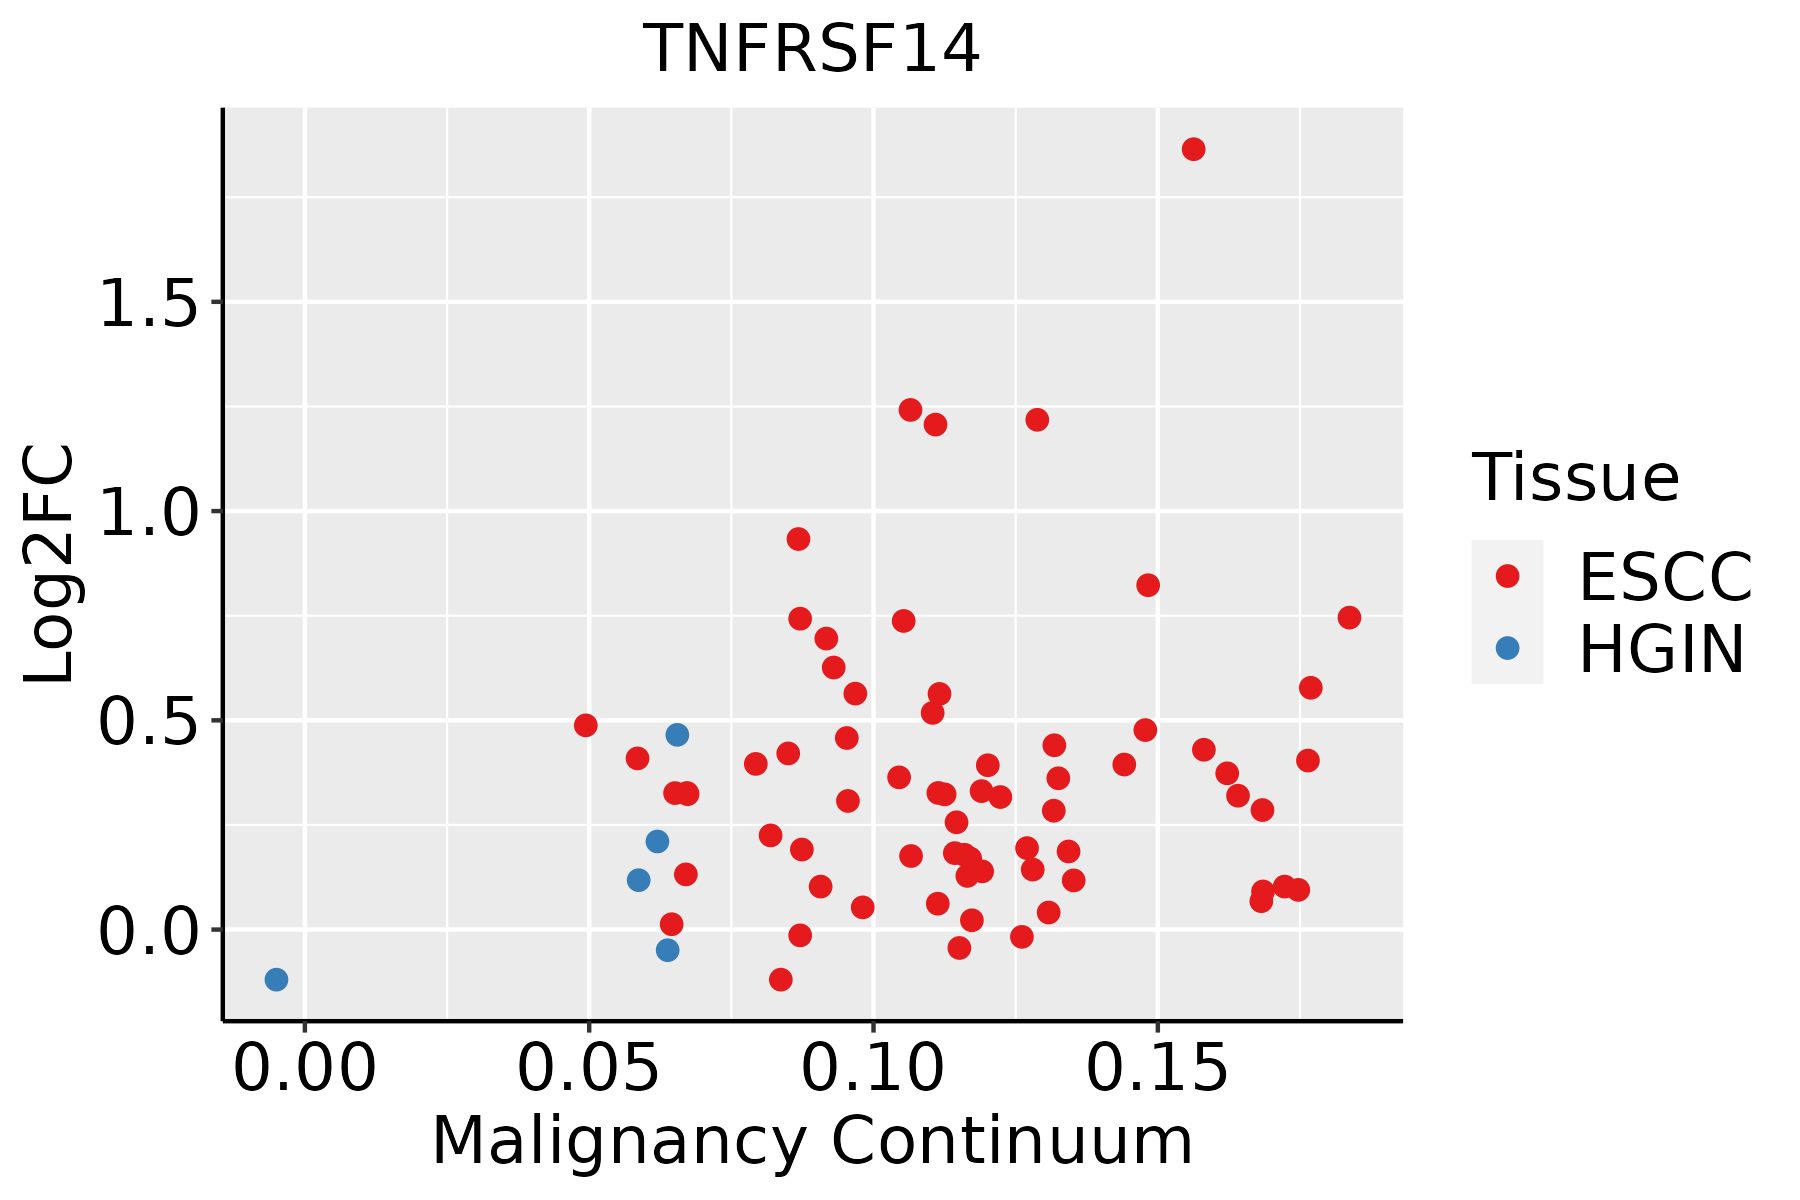 | ESCC: Esophageal squamous cell carcinoma |
| HGIN: High-grade intraepithelial neoplasias | ||
| LGIN: Low-grade intraepithelial neoplasias | ||
| Liver |  | HCC: Hepatocellular carcinoma |
| NAFLD: Non-alcoholic fatty liver disease | ||
| Oral Cavity | 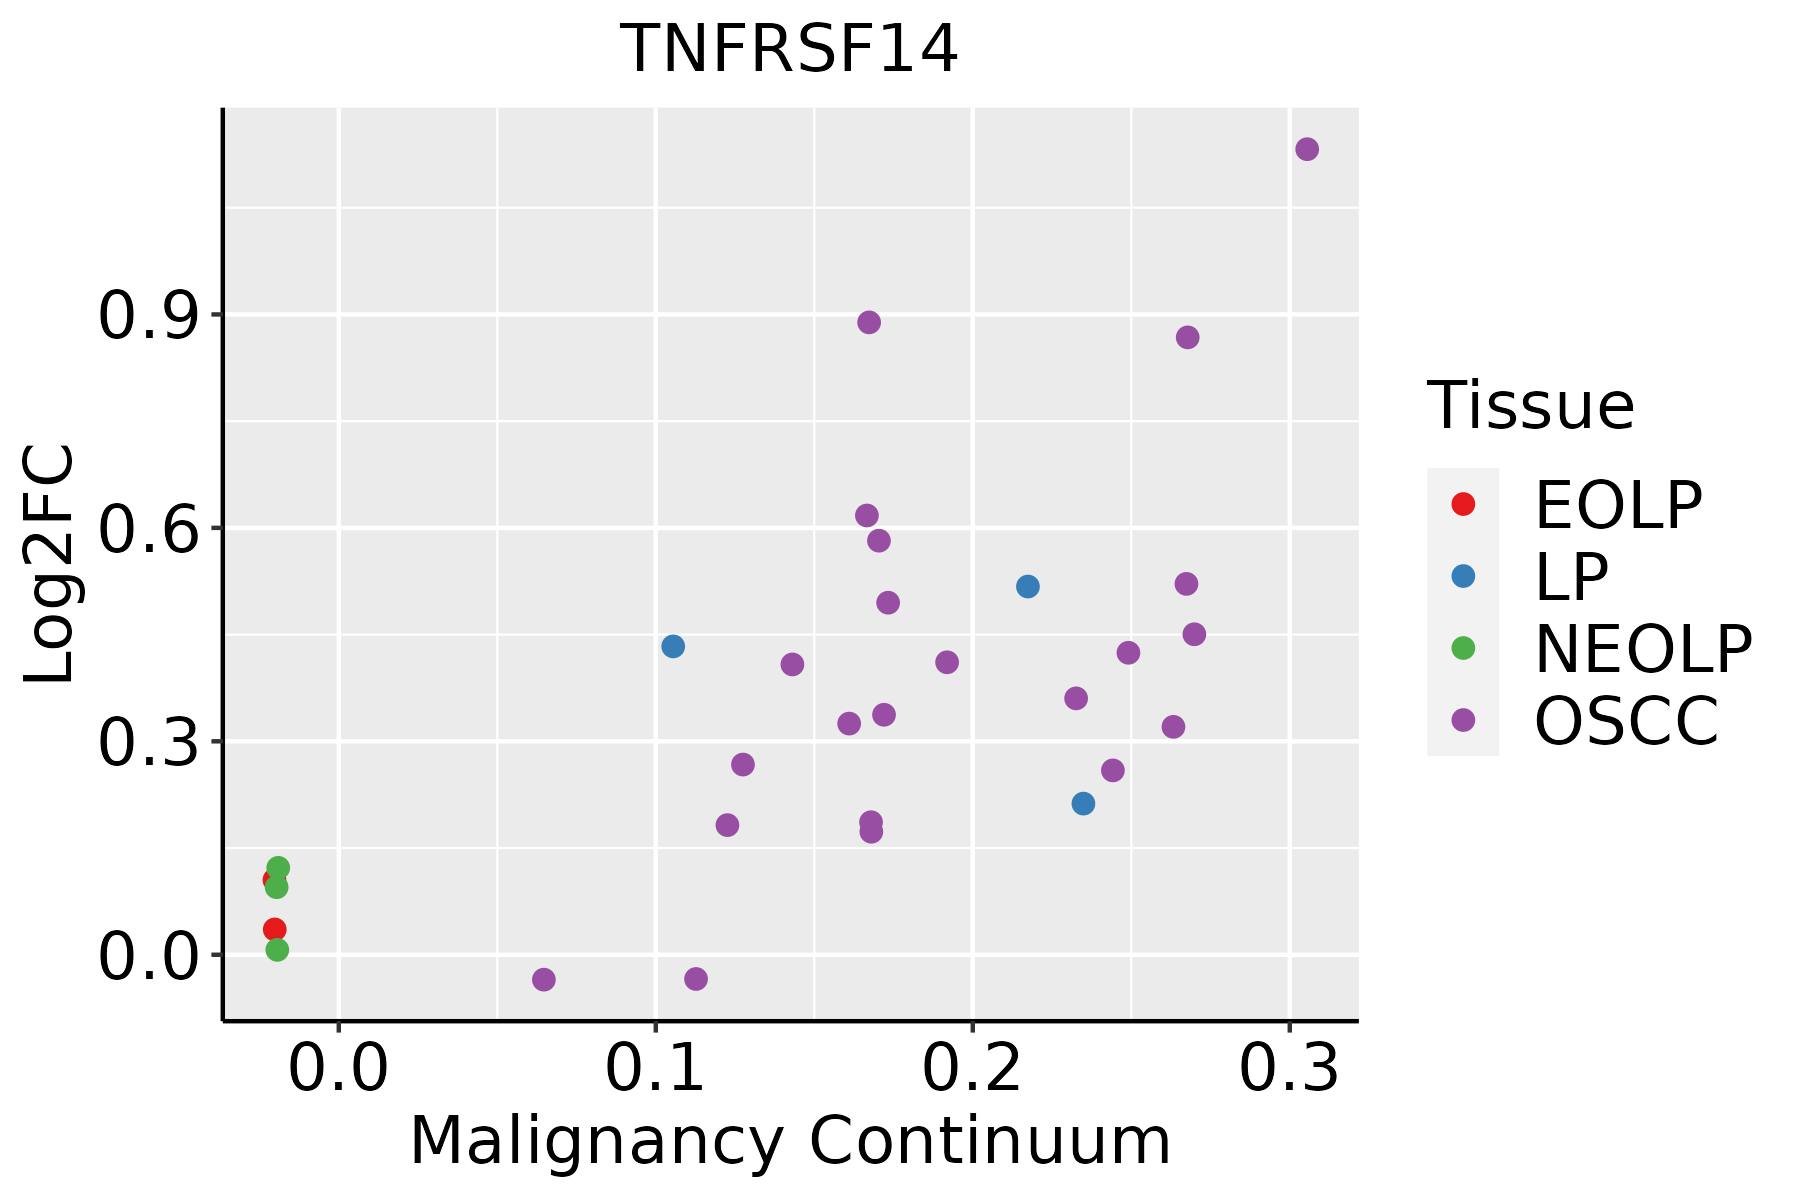 | EOLP: Erosive Oral lichen planus |
| LP: leukoplakia | ||
| NEOLP: Non-erosive oral lichen planus | ||
| OSCC: Oral squamous cell carcinoma | ||
| Prostate | 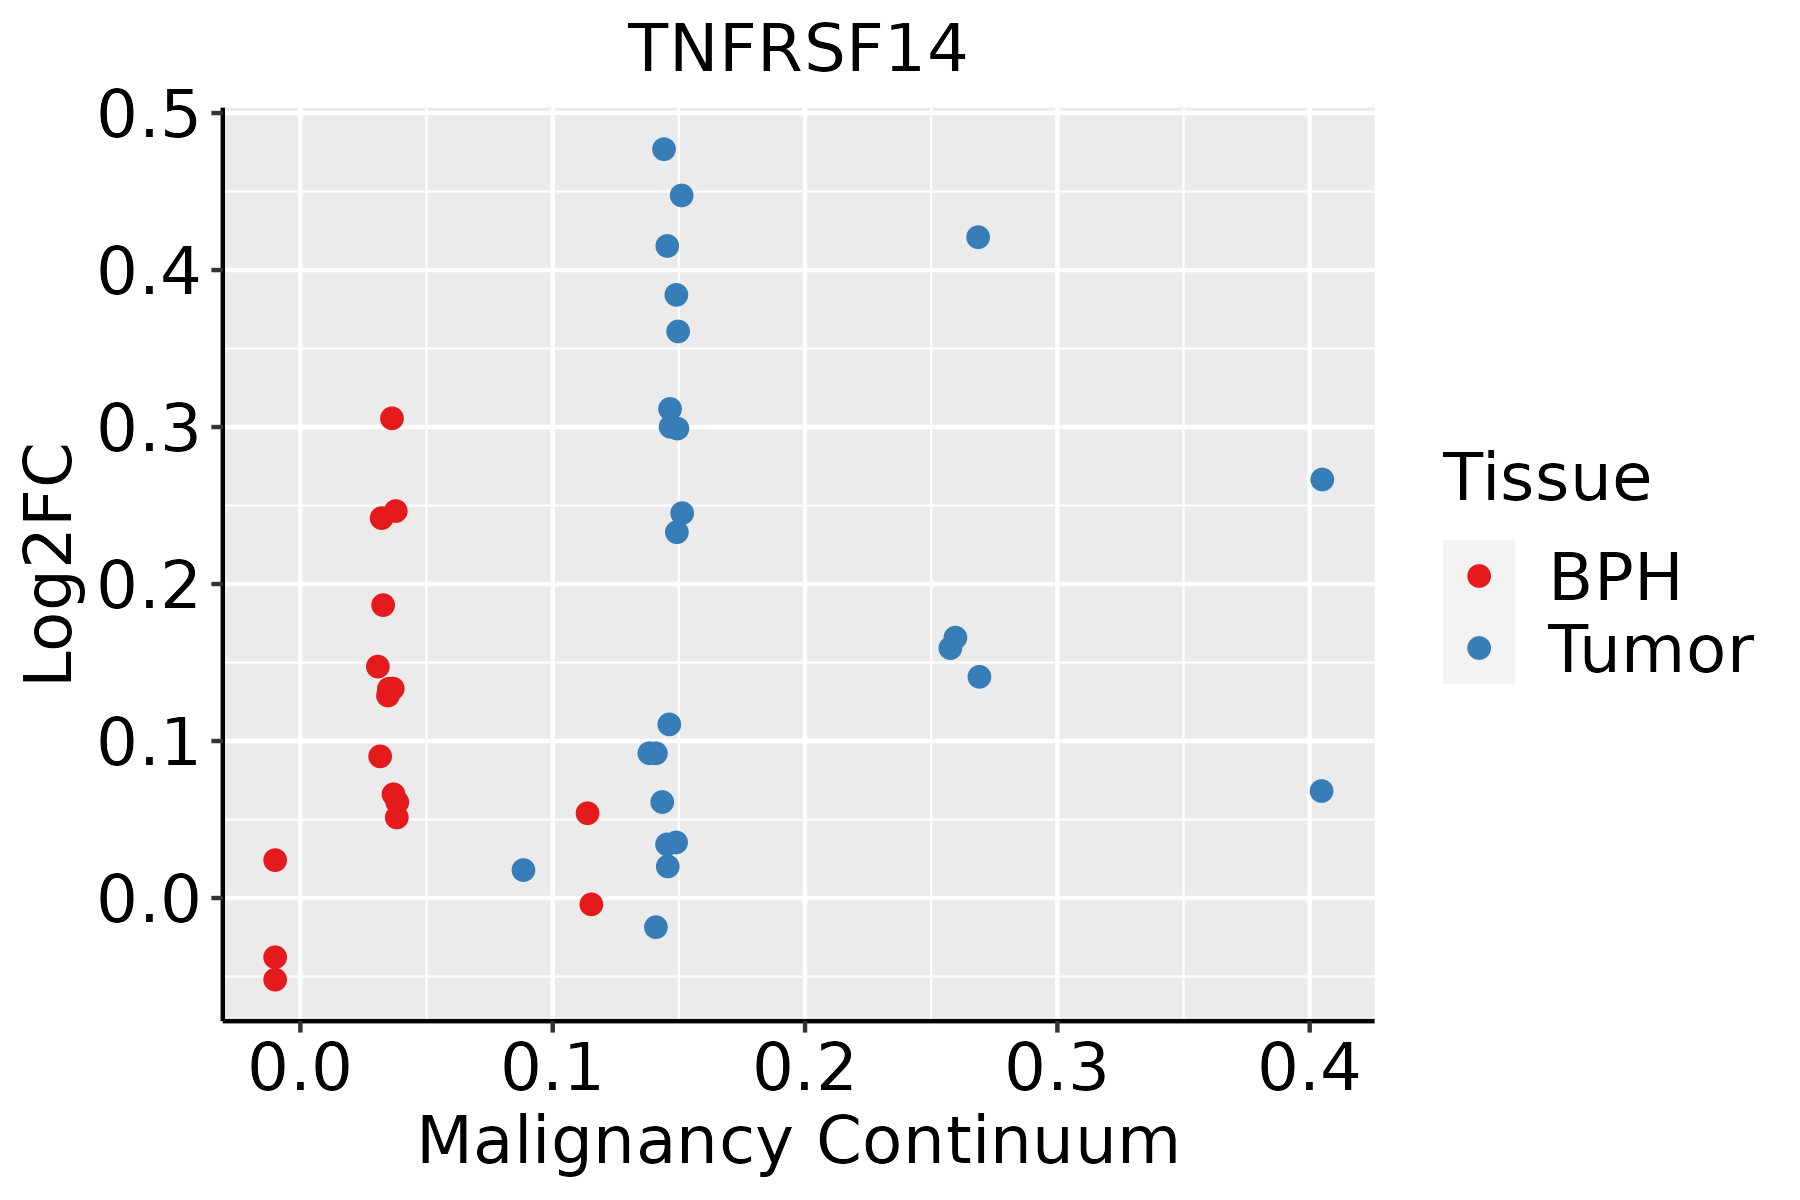 | BPH: Benign Prostatic Hyperplasia |
| Thyroid | 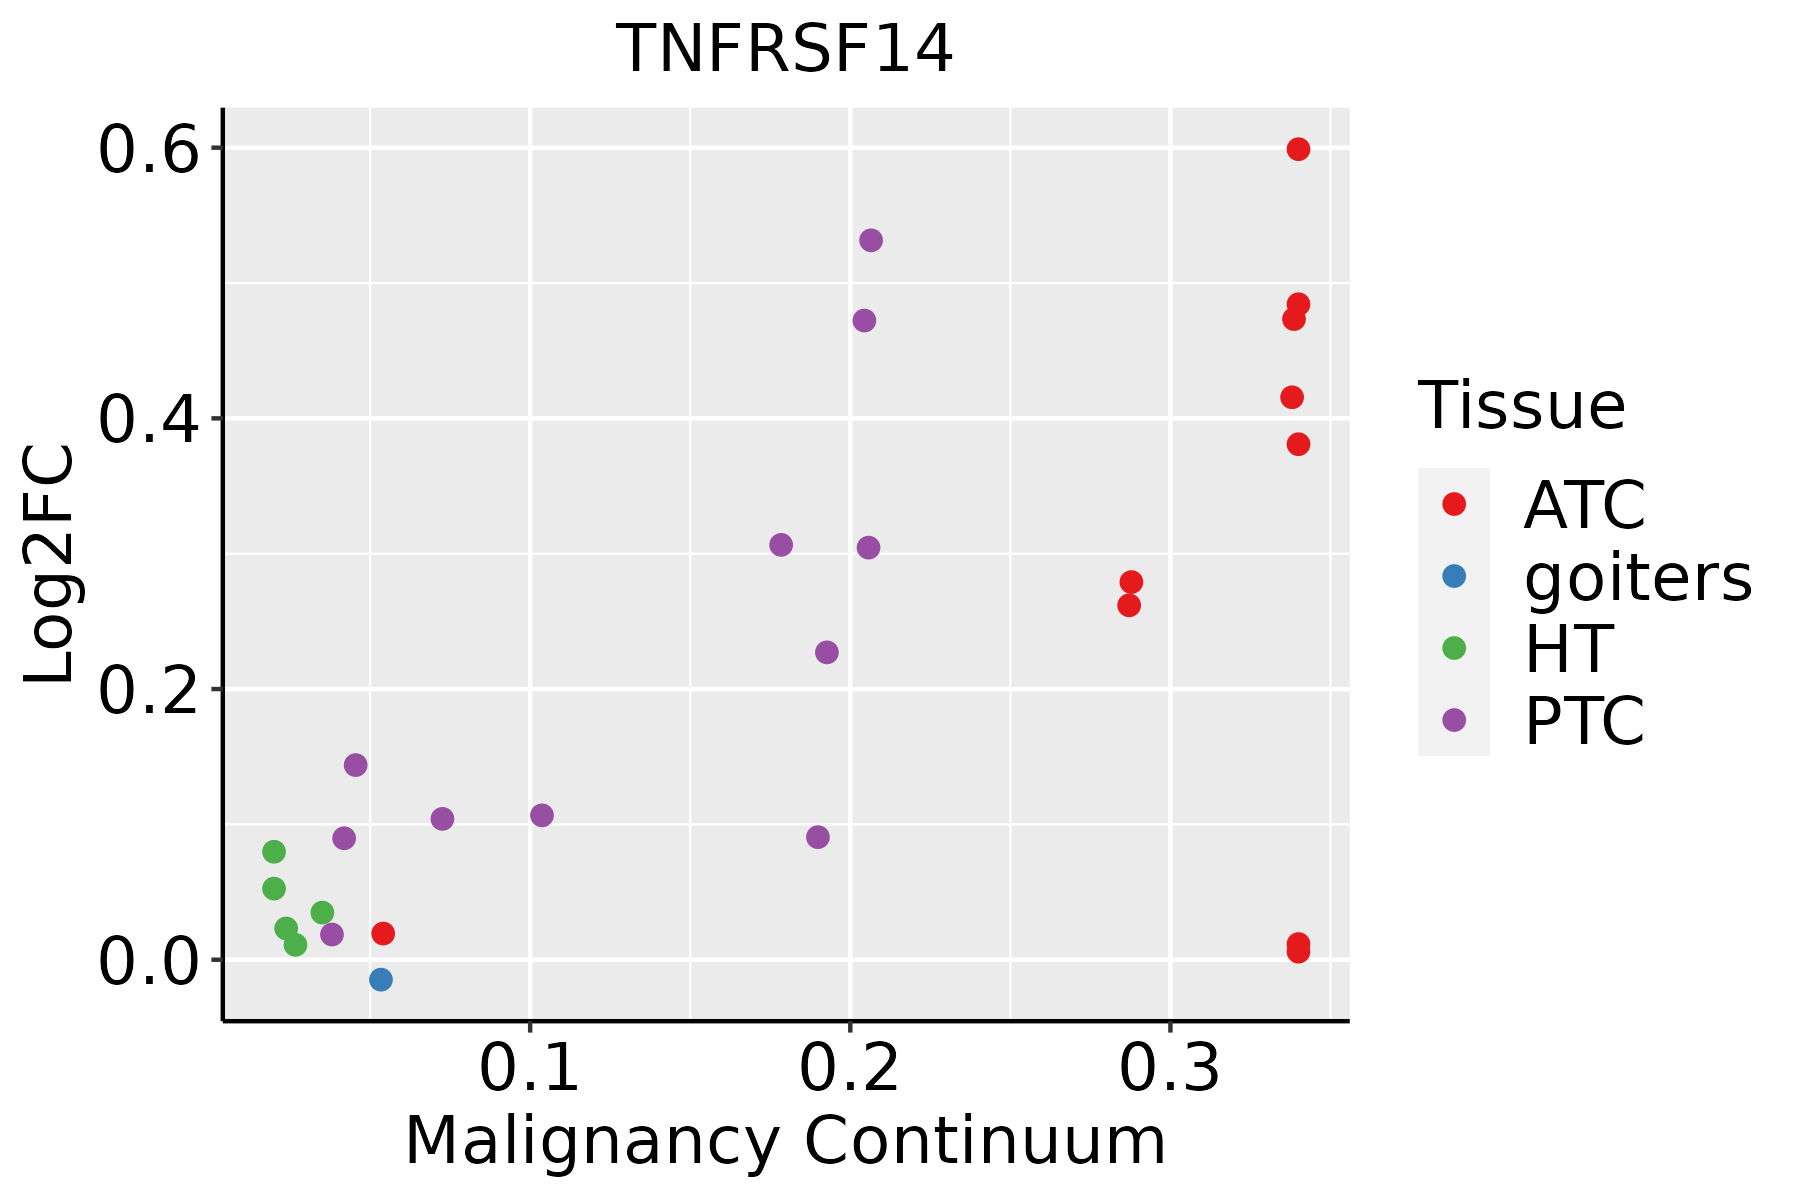 | ATC: Anaplastic thyroid cancer |
| HT: Hashimoto's thyroiditis | ||
| PTC: Papillary thyroid cancer |
| ∗log2FC in expression of this searched gene in stem-like cells from each diseased tissue sample relative to stem-like cells in normal samples in each tissue plotted against the malignancy continuum. Samples are colored based on if they are from different disease stage. |
Top |
Malignant transformation related pathway analysis |
| Find out the enriched GO biological processes and KEGG pathways involved in transition from healthy to precancer to cancer |
| Tissue | Disease Stage | Enriched GO biological Processes |
| Colorectum | AD |  |
| Colorectum | SER |  |
| Colorectum | MSS |  |
| Colorectum | MSI-H |  |
| Colorectum | FAP |  |
| ∗Top 15 enriched GO BP terms are showed in the bar plot of each disease state in each tissue. Each row represents a significant GO biological process which is colored according to the -log10(p.adjust). |
| Page: 1 2 3 4 5 6 7 8 9 |
| GO ID | Tissue | Disease Stage | Description | Gene Ratio | Bg Ratio | pvalue | p.adjust | Count |
| GO:00071629 | Oral cavity | OSCC | negative regulation of cell adhesion | 145/7305 | 303/18723 | 9.95e-04 | 5.18e-03 | 145 |
| GO:00507774 | Oral cavity | OSCC | negative regulation of immune response | 97/7305 | 194/18723 | 1.16e-03 | 5.91e-03 | 97 |
| GO:002240917 | Oral cavity | OSCC | positive regulation of cell-cell adhesion | 136/7305 | 284/18723 | 1.35e-03 | 6.62e-03 | 136 |
| GO:000181910 | Oral cavity | OSCC | positive regulation of cytokine production | 213/7305 | 467/18723 | 1.93e-03 | 8.96e-03 | 213 |
| GO:00466333 | Oral cavity | OSCC | alpha-beta T cell proliferation | 24/7305 | 38/18723 | 2.21e-03 | 1.00e-02 | 24 |
| GO:190303910 | Oral cavity | OSCC | positive regulation of leukocyte cell-cell adhesion | 115/7305 | 239/18723 | 2.48e-03 | 1.09e-02 | 115 |
| GO:00716758 | Oral cavity | OSCC | regulation of mononuclear cell migration | 60/7305 | 115/18723 | 2.78e-03 | 1.21e-02 | 60 |
| GO:00466403 | Oral cavity | OSCC | regulation of alpha-beta T cell proliferation | 22/7305 | 35/18723 | 3.65e-03 | 1.51e-02 | 22 |
| GO:00726783 | Oral cavity | OSCC | T cell migration | 37/7305 | 66/18723 | 3.66e-03 | 1.51e-02 | 37 |
| GO:005087010 | Oral cavity | OSCC | positive regulation of T cell activation | 104/7305 | 216/18723 | 3.76e-03 | 1.55e-02 | 104 |
| GO:20004013 | Oral cavity | OSCC | regulation of lymphocyte migration | 34/7305 | 61/18723 | 5.90e-03 | 2.25e-02 | 34 |
| GO:0046642 | Oral cavity | OSCC | negative regulation of alpha-beta T cell proliferation | 10/7305 | 13/18723 | 6.32e-03 | 2.35e-02 | 10 |
| GO:00706618 | Oral cavity | OSCC | leukocyte proliferation | 145/7305 | 318/18723 | 9.31e-03 | 3.33e-02 | 145 |
| GO:00027022 | Oral cavity | OSCC | positive regulation of production of molecular mediator of immune response | 58/7305 | 117/18723 | 1.28e-02 | 4.27e-02 | 58 |
| GO:00224086 | Oral cavity | OSCC | negative regulation of cell-cell adhesion | 92/7305 | 196/18723 | 1.41e-02 | 4.64e-02 | 92 |
| GO:00466517 | Oral cavity | OSCC | lymphocyte proliferation | 131/7305 | 288/18723 | 1.41e-02 | 4.67e-02 | 131 |
| GO:001603218 | Prostate | BPH | viral process | 147/3107 | 415/18723 | 4.46e-21 | 5.52e-18 | 147 |
| GO:001905818 | Prostate | BPH | viral life cycle | 112/3107 | 317/18723 | 2.87e-16 | 5.54e-14 | 112 |
| GO:005212618 | Prostate | BPH | movement in host environment | 64/3107 | 175/18723 | 1.28e-10 | 7.47e-09 | 64 |
| GO:004440318 | Prostate | BPH | biological process involved in symbiotic interaction | 90/3107 | 290/18723 | 6.98e-10 | 3.25e-08 | 90 |
| Page: 1 2 3 4 5 6 7 8 9 10 |
| Pathway ID | Tissue | Disease Stage | Description | Gene Ratio | Bg Ratio | pvalue | p.adjust | qvalue | Count |
| Page: 1 |
Top |
Cell-cell communication analysis |
| Identification of potential cell-cell interactions between two cell types and their ligand-receptor pairs for different disease states |
| Ligand | Receptor | LRpair | Pathway | Tissue | Disease Stage |
| TNFSF14 | TNFRSF14 | TNFSF14_TNFRSF14 | LIGHT | Breast | DCIS |
| LTA | TNFRSF14 | LTA_TNFRSF14 | LT | Cervix | ADJ |
| BTLA | TNFRSF14 | BTLA_TNFRSF14 | BTLA | Cervix | ADJ |
| TNFSF14 | TNFRSF14 | TNFSF14_TNFRSF14 | LIGHT | Cervix | CC |
| TNFSF14 | TNFRSF14 | TNFSF14_TNFRSF14 | LIGHT | Cervix | Healthy |
| TNFSF14 | TNFRSF14 | TNFSF14_TNFRSF14 | LIGHT | Cervix | Precancer |
| TNFSF14 | TNFRSF14 | TNFSF14_TNFRSF14 | LIGHT | Endometrium | ADJ |
| TNFSF14 | TNFRSF14 | TNFSF14_TNFRSF14 | LIGHT | Endometrium | AEH |
| TNFSF14 | TNFRSF14 | TNFSF14_TNFRSF14 | LIGHT | Endometrium | Healthy |
| LTA | TNFRSF14 | LTA_TNFRSF14 | LT | Esophagus | ADJ |
| LTA | TNFRSF14 | LTA_TNFRSF14 | LT | Esophagus | ESCC |
| TNFSF14 | TNFRSF14 | TNFSF14_TNFRSF14 | LIGHT | Esophagus | ESCC |
| TNFSF14 | TNFRSF14 | TNFSF14_TNFRSF14 | LIGHT | HNSCC | ADJ |
| TNFSF14 | TNFRSF14 | TNFSF14_TNFRSF14 | LIGHT | HNSCC | OSCC |
| TNFSF14 | TNFRSF14 | TNFSF14_TNFRSF14 | LIGHT | Liver | Healthy |
| TNFSF14 | TNFRSF14 | TNFSF14_TNFRSF14 | LIGHT | Liver | Precancer |
| TNFSF14 | TNFRSF14 | TNFSF14_TNFRSF14 | LIGHT | Lung | AAH |
| TNFSF14 | TNFRSF14 | TNFSF14_TNFRSF14 | LIGHT | Prostate | BPH |
| TNFSF14 | TNFRSF14 | TNFSF14_TNFRSF14 | LIGHT | Prostate | Tumor |
| TNFSF14 | TNFRSF14 | TNFSF14_TNFRSF14 | LIGHT | Skin | cSCC |
| Page: 1 |
Top |
Single-cell gene regulatory network inference analysis |
| Find out the significant the regulons (TFs) and the target genes of each regulon across cell types for different disease states |
| TF | Cell Type | Tissue | Disease Stage | Target Gene | RSS | Regulon Activity |
| ∗The dot plots of a searched regulon are shown for all cell subpopulations in each disease state of each tissue based on the regulon specific score inferred using pySCENIC and by calculating the average expression. |
| Page: 1 |
Top |
Somatic mutation of malignant transformation related genes |
| Annotation of somatic variants for genes involved in malignant transformation |
| Hugo Symbol | Variant Class | Variant Classification | dbSNP RS | HGVSc | HGVSp | HGVSp Short | SWISSPROT | BIOTYPE | SIFT | PolyPhen | Tumor Sample Barcode | Tissue | Histology | Sex | Age | Stage | Therapy Types | Drugs | Outcome |
| TNFRSF14 | SNV | Missense_Mutation | c.583G>T | p.Gly195Trp | p.G195W | Q92956 | protein_coding | deleterious(0) | probably_damaging(0.992) | TCGA-OL-A66P-01 | Breast | breast invasive carcinoma | Female | >=65 | I/II | Chemotherapy | cytoxan | CR | |
| TNFRSF14 | SNV | Missense_Mutation | novel | c.531G>T | p.Glu177Asp | p.E177D | Q92956 | protein_coding | tolerated(0.23) | benign(0.007) | TCGA-2W-A8YY-01 | Cervix | cervical & endocervical cancer | Female | <65 | I/II | Chemotherapy | cisplatin | CR |
| TNFRSF14 | SNV | Missense_Mutation | c.160N>C | p.Cys54Arg | p.C54R | Q92956 | protein_coding | deleterious(0) | probably_damaging(1) | TCGA-A6-A565-01 | Colorectum | colon adenocarcinoma | Female | <65 | III/IV | Unspecific | 5FU | PD | |
| TNFRSF14 | SNV | Missense_Mutation | rs371087831 | c.785C>T | p.Pro262Leu | p.P262L | Q92956 | protein_coding | deleterious(0.01) | possibly_damaging(0.818) | TCGA-AM-5821-01 | Colorectum | colon adenocarcinoma | Female | >=65 | I/II | Unknown | Unknown | SD |
| TNFRSF14 | SNV | Missense_Mutation | c.558N>A | p.Ser186Arg | p.S186R | Q92956 | protein_coding | deleterious(0.03) | benign(0.3) | TCGA-CM-6678-01 | Colorectum | colon adenocarcinoma | Female | <65 | I/II | Chemotherapy | fluorouracil | SD | |
| TNFRSF14 | SNV | Missense_Mutation | c.823T>A | p.Ser275Thr | p.S275T | Q92956 | protein_coding | tolerated(0.76) | benign(0) | TCGA-QL-A97D-01 | Colorectum | colon adenocarcinoma | Female | >=65 | I/II | Unknown | Unknown | SD | |
| TNFRSF14 | SNV | Missense_Mutation | c.779C>T | p.Ala260Val | p.A260V | Q92956 | protein_coding | tolerated(0.39) | benign(0.003) | TCGA-AF-A56N-01 | Colorectum | rectum adenocarcinoma | Female | <65 | I/II | Chemotherapy | xeloda | CR | |
| TNFRSF14 | SNV | Missense_Mutation | novel | c.631N>A | p.Val211Ile | p.V211I | Q92956 | protein_coding | tolerated(0.52) | benign(0.003) | TCGA-A5-A2K5-01 | Endometrium | uterine corpus endometrioid carcinoma | Female | >=65 | I/II | Unknown | Unknown | SD |
| TNFRSF14 | SNV | Missense_Mutation | novel | c.454N>G | p.Lys152Glu | p.K152E | Q92956 | protein_coding | tolerated(1) | benign(0) | TCGA-AJ-A3EL-01 | Endometrium | uterine corpus endometrioid carcinoma | Female | <65 | I/II | Unknown | Unknown | SD |
| TNFRSF14 | SNV | Missense_Mutation | novel | c.644T>C | p.Val215Ala | p.V215A | Q92956 | protein_coding | tolerated(0.41) | benign(0.006) | TCGA-AP-A1DM-01 | Endometrium | uterine corpus endometrioid carcinoma | Female | <65 | I/II | Unknown | Unknown | SD |
| Page: 1 2 |
Top |
Related drugs of malignant transformation related genes |
| Identification of chemicals and drugs interact with genes involved in malignant transfromation |
| (DGIdb 4.0) |
| Entrez ID | Symbol | Category | Interaction Types | Drug Claim Name | Drug Name | PMIDs |
| 8764 | TNFRSF14 | CLINICALLY ACTIONABLE, EXTERNAL SIDE OF PLASMA MEMBRANE, DRUGGABLE GENOME | 178101757 | |||
| 8764 | TNFRSF14 | CLINICALLY ACTIONABLE, EXTERNAL SIDE OF PLASMA MEMBRANE, DRUGGABLE GENOME | 178101763 | |||
| 8764 | TNFRSF14 | CLINICALLY ACTIONABLE, EXTERNAL SIDE OF PLASMA MEMBRANE, DRUGGABLE GENOME | 178101591 |
| Page: 1 |

Copyright 2023-Present -The University of Texas Health Science Center at Houston |