
|
|||||
|
 | |
| |
| |
| |
| |
| |
|
Gene: TLE4 |
Gene summary for TLE4 |
| Gene information | Species | Human | Gene symbol | TLE4 | Gene ID | 7091 |
| Gene name | TLE family member 4, transcriptional corepressor | |
| Gene Alias | BCE-1 | |
| Cytomap | 9q21.31 | |
| Gene Type | protein-coding | GO ID | GO:0000122 | UniProtAcc | Q04727 |
Top |
Malignant transformation analysis |
| Identification of the aberrant gene expression in precancerous and cancerous lesions by comparing the gene expression of stem-like cells in diseased tissues with normal stem cells |
| Entrez ID | Symbol | Replicates | Species | Organ | Tissue | Adj P-value | Log2FC | Malignancy |
| 7091 | TLE4 | N_HPV_2 | Human | Cervix | N_HPV | 2.09e-02 | 1.64e-01 | -0.0131 |
| 7091 | TLE4 | CCI_1 | Human | Cervix | CC | 4.57e-02 | 6.40e-01 | 0.528 |
| 7091 | TLE4 | CCI_2 | Human | Cervix | CC | 1.04e-02 | 1.14e+00 | 0.5249 |
| 7091 | TLE4 | CCI_3 | Human | Cervix | CC | 2.15e-14 | 1.01e+00 | 0.516 |
| 7091 | TLE4 | sample1 | Human | Cervix | CC | 1.50e-05 | 5.61e-01 | 0.0959 |
| 7091 | TLE4 | T1 | Human | Cervix | CC | 1.12e-21 | 7.36e-01 | 0.0918 |
| 7091 | TLE4 | LZE4T | Human | Esophagus | ESCC | 1.11e-07 | 4.34e-01 | 0.0811 |
| 7091 | TLE4 | LZE8T | Human | Esophagus | ESCC | 2.84e-02 | 6.77e-02 | 0.067 |
| 7091 | TLE4 | LZE20T | Human | Esophagus | ESCC | 3.68e-06 | 1.98e-01 | 0.0662 |
| 7091 | TLE4 | LZE24T | Human | Esophagus | ESCC | 1.22e-12 | 4.80e-01 | 0.0596 |
| 7091 | TLE4 | P1T-E | Human | Esophagus | ESCC | 7.64e-07 | 2.71e-01 | 0.0875 |
| 7091 | TLE4 | P2T-E | Human | Esophagus | ESCC | 4.21e-27 | 5.87e-01 | 0.1177 |
| 7091 | TLE4 | P4T-E | Human | Esophagus | ESCC | 2.19e-12 | 3.05e-01 | 0.1323 |
| 7091 | TLE4 | P5T-E | Human | Esophagus | ESCC | 1.24e-08 | 3.86e-01 | 0.1327 |
| 7091 | TLE4 | P8T-E | Human | Esophagus | ESCC | 7.89e-12 | 2.74e-01 | 0.0889 |
| 7091 | TLE4 | P9T-E | Human | Esophagus | ESCC | 7.58e-18 | 4.78e-01 | 0.1131 |
| 7091 | TLE4 | P10T-E | Human | Esophagus | ESCC | 1.14e-18 | 3.11e-01 | 0.116 |
| 7091 | TLE4 | P11T-E | Human | Esophagus | ESCC | 4.27e-08 | 4.18e-01 | 0.1426 |
| 7091 | TLE4 | P12T-E | Human | Esophagus | ESCC | 8.89e-21 | 3.91e-01 | 0.1122 |
| 7091 | TLE4 | P15T-E | Human | Esophagus | ESCC | 1.22e-17 | 6.35e-01 | 0.1149 |
| Page: 1 2 3 4 5 6 7 |
| Tissue | Expression Dynamics | Abbreviation |
| Cervix | 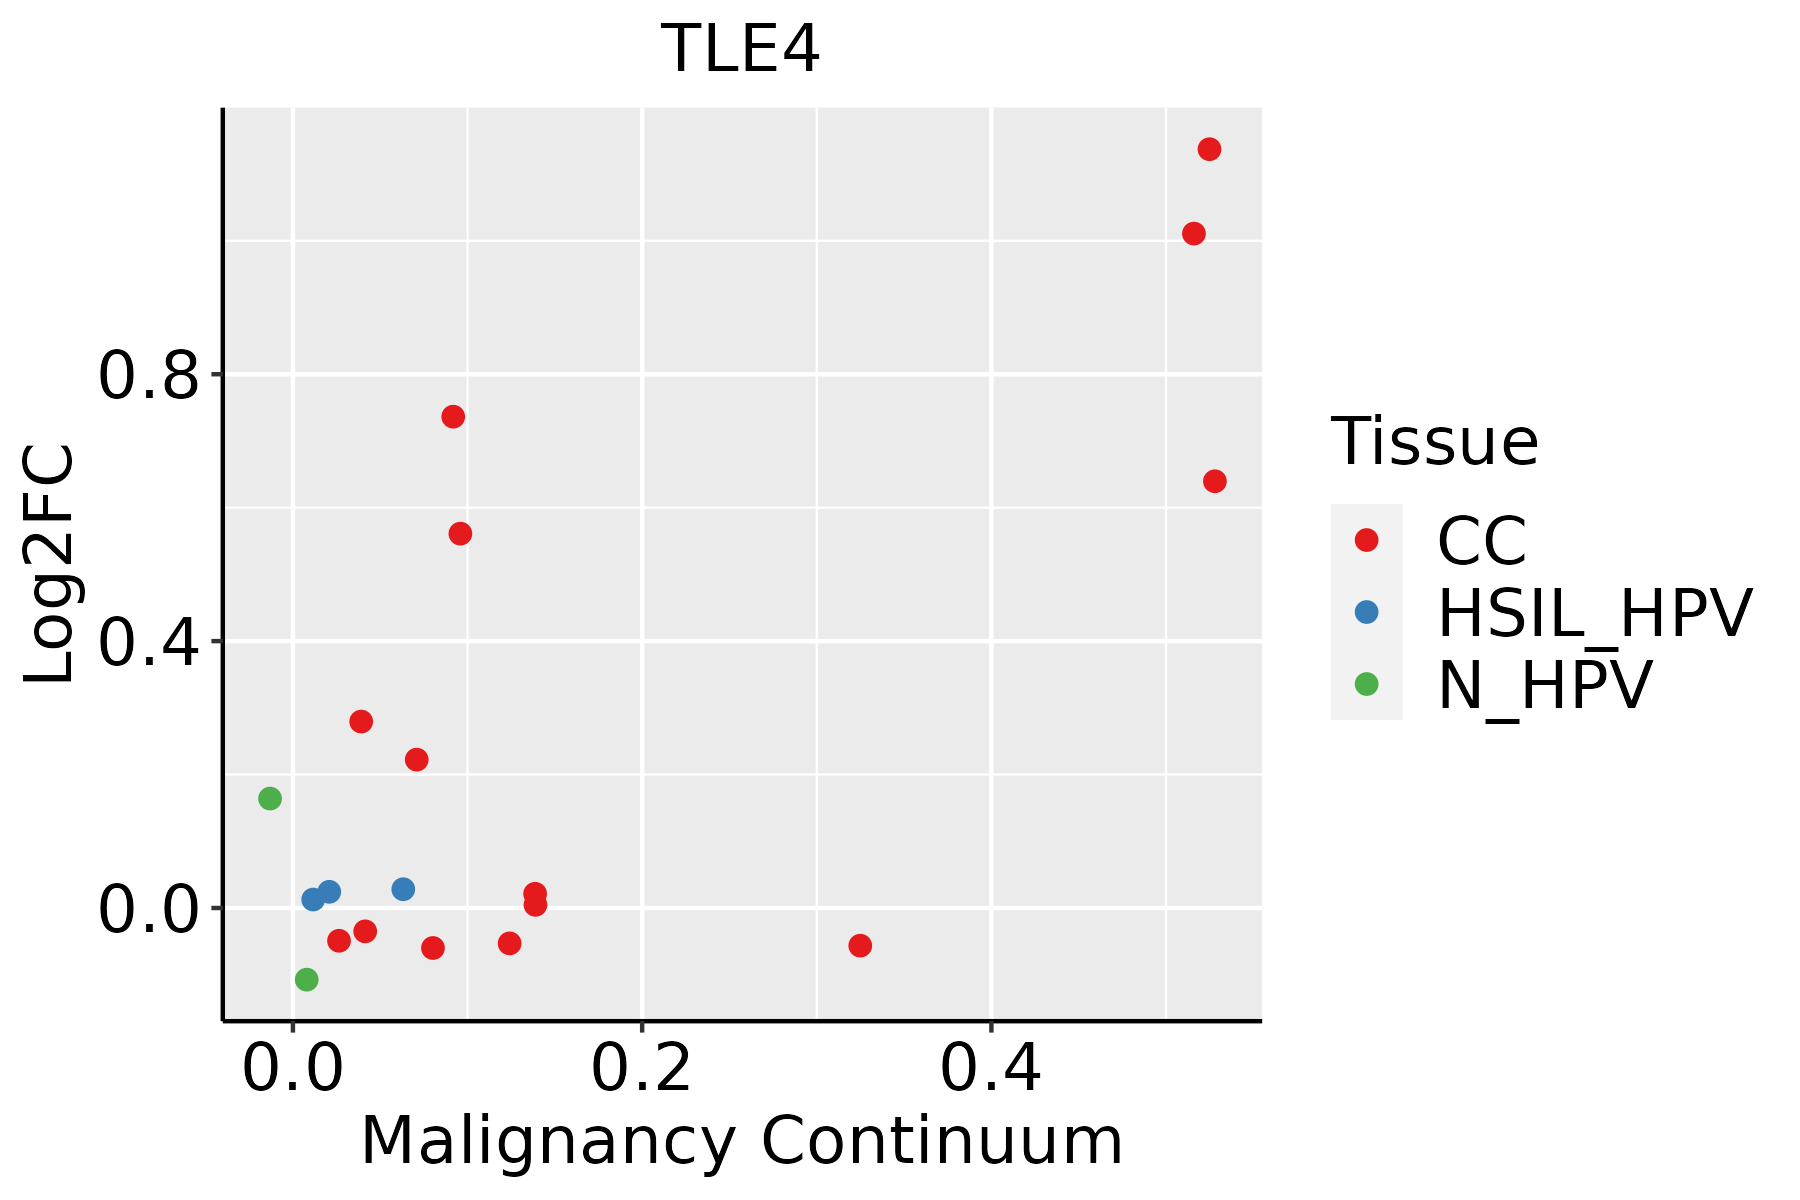 | CC: Cervix cancer |
| HSIL_HPV: HPV-infected high-grade squamous intraepithelial lesions | ||
| N_HPV: HPV-infected normal cervix | ||
| Esophagus |  | ESCC: Esophageal squamous cell carcinoma |
| HGIN: High-grade intraepithelial neoplasias | ||
| LGIN: Low-grade intraepithelial neoplasias | ||
| GC | 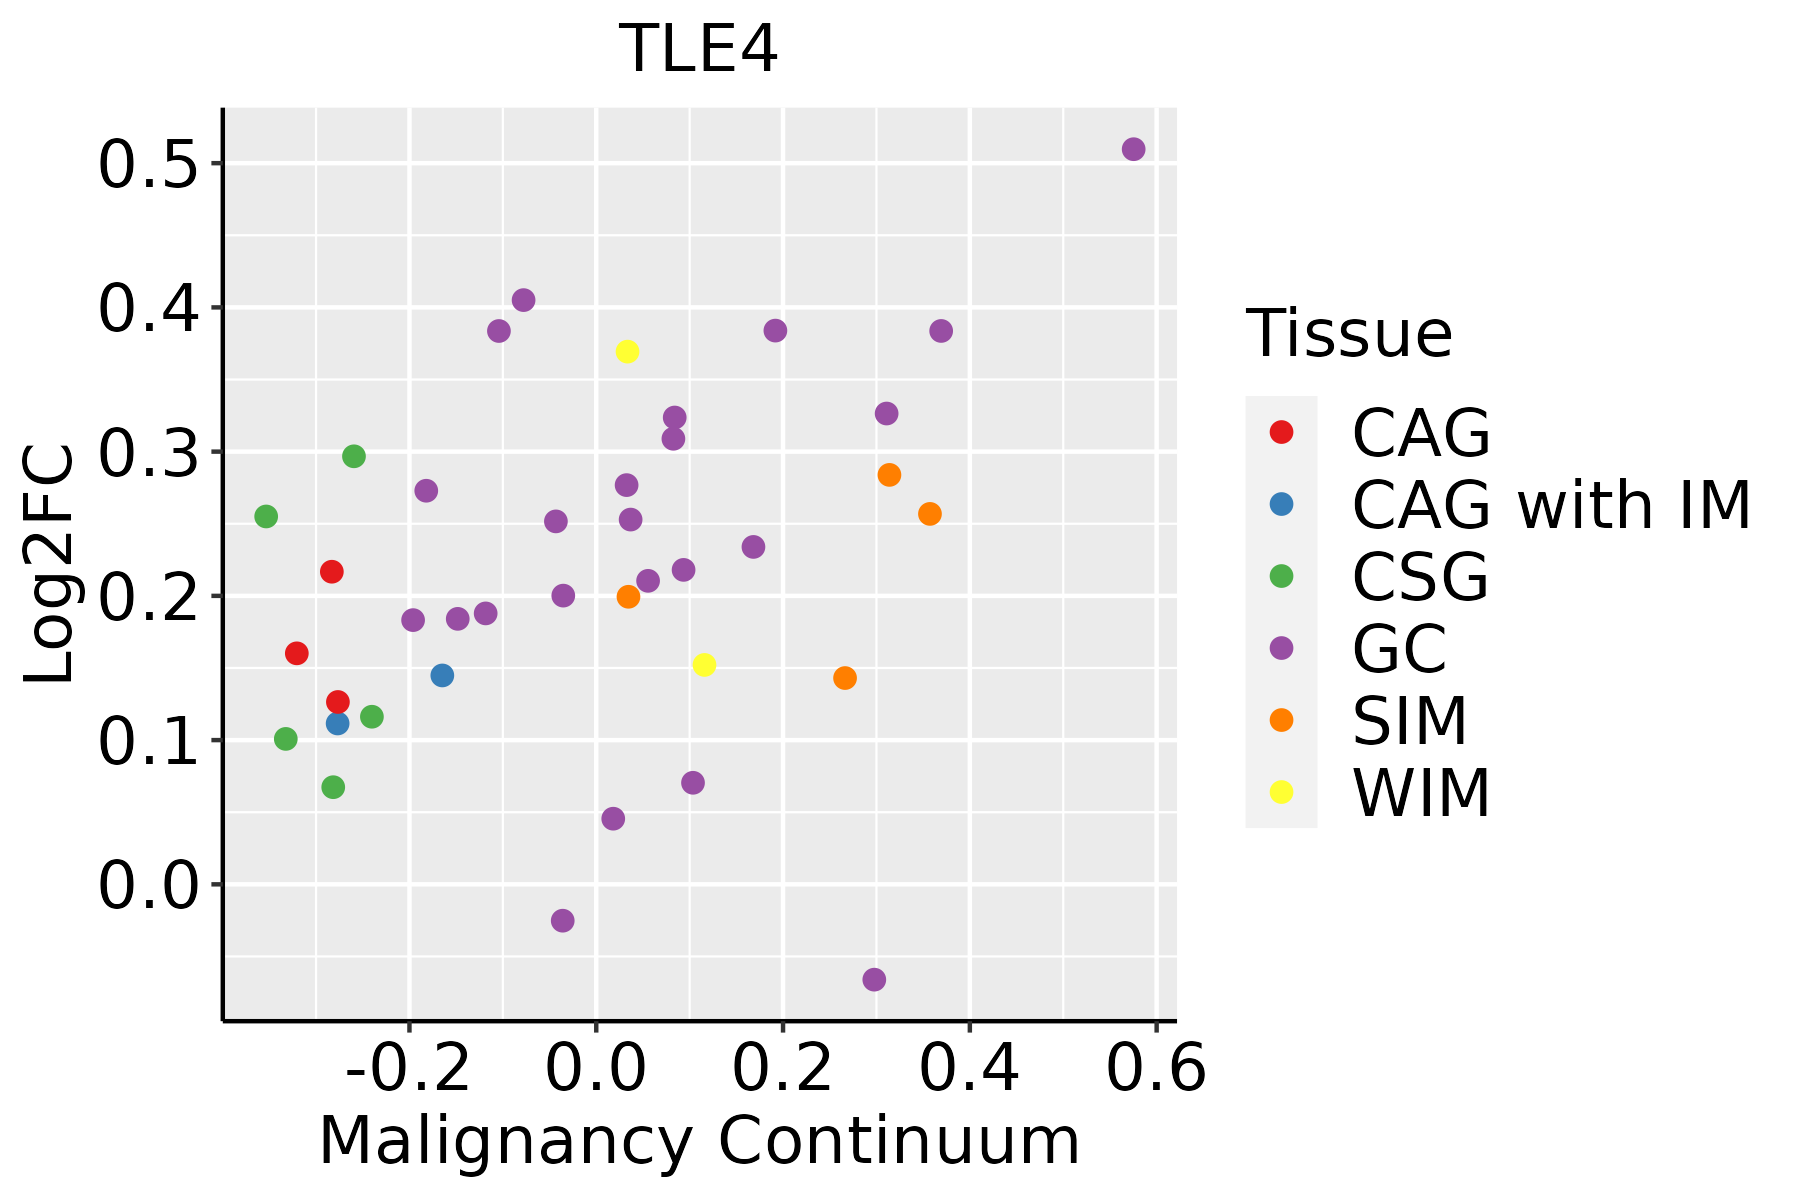 | CAG: Chronic atrophic gastritis |
| CAG with IM: Chronic atrophic gastritis with intestinal metaplasia | ||
| CSG: Chronic superficial gastritis | ||
| GC: Gastric cancer | ||
| SIM: Severe intestinal metaplasia | ||
| WIM: Wild intestinal metaplasia | ||
| Lung | 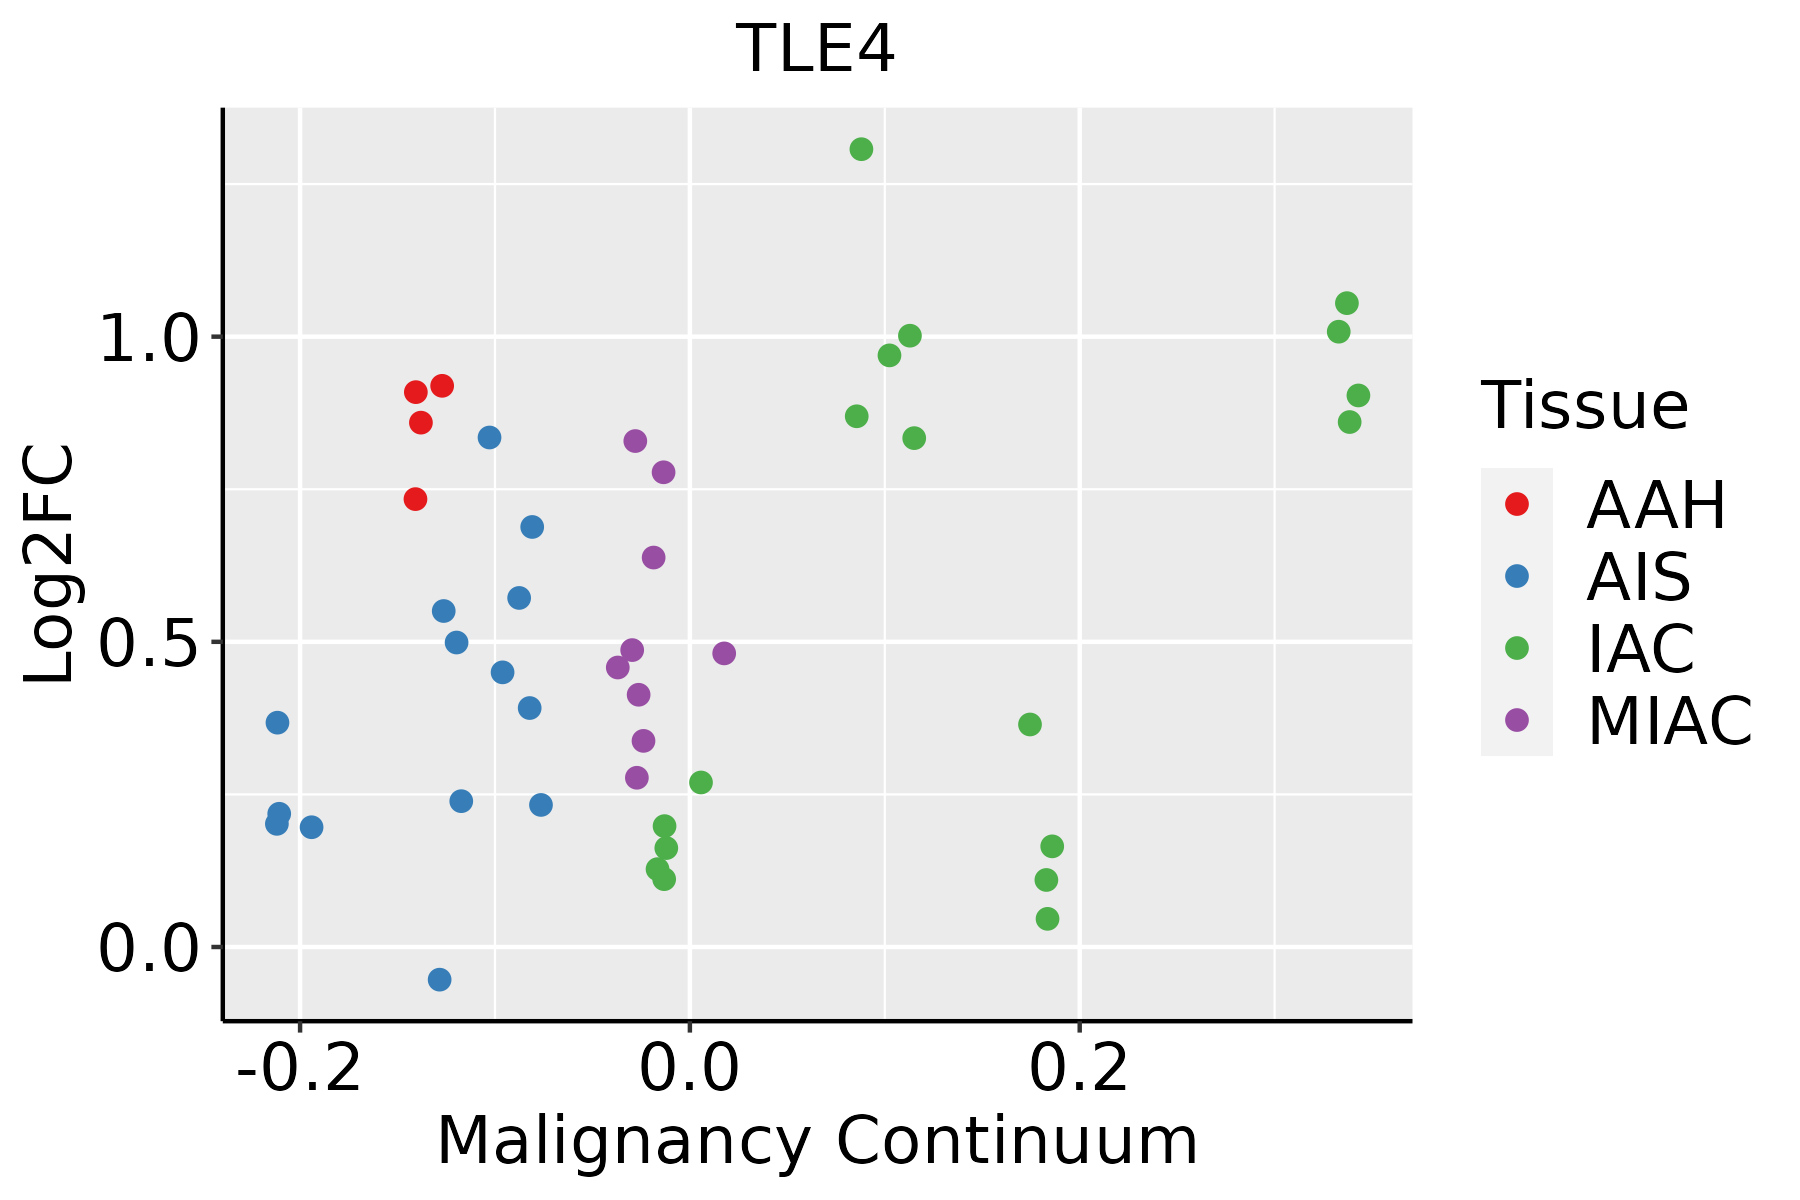 | AAH: Atypical adenomatous hyperplasia |
| AIS: Adenocarcinoma in situ | ||
| IAC: Invasive lung adenocarcinoma | ||
| MIA: Minimally invasive adenocarcinoma | ||
| Oral Cavity |  | EOLP: Erosive Oral lichen planus |
| LP: leukoplakia | ||
| NEOLP: Non-erosive oral lichen planus | ||
| OSCC: Oral squamous cell carcinoma | ||
| Skin |  | AK: Actinic keratosis |
| cSCC: Cutaneous squamous cell carcinoma | ||
| SCCIS:squamous cell carcinoma in situ | ||
| Thyroid |  | ATC: Anaplastic thyroid cancer |
| HT: Hashimoto's thyroiditis | ||
| PTC: Papillary thyroid cancer |
| ∗log2FC in expression of this searched gene in stem-like cells from each diseased tissue sample relative to stem-like cells in normal samples in each tissue plotted against the malignancy continuum. Samples are colored based on if they are from different disease stage. |
Top |
Malignant transformation related pathway analysis |
| Find out the enriched GO biological processes and KEGG pathways involved in transition from healthy to precancer to cancer |
| Tissue | Disease Stage | Enriched GO biological Processes |
| Colorectum | AD |  |
| Colorectum | SER |  |
| Colorectum | MSS |  |
| Colorectum | MSI-H |  |
| Colorectum | FAP |  |
| ∗Top 15 enriched GO BP terms are showed in the bar plot of each disease state in each tissue. Each row represents a significant GO biological process which is colored according to the -log10(p.adjust). |
| Page: 1 2 3 4 5 6 7 8 9 |
| GO ID | Tissue | Disease Stage | Description | Gene Ratio | Bg Ratio | pvalue | p.adjust | Count |
| GO:001605524 | Skin | cSCC | Wnt signaling pathway | 158/4864 | 444/18723 | 3.80e-06 | 5.70e-05 | 158 |
| GO:019873824 | Skin | cSCC | cell-cell signaling by wnt | 158/4864 | 446/18723 | 5.08e-06 | 7.38e-05 | 158 |
| GO:003011124 | Skin | cSCC | regulation of Wnt signaling pathway | 117/4864 | 328/18723 | 5.80e-05 | 5.75e-04 | 117 |
| GO:199082317 | Skin | cSCC | response to leukemia inhibitory factor | 42/4864 | 95/18723 | 8.79e-05 | 8.27e-04 | 42 |
| GO:199083016 | Skin | cSCC | cellular response to leukemia inhibitory factor | 41/4864 | 94/18723 | 1.53e-04 | 1.35e-03 | 41 |
| GO:006007024 | Skin | cSCC | canonical Wnt signaling pathway | 104/4864 | 303/18723 | 7.13e-04 | 5.03e-03 | 104 |
| GO:006082824 | Skin | cSCC | regulation of canonical Wnt signaling pathway | 87/4864 | 253/18723 | 1.74e-03 | 1.06e-02 | 87 |
| GO:1990830 | Stomach | WIM | cellular response to leukemia inhibitory factor | 8/426 | 94/18723 | 1.36e-03 | 1.86e-02 | 8 |
| GO:19908231 | Stomach | WIM | response to leukemia inhibitory factor | 8/426 | 95/18723 | 1.46e-03 | 1.97e-02 | 8 |
| GO:0016055110 | Thyroid | PTC | Wnt signaling pathway | 217/5968 | 444/18723 | 3.71e-14 | 2.30e-12 | 217 |
| GO:0198738110 | Thyroid | PTC | cell-cell signaling by wnt | 217/5968 | 446/18723 | 6.68e-14 | 3.73e-12 | 217 |
| GO:0030111110 | Thyroid | PTC | regulation of Wnt signaling pathway | 163/5968 | 328/18723 | 1.05e-11 | 4.29e-10 | 163 |
| GO:0060828110 | Thyroid | PTC | regulation of canonical Wnt signaling pathway | 123/5968 | 253/18723 | 1.83e-08 | 4.26e-07 | 123 |
| GO:0060070110 | Thyroid | PTC | canonical Wnt signaling pathway | 141/5968 | 303/18723 | 5.71e-08 | 1.21e-06 | 141 |
| GO:003017810 | Thyroid | PTC | negative regulation of Wnt signaling pathway | 74/5968 | 170/18723 | 8.99e-04 | 5.48e-03 | 74 |
| GO:00900907 | Thyroid | PTC | negative regulation of canonical Wnt signaling pathway | 59/5968 | 137/18723 | 3.76e-03 | 1.80e-02 | 59 |
| GO:199082310 | Thyroid | PTC | response to leukemia inhibitory factor | 42/5968 | 95/18723 | 7.69e-03 | 3.27e-02 | 42 |
| GO:199083010 | Thyroid | PTC | cellular response to leukemia inhibitory factor | 41/5968 | 94/18723 | 1.10e-02 | 4.38e-02 | 41 |
| GO:001605525 | Thyroid | ATC | Wnt signaling pathway | 234/6293 | 444/18723 | 4.64e-17 | 4.31e-15 | 234 |
| GO:019873825 | Thyroid | ATC | cell-cell signaling by wnt | 234/6293 | 446/18723 | 9.26e-17 | 8.25e-15 | 234 |
| Page: 1 2 3 4 5 6 |
| Pathway ID | Tissue | Disease Stage | Description | Gene Ratio | Bg Ratio | pvalue | p.adjust | qvalue | Count |
| hsa043109 | Cervix | CC | Wnt signaling pathway | 43/1267 | 171/8465 | 3.03e-04 | 1.64e-03 | 9.68e-04 | 43 |
| hsa04330 | Cervix | CC | Notch signaling pathway | 17/1267 | 62/8465 | 7.99e-03 | 2.56e-02 | 1.51e-02 | 17 |
| hsa0431012 | Cervix | CC | Wnt signaling pathway | 43/1267 | 171/8465 | 3.03e-04 | 1.64e-03 | 9.68e-04 | 43 |
| hsa043301 | Cervix | CC | Notch signaling pathway | 17/1267 | 62/8465 | 7.99e-03 | 2.56e-02 | 1.51e-02 | 17 |
| hsa043306 | Esophagus | ESCC | Notch signaling pathway | 42/4205 | 62/8465 | 2.97e-03 | 7.97e-03 | 4.08e-03 | 42 |
| hsa0433013 | Esophagus | ESCC | Notch signaling pathway | 42/4205 | 62/8465 | 2.97e-03 | 7.97e-03 | 4.08e-03 | 42 |
| hsa043108 | Lung | IAC | Wnt signaling pathway | 40/1053 | 171/8465 | 4.56e-05 | 7.06e-04 | 4.69e-04 | 40 |
| hsa0431011 | Lung | IAC | Wnt signaling pathway | 40/1053 | 171/8465 | 4.56e-05 | 7.06e-04 | 4.69e-04 | 40 |
| hsa0431021 | Lung | AIS | Wnt signaling pathway | 39/961 | 171/8465 | 1.29e-05 | 3.32e-04 | 2.12e-04 | 39 |
| hsa0431031 | Lung | AIS | Wnt signaling pathway | 39/961 | 171/8465 | 1.29e-05 | 3.32e-04 | 2.12e-04 | 39 |
| hsa0431041 | Lung | MIAC | Wnt signaling pathway | 21/507 | 171/8465 | 1.30e-03 | 1.40e-02 | 1.01e-02 | 21 |
| hsa0431051 | Lung | MIAC | Wnt signaling pathway | 21/507 | 171/8465 | 1.30e-03 | 1.40e-02 | 1.01e-02 | 21 |
| hsa043305 | Oral cavity | OSCC | Notch signaling pathway | 44/3704 | 62/8465 | 1.26e-05 | 5.55e-05 | 2.83e-05 | 44 |
| hsa0433012 | Oral cavity | OSCC | Notch signaling pathway | 44/3704 | 62/8465 | 1.26e-05 | 5.55e-05 | 2.83e-05 | 44 |
| hsa0431016 | Oral cavity | EOLP | Wnt signaling pathway | 37/1218 | 171/8465 | 6.23e-03 | 1.83e-02 | 1.08e-02 | 37 |
| hsa0431017 | Oral cavity | EOLP | Wnt signaling pathway | 37/1218 | 171/8465 | 6.23e-03 | 1.83e-02 | 1.08e-02 | 37 |
| hsa0433021 | Oral cavity | NEOLP | Notch signaling pathway | 21/1112 | 62/8465 | 2.23e-05 | 1.87e-04 | 1.18e-04 | 21 |
| hsa0431024 | Oral cavity | NEOLP | Wnt signaling pathway | 34/1112 | 171/8465 | 8.05e-03 | 2.88e-02 | 1.81e-02 | 34 |
| hsa0433031 | Oral cavity | NEOLP | Notch signaling pathway | 21/1112 | 62/8465 | 2.23e-05 | 1.87e-04 | 1.18e-04 | 21 |
| hsa0431034 | Oral cavity | NEOLP | Wnt signaling pathway | 34/1112 | 171/8465 | 8.05e-03 | 2.88e-02 | 1.81e-02 | 34 |
| Page: 1 |
Top |
Cell-cell communication analysis |
| Identification of potential cell-cell interactions between two cell types and their ligand-receptor pairs for different disease states |
| Ligand | Receptor | LRpair | Pathway | Tissue | Disease Stage |
| Page: 1 |
Top |
Single-cell gene regulatory network inference analysis |
| Find out the significant the regulons (TFs) and the target genes of each regulon across cell types for different disease states |
| TF | Cell Type | Tissue | Disease Stage | Target Gene | RSS | Regulon Activity |
| ∗The dot plots of a searched regulon are shown for all cell subpopulations in each disease state of each tissue based on the regulon specific score inferred using pySCENIC and by calculating the average expression. |
| Page: 1 |
Top |
Somatic mutation of malignant transformation related genes |
| Annotation of somatic variants for genes involved in malignant transformation |
| Hugo Symbol | Variant Class | Variant Classification | dbSNP RS | HGVSc | HGVSp | HGVSp Short | SWISSPROT | BIOTYPE | SIFT | PolyPhen | Tumor Sample Barcode | Tissue | Histology | Sex | Age | Stage | Therapy Types | Drugs | Outcome |
| TLE4 | SNV | Missense_Mutation | c.1360N>C | p.Val454Leu | p.V454L | Q04727 | protein_coding | tolerated(0.09) | benign(0.02) | TCGA-A8-A09A-01 | Breast | breast invasive carcinoma | Female | <65 | I/II | Hormone Therapy | tamoxiphen | SD | |
| TLE4 | SNV | Missense_Mutation | c.1054N>T | p.Val352Phe | p.V352F | Q04727 | protein_coding | tolerated(0.25) | possibly_damaging(0.5) | TCGA-AN-A0AT-01 | Breast | breast invasive carcinoma | Female | <65 | I/II | Unknown | Unknown | SD | |
| TLE4 | SNV | Missense_Mutation | novel | c.934N>T | p.Leu312Phe | p.L312F | Q04727 | protein_coding | tolerated(0.21) | benign(0.323) | TCGA-S3-AA12-01 | Breast | breast invasive carcinoma | Female | >=65 | III/IV | Hormone Therapy | anastrozole | SD |
| TLE4 | insertion | Nonsense_Mutation | novel | c.539_540insAATATTTCAGGGTCTGCAGTTAGCTAGGATTTGTGAGATGTAGA | p.His181IlefsTer14 | p.H181Ifs*14 | Q04727 | protein_coding | TCGA-B6-A0IA-01 | Breast | breast invasive carcinoma | Female | <65 | I/II | Unknown | Unknown | SD | ||
| TLE4 | SNV | Missense_Mutation | rs753600409 | c.1507N>A | p.Gly503Arg | p.G503R | Q04727 | protein_coding | deleterious(0) | probably_damaging(0.999) | TCGA-2W-A8YY-01 | Cervix | cervical & endocervical cancer | Female | <65 | I/II | Chemotherapy | cisplatin | CR |
| TLE4 | SNV | Missense_Mutation | c.1087N>A | p.Asp363Asn | p.D363N | Q04727 | protein_coding | deleterious(0.04) | possibly_damaging(0.627) | TCGA-IR-A3LA-01 | Cervix | cervical & endocervical cancer | Female | <65 | I/II | Chemotherapy | cisplatin | CR | |
| TLE4 | SNV | Missense_Mutation | c.1293C>G | p.Ile431Met | p.I431M | Q04727 | protein_coding | tolerated(0.55) | benign(0.007) | TCGA-IR-A3LK-01 | Cervix | cervical & endocervical cancer | Female | >=65 | I/II | Chemotherapy | cisplatin | PD | |
| TLE4 | SNV | Missense_Mutation | c.1171A>G | p.Ser391Gly | p.S391G | Q04727 | protein_coding | tolerated(1) | benign(0) | TCGA-Q1-A6DT-01 | Cervix | cervical & endocervical cancer | Female | <65 | I/II | Unknown | Unknown | PD | |
| TLE4 | SNV | Missense_Mutation | c.925N>C | p.Glu309Gln | p.E309Q | Q04727 | protein_coding | tolerated(0.11) | benign(0.444) | TCGA-VS-A8EL-01 | Cervix | cervical & endocervical cancer | Female | <65 | I/II | Chemotherapy | cisplatin | CR | |
| TLE4 | SNV | Missense_Mutation | rs771669600 | c.1246N>A | p.Gly416Arg | p.G416R | Q04727 | protein_coding | deleterious(0) | probably_damaging(0.986) | TCGA-AA-3495-01 | Colorectum | colon adenocarcinoma | Male | >=65 | I/II | Unknown | Unknown | SD |
| Page: 1 2 3 4 5 6 7 8 9 10 11 12 13 14 |
Top |
Related drugs of malignant transformation related genes |
| Identification of chemicals and drugs interact with genes involved in malignant transfromation |
| (DGIdb 4.0) |
| Entrez ID | Symbol | Category | Interaction Types | Drug Claim Name | Drug Name | PMIDs |
| Page: 1 |

Copyright 2023-Present -The University of Texas Health Science Center at Houston |