
|
|||||
|
 | |
| |
| |
| |
| |
| |
|
Gene: TIMM50 |
Gene summary for TIMM50 |
| Gene information | Species | Human | Gene symbol | TIMM50 | Gene ID | 92609 |
| Gene name | translocase of inner mitochondrial membrane 50 | |
| Gene Alias | MGCA9 | |
| Cytomap | 19q13.2 | |
| Gene Type | protein-coding | GO ID | GO:0001836 | UniProtAcc | A0A024R0M6 |
Top |
Malignant transformation analysis |
| Identification of the aberrant gene expression in precancerous and cancerous lesions by comparing the gene expression of stem-like cells in diseased tissues with normal stem cells |
| Entrez ID | Symbol | Replicates | Species | Organ | Tissue | Adj P-value | Log2FC | Malignancy |
| 92609 | TIMM50 | LZE4T | Human | Esophagus | ESCC | 6.44e-11 | 2.36e-01 | 0.0811 |
| 92609 | TIMM50 | LZE7T | Human | Esophagus | ESCC | 1.02e-11 | 7.33e-01 | 0.0667 |
| 92609 | TIMM50 | LZE8T | Human | Esophagus | ESCC | 4.09e-09 | 4.07e-01 | 0.067 |
| 92609 | TIMM50 | LZE24T | Human | Esophagus | ESCC | 2.50e-13 | 5.09e-01 | 0.0596 |
| 92609 | TIMM50 | LZE6T | Human | Esophagus | ESCC | 1.10e-09 | 5.03e-01 | 0.0845 |
| 92609 | TIMM50 | P1T-E | Human | Esophagus | ESCC | 2.43e-17 | 9.39e-01 | 0.0875 |
| 92609 | TIMM50 | P2T-E | Human | Esophagus | ESCC | 1.43e-38 | 6.41e-01 | 0.1177 |
| 92609 | TIMM50 | P4T-E | Human | Esophagus | ESCC | 4.07e-39 | 8.79e-01 | 0.1323 |
| 92609 | TIMM50 | P5T-E | Human | Esophagus | ESCC | 3.92e-40 | 8.57e-01 | 0.1327 |
| 92609 | TIMM50 | P8T-E | Human | Esophagus | ESCC | 3.86e-55 | 1.07e+00 | 0.0889 |
| 92609 | TIMM50 | P9T-E | Human | Esophagus | ESCC | 6.76e-19 | 6.03e-01 | 0.1131 |
| 92609 | TIMM50 | P10T-E | Human | Esophagus | ESCC | 1.79e-59 | 1.04e+00 | 0.116 |
| 92609 | TIMM50 | P11T-E | Human | Esophagus | ESCC | 1.00e-22 | 8.90e-01 | 0.1426 |
| 92609 | TIMM50 | P12T-E | Human | Esophagus | ESCC | 1.11e-40 | 8.07e-01 | 0.1122 |
| 92609 | TIMM50 | P15T-E | Human | Esophagus | ESCC | 1.49e-40 | 9.24e-01 | 0.1149 |
| 92609 | TIMM50 | P16T-E | Human | Esophagus | ESCC | 9.04e-36 | 5.33e-01 | 0.1153 |
| 92609 | TIMM50 | P17T-E | Human | Esophagus | ESCC | 2.71e-18 | 9.01e-01 | 0.1278 |
| 92609 | TIMM50 | P19T-E | Human | Esophagus | ESCC | 4.92e-12 | 1.34e+00 | 0.1662 |
| 92609 | TIMM50 | P20T-E | Human | Esophagus | ESCC | 1.03e-26 | 6.33e-01 | 0.1124 |
| 92609 | TIMM50 | P21T-E | Human | Esophagus | ESCC | 4.47e-27 | 6.28e-01 | 0.1617 |
| Page: 1 2 3 4 5 6 |
| Tissue | Expression Dynamics | Abbreviation |
| Esophagus | 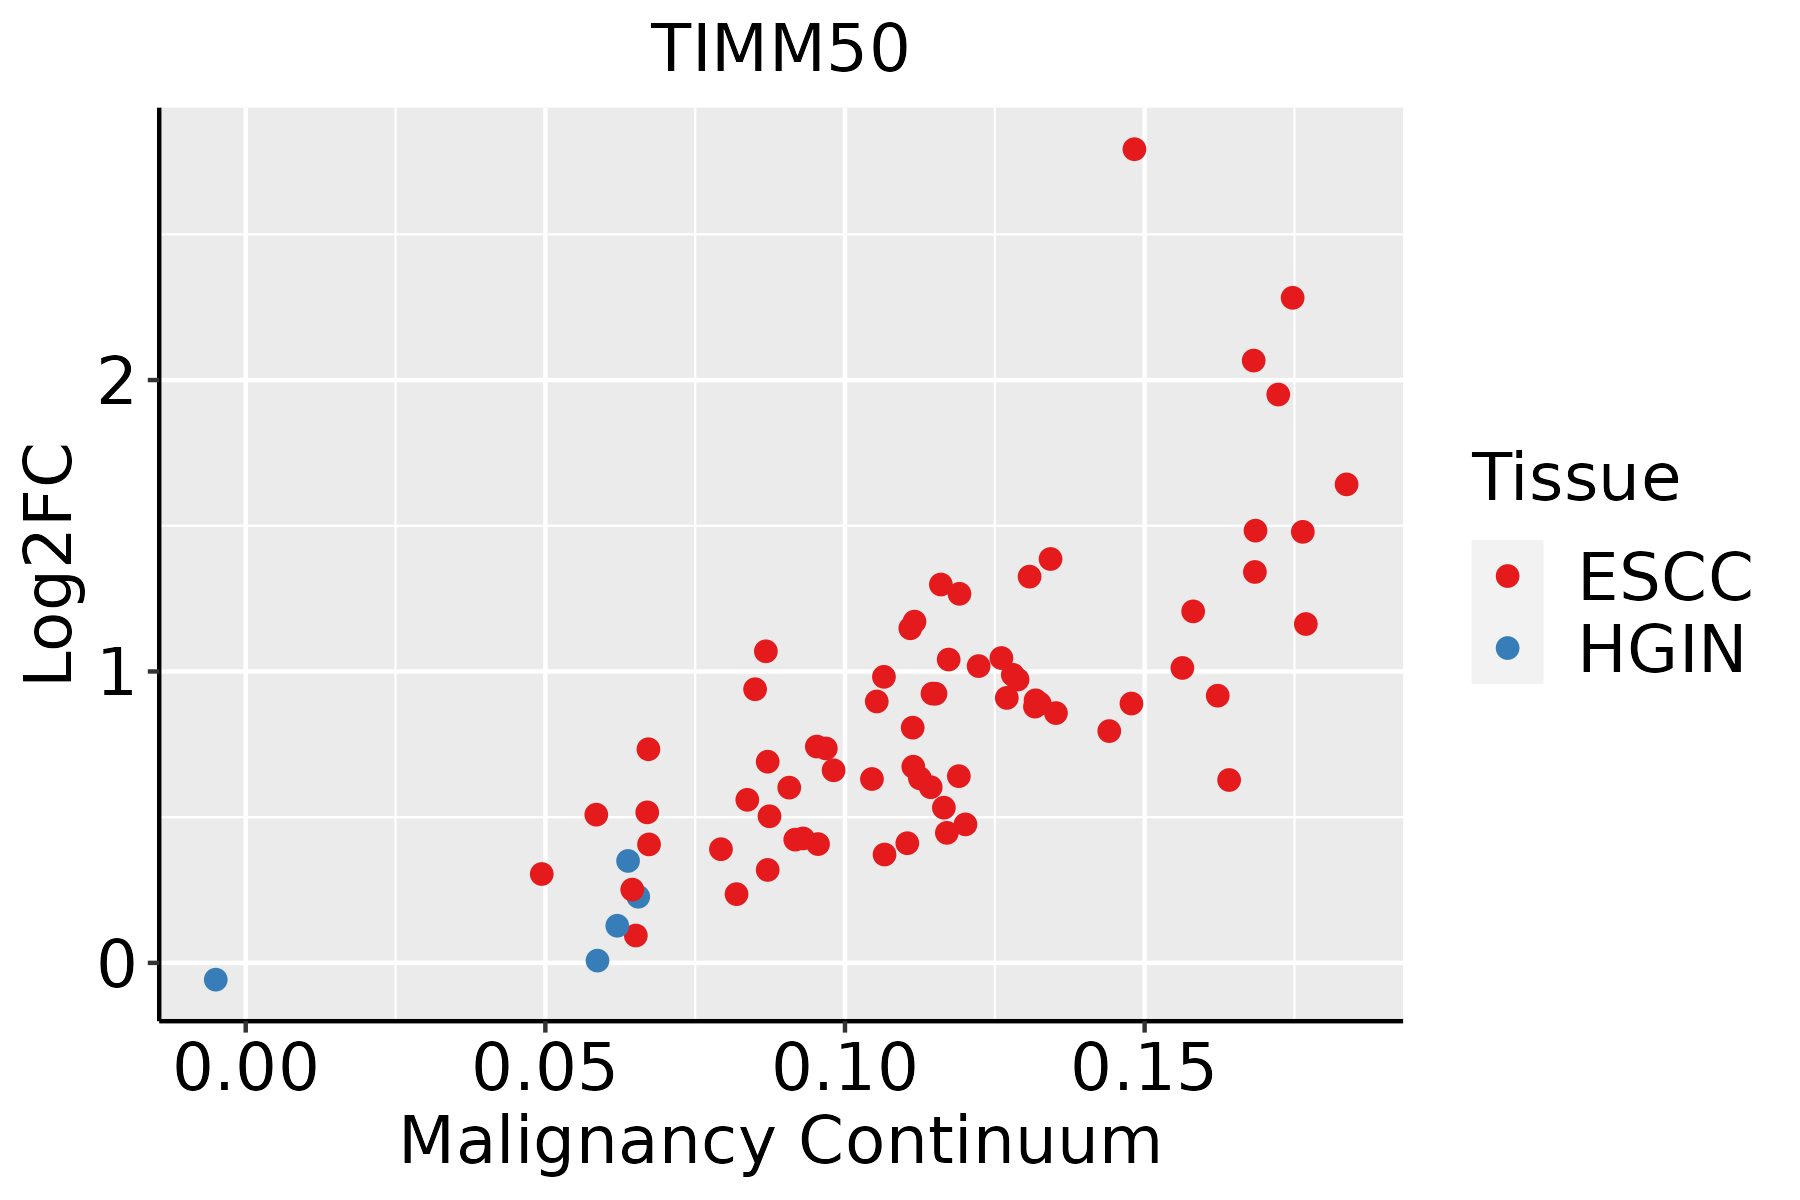 | ESCC: Esophageal squamous cell carcinoma |
| HGIN: High-grade intraepithelial neoplasias | ||
| LGIN: Low-grade intraepithelial neoplasias | ||
| Liver |  | HCC: Hepatocellular carcinoma |
| NAFLD: Non-alcoholic fatty liver disease | ||
| Oral Cavity | 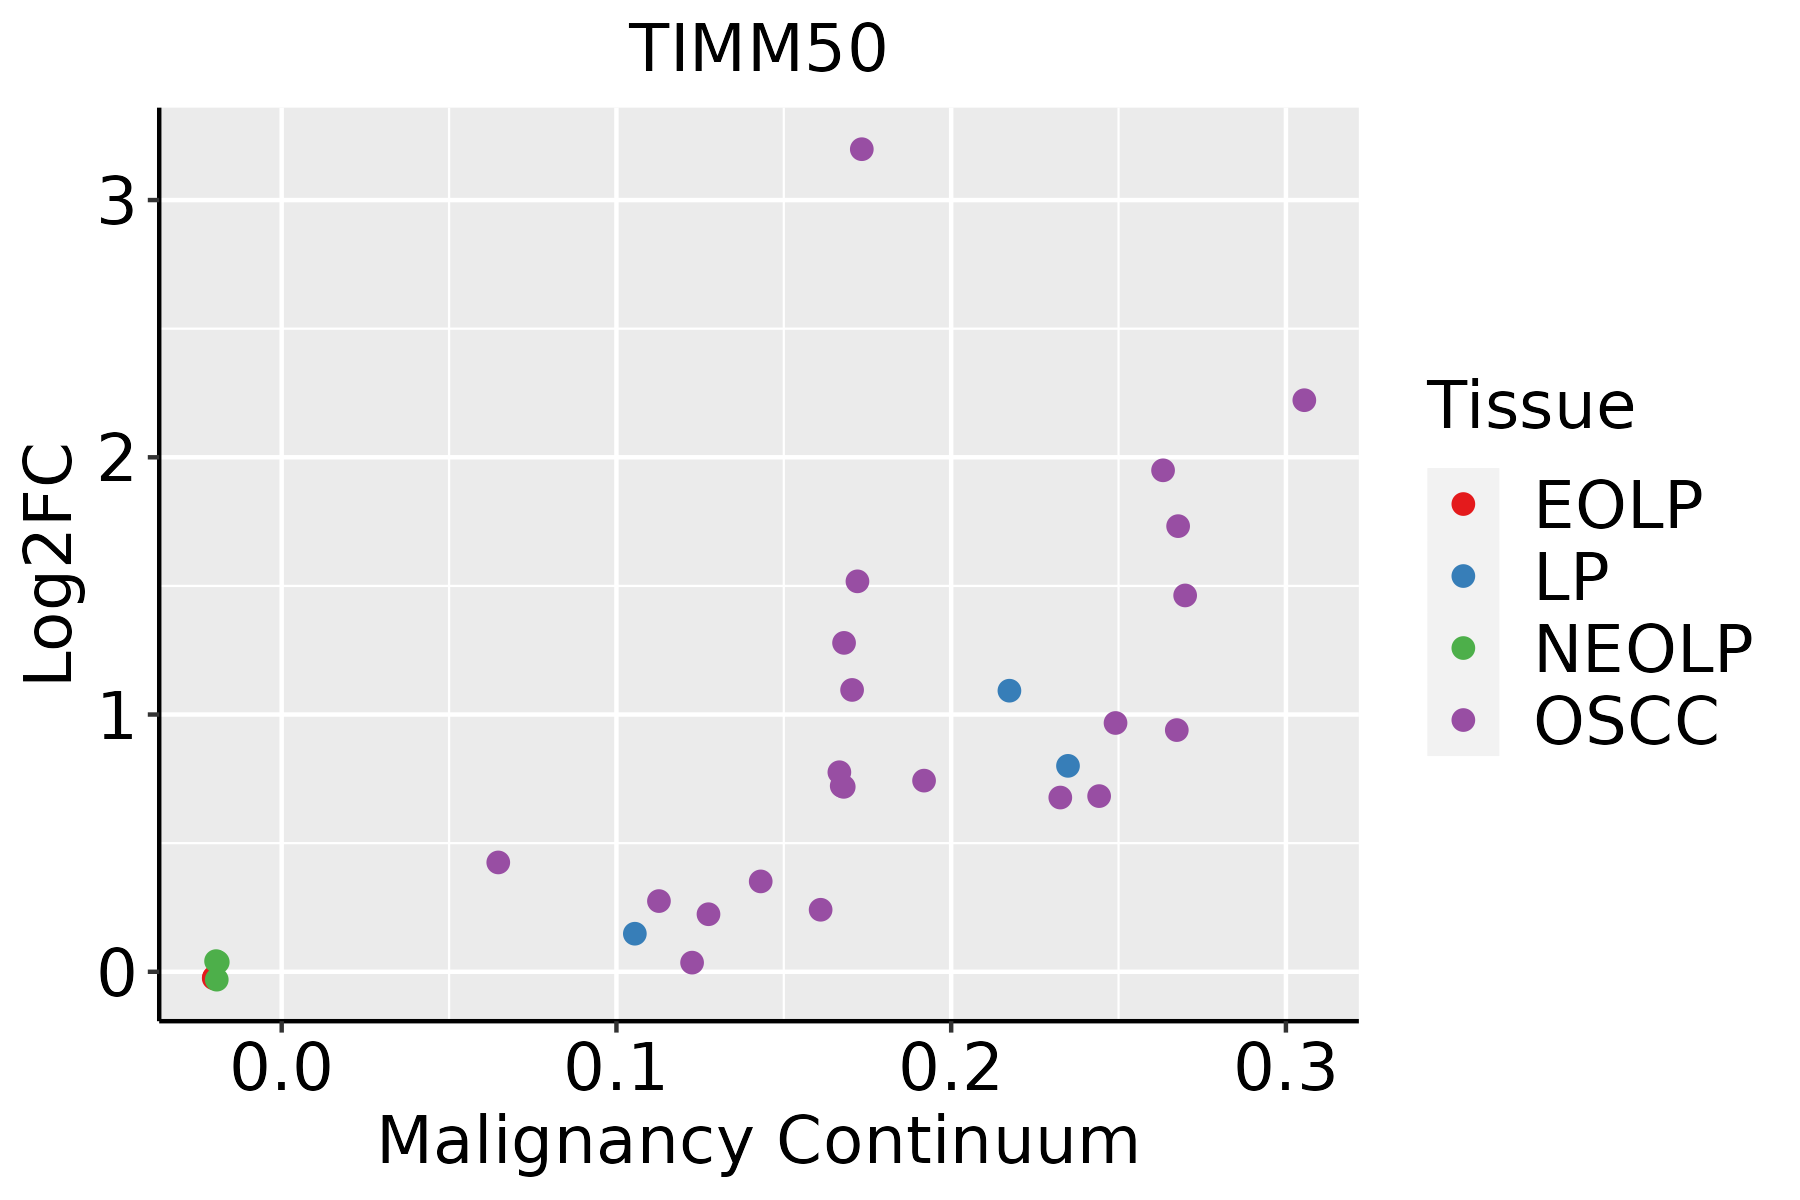 | EOLP: Erosive Oral lichen planus |
| LP: leukoplakia | ||
| NEOLP: Non-erosive oral lichen planus | ||
| OSCC: Oral squamous cell carcinoma | ||
| Skin | 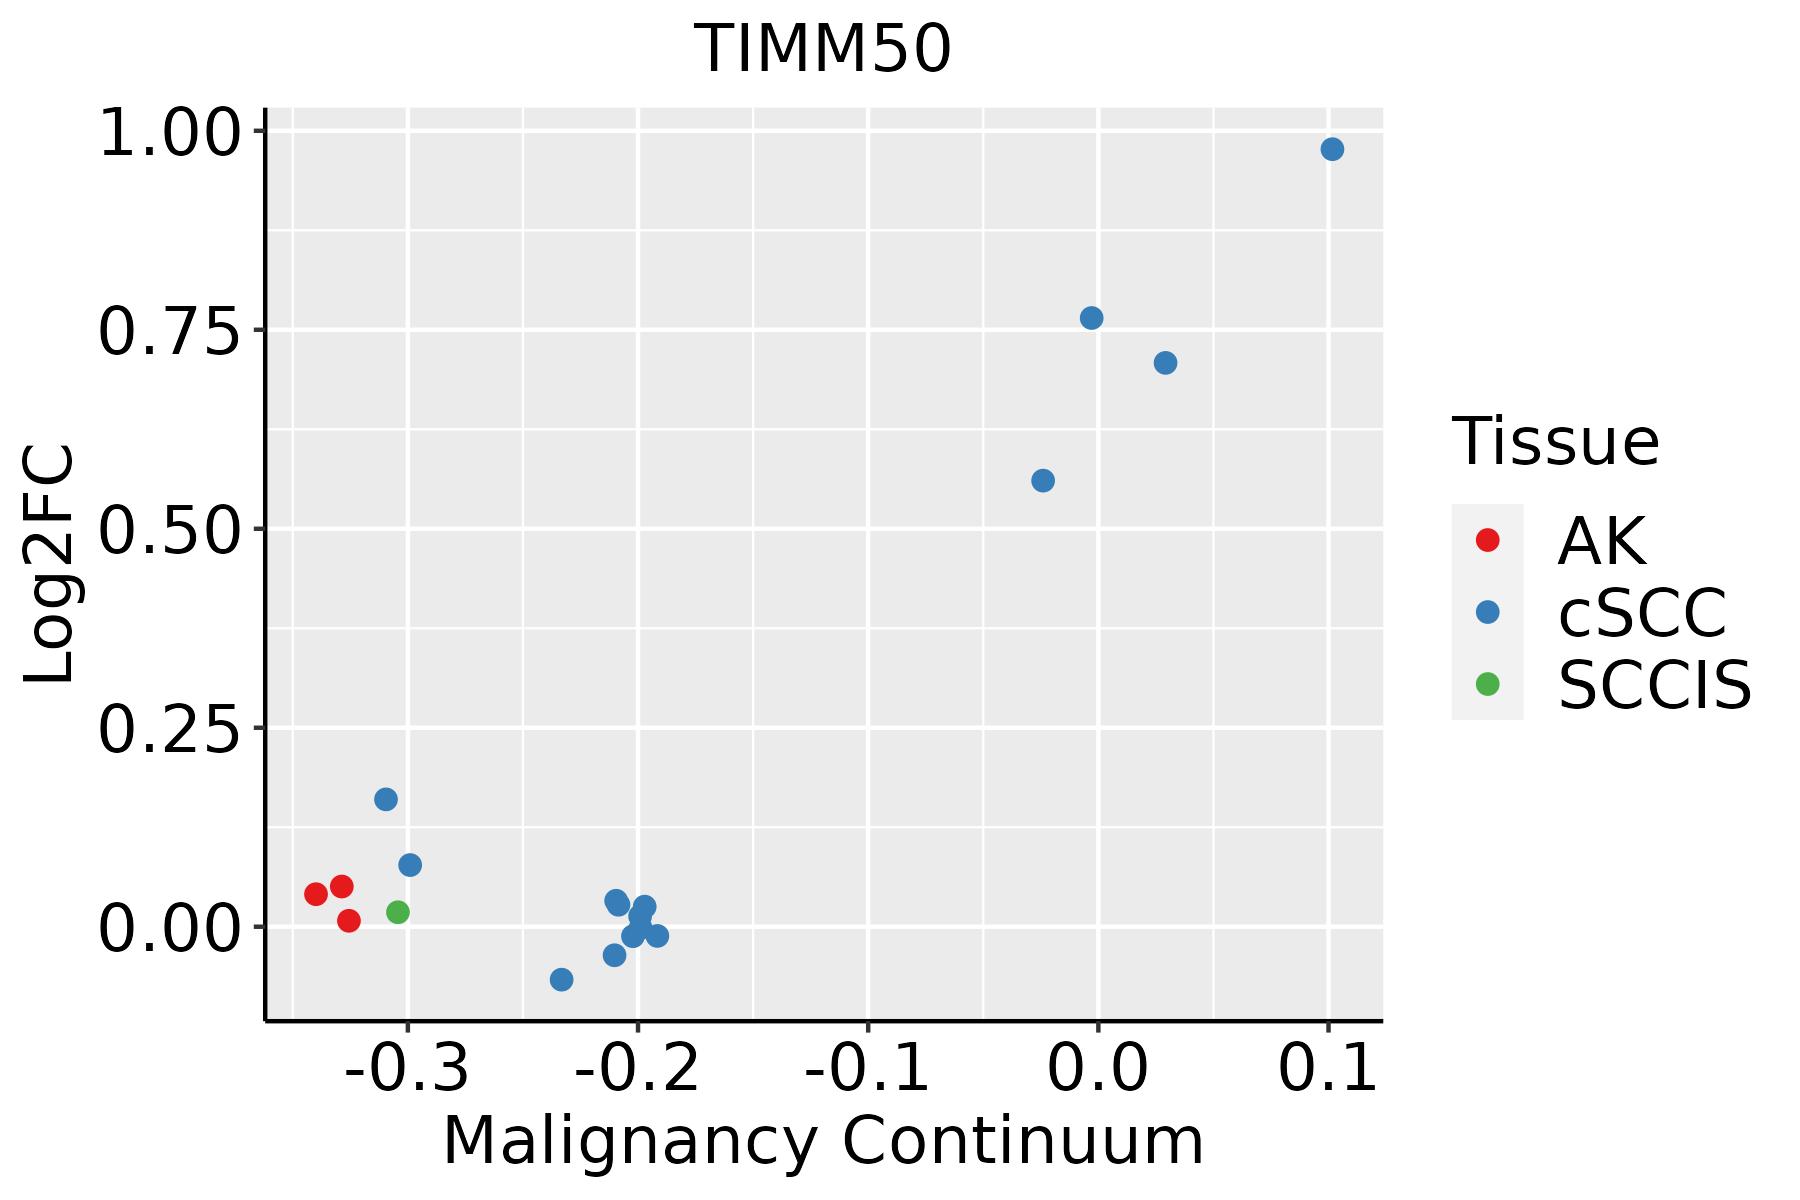 | AK: Actinic keratosis |
| cSCC: Cutaneous squamous cell carcinoma | ||
| SCCIS:squamous cell carcinoma in situ | ||
| Thyroid | 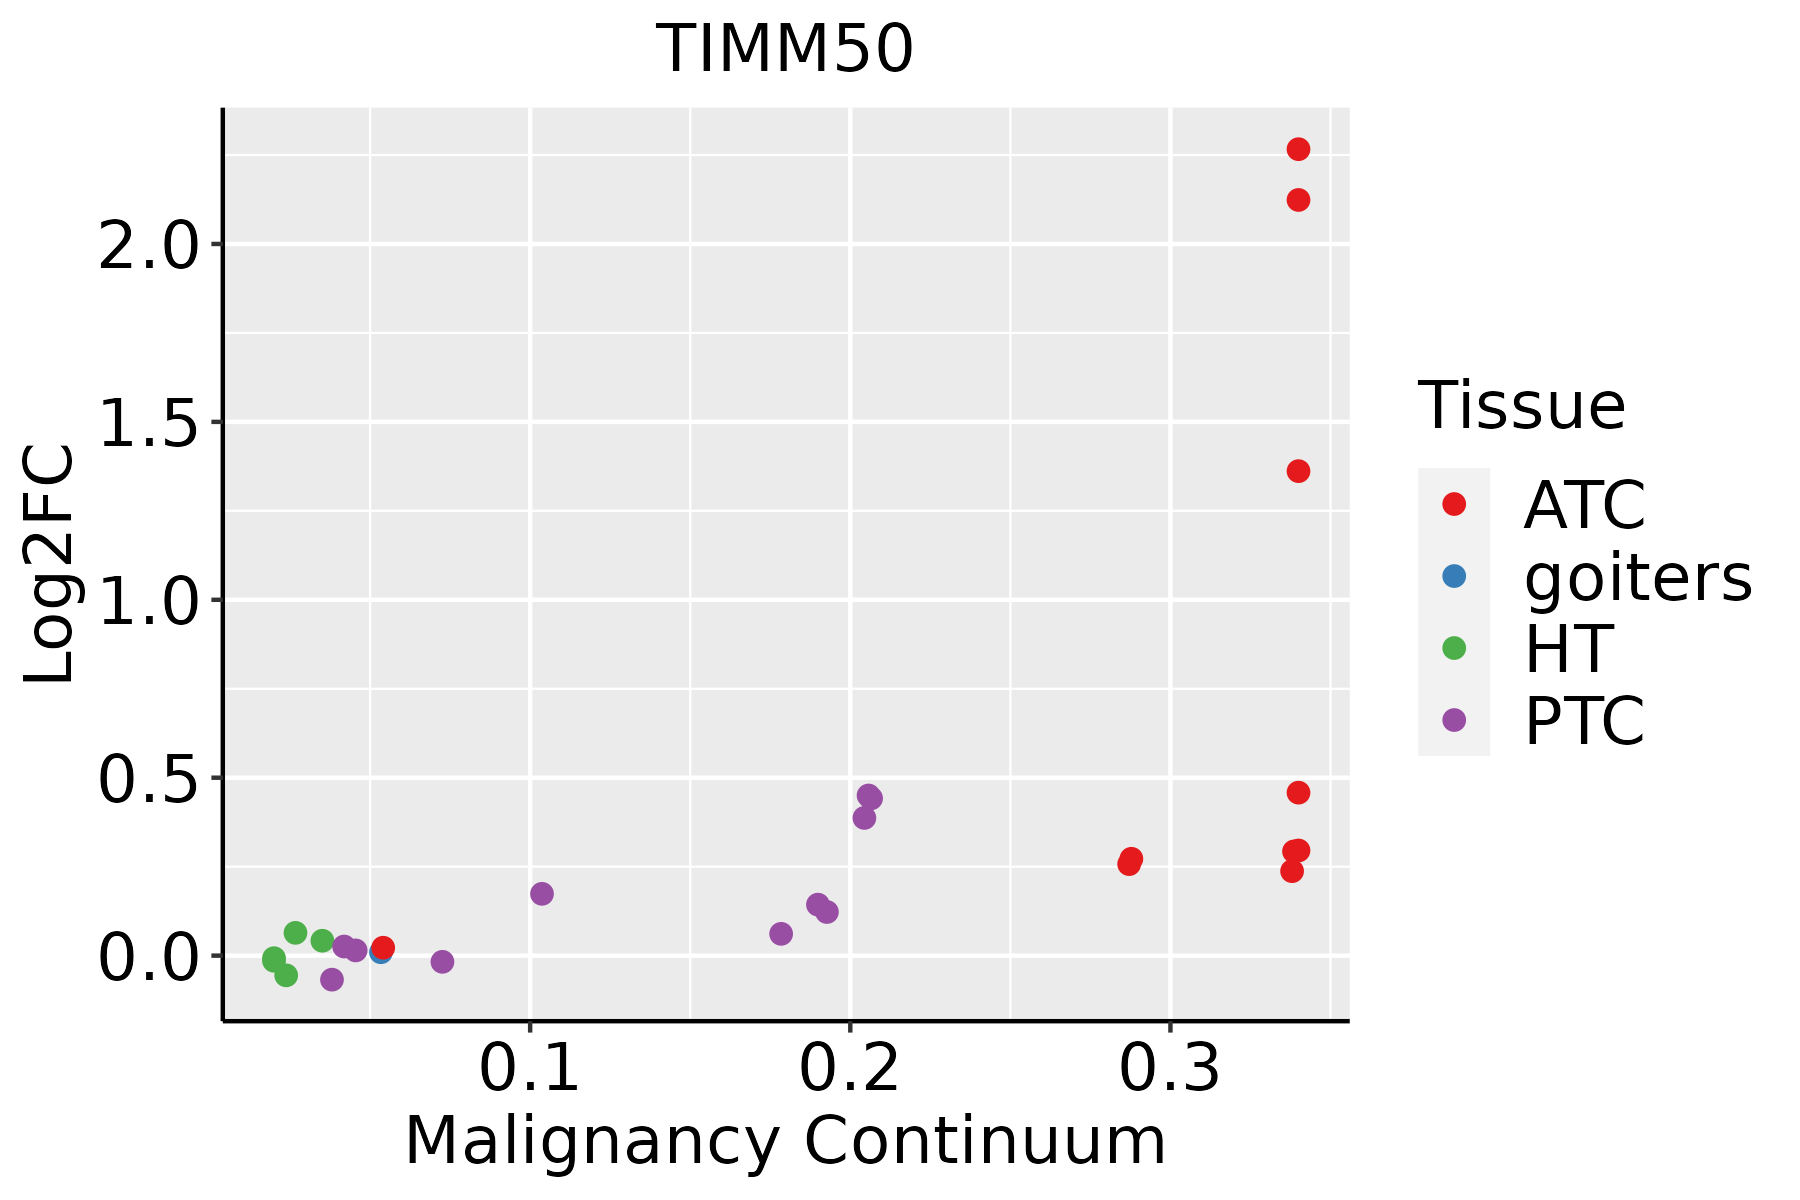 | ATC: Anaplastic thyroid cancer |
| HT: Hashimoto's thyroiditis | ||
| PTC: Papillary thyroid cancer |
| ∗log2FC in expression of this searched gene in stem-like cells from each diseased tissue sample relative to stem-like cells in normal samples in each tissue plotted against the malignancy continuum. Samples are colored based on if they are from different disease stage. |
Top |
Malignant transformation related pathway analysis |
| Find out the enriched GO biological processes and KEGG pathways involved in transition from healthy to precancer to cancer |
| Tissue | Disease Stage | Enriched GO biological Processes |
| Colorectum | AD |  |
| Colorectum | SER |  |
| Colorectum | MSS |  |
| Colorectum | MSI-H |  |
| Colorectum | FAP |  |
| ∗Top 15 enriched GO BP terms are showed in the bar plot of each disease state in each tissue. Each row represents a significant GO biological process which is colored according to the -log10(p.adjust). |
| Page: 1 2 3 4 5 6 7 8 9 |
| GO ID | Tissue | Disease Stage | Description | Gene Ratio | Bg Ratio | pvalue | p.adjust | Count |
| GO:00301502 | Oral cavity | LP | protein import into mitochondrial matrix | 13/4623 | 20/18723 | 1.59e-04 | 1.79e-03 | 13 |
| GO:000647016 | Oral cavity | LP | protein dephosphorylation | 89/4623 | 281/18723 | 4.60e-03 | 2.93e-02 | 89 |
| GO:199054219 | Oral cavity | LP | mitochondrial transmembrane transport | 37/4623 | 102/18723 | 5.93e-03 | 3.53e-02 | 37 |
| GO:007259427 | Skin | cSCC | establishment of protein localization to organelle | 213/4864 | 422/18723 | 1.40e-27 | 5.15e-25 | 213 |
| GO:000660527 | Skin | cSCC | protein targeting | 153/4864 | 314/18723 | 2.62e-18 | 3.36e-16 | 153 |
| GO:000683927 | Skin | cSCC | mitochondrial transport | 124/4864 | 254/18723 | 3.54e-15 | 2.81e-13 | 124 |
| GO:007058525 | Skin | cSCC | protein localization to mitochondrion | 74/4864 | 125/18723 | 3.95e-15 | 3.06e-13 | 74 |
| GO:007265525 | Skin | cSCC | establishment of protein localization to mitochondrion | 71/4864 | 120/18723 | 1.48e-14 | 1.04e-12 | 71 |
| GO:000662624 | Skin | cSCC | protein targeting to mitochondrion | 61/4864 | 100/18723 | 1.53e-13 | 9.32e-12 | 61 |
| GO:0017038110 | Skin | cSCC | protein import | 100/4864 | 206/18723 | 2.50e-12 | 1.36e-10 | 100 |
| GO:0007006110 | Skin | cSCC | mitochondrial membrane organization | 64/4864 | 116/18723 | 2.16e-11 | 1.08e-09 | 64 |
| GO:000863726 | Skin | cSCC | apoptotic mitochondrial changes | 55/4864 | 107/18723 | 1.63e-08 | 4.91e-07 | 55 |
| GO:000647024 | Skin | cSCC | protein dephosphorylation | 111/4864 | 281/18723 | 4.10e-07 | 7.96e-06 | 111 |
| GO:0001836110 | Skin | cSCC | release of cytochrome c from mitochondria | 33/4864 | 59/18723 | 9.93e-07 | 1.78e-05 | 33 |
| GO:007180610 | Skin | cSCC | protein transmembrane transport | 33/4864 | 59/18723 | 9.93e-07 | 1.78e-05 | 33 |
| GO:00650027 | Skin | cSCC | intracellular protein transmembrane transport | 28/4864 | 51/18723 | 1.05e-05 | 1.37e-04 | 28 |
| GO:199054224 | Skin | cSCC | mitochondrial transmembrane transport | 43/4864 | 102/18723 | 2.68e-04 | 2.16e-03 | 43 |
| GO:00301504 | Skin | cSCC | protein import into mitochondrial matrix | 12/4864 | 20/18723 | 1.34e-03 | 8.54e-03 | 12 |
| GO:00447434 | Skin | cSCC | protein transmembrane import into intracellular organelle | 18/4864 | 36/18723 | 1.70e-03 | 1.04e-02 | 18 |
| GO:001631115 | Skin | cSCC | dephosphorylation | 134/4864 | 417/18723 | 2.65e-03 | 1.50e-02 | 134 |
| Page: 1 2 3 4 5 6 7 |
| Pathway ID | Tissue | Disease Stage | Description | Gene Ratio | Bg Ratio | pvalue | p.adjust | qvalue | Count |
| Page: 1 |
Top |
Cell-cell communication analysis |
| Identification of potential cell-cell interactions between two cell types and their ligand-receptor pairs for different disease states |
| Ligand | Receptor | LRpair | Pathway | Tissue | Disease Stage |
| Page: 1 |
Top |
Single-cell gene regulatory network inference analysis |
| Find out the significant the regulons (TFs) and the target genes of each regulon across cell types for different disease states |
| TF | Cell Type | Tissue | Disease Stage | Target Gene | RSS | Regulon Activity |
| ∗The dot plots of a searched regulon are shown for all cell subpopulations in each disease state of each tissue based on the regulon specific score inferred using pySCENIC and by calculating the average expression. |
| Page: 1 |
Top |
Somatic mutation of malignant transformation related genes |
| Annotation of somatic variants for genes involved in malignant transformation |
| Hugo Symbol | Variant Class | Variant Classification | dbSNP RS | HGVSc | HGVSp | HGVSp Short | SWISSPROT | BIOTYPE | SIFT | PolyPhen | Tumor Sample Barcode | Tissue | Histology | Sex | Age | Stage | Therapy Types | Drugs | Outcome |
| TIMM50 | SNV | Missense_Mutation | c.184N>C | p.Asp62His | p.D62H | Q3ZCQ8 | protein_coding | deleterious_low_confidence(0) | benign(0.154) | TCGA-BH-A0DZ-01 | Breast | breast invasive carcinoma | Female | <65 | I/II | Chemotherapy | docetaxel | SD | |
| TIMM50 | SNV | Missense_Mutation | rs755137391 | c.1336N>C | p.Thr446Pro | p.T446P | Q3ZCQ8 | protein_coding | deleterious(0) | possibly_damaging(0.698) | TCGA-D8-A1JM-01 | Breast | breast invasive carcinoma | Female | <65 | I/II | ChemotherapyHormone Therapy | doxorubicine | SD |
| TIMM50 | SNV | Missense_Mutation | rs755137391 | c.1336N>C | p.Thr446Pro | p.T446P | Q3ZCQ8 | protein_coding | deleterious(0) | possibly_damaging(0.698) | TCGA-E2-A1LA-01 | Breast | breast invasive carcinoma | Female | <65 | I/II | Hormone Therapy | arimidex | SD |
| TIMM50 | SNV | Missense_Mutation | rs202166024 | c.1355N>A | p.Arg452His | p.R452H | Q3ZCQ8 | protein_coding | deleterious_low_confidence(0) | probably_damaging(0.917) | TCGA-2W-A8YY-01 | Cervix | cervical & endocervical cancer | Female | <65 | I/II | Chemotherapy | cisplatin | CR |
| TIMM50 | SNV | Missense_Mutation | c.584N>G | p.Asp195Gly | p.D195G | Q3ZCQ8 | protein_coding | deleterious(0.01) | benign(0.203) | TCGA-A6-6653-01 | Colorectum | colon adenocarcinoma | Male | >=65 | I/II | Unknown | Unknown | SD | |
| TIMM50 | SNV | Missense_Mutation | rs371263769 | c.1283N>A | p.Arg428His | p.R428H | Q3ZCQ8 | protein_coding | deleterious(0.02) | probably_damaging(0.917) | TCGA-AA-3492-01 | Colorectum | colon adenocarcinoma | Female | >=65 | I/II | Unknown | Unknown | SD |
| TIMM50 | SNV | Missense_Mutation | c.1096N>A | p.Ala366Thr | p.A366T | Q3ZCQ8 | protein_coding | tolerated(0.13) | possibly_damaging(0.675) | TCGA-AA-3966-01 | Colorectum | colon adenocarcinoma | Female | >=65 | I/II | Unknown | Unknown | SD | |
| TIMM50 | SNV | Missense_Mutation | rs746734633 | c.1282N>T | p.Arg428Cys | p.R428C | Q3ZCQ8 | protein_coding | deleterious(0) | probably_damaging(0.917) | TCGA-CM-6162-01 | Colorectum | colon adenocarcinoma | Female | <65 | III/IV | Chemotherapy | oxaliplatin | SD |
| TIMM50 | SNV | Missense_Mutation | rs780195132 | c.691N>A | p.Glu231Lys | p.E231K | Q3ZCQ8 | protein_coding | deleterious(0.05) | benign(0.41) | TCGA-AG-A002-01 | Colorectum | rectum adenocarcinoma | Male | <65 | I/II | Unknown | Unknown | SD |
| TIMM50 | SNV | Missense_Mutation | c.901N>A | p.Gly301Ser | p.G301S | Q3ZCQ8 | protein_coding | tolerated(0.17) | possibly_damaging(0.834) | TCGA-AG-A002-01 | Colorectum | rectum adenocarcinoma | Male | <65 | I/II | Unknown | Unknown | SD |
| Page: 1 2 3 4 |
Top |
Related drugs of malignant transformation related genes |
| Identification of chemicals and drugs interact with genes involved in malignant transfromation |
| (DGIdb 4.0) |
| Entrez ID | Symbol | Category | Interaction Types | Drug Claim Name | Drug Name | PMIDs |
| Page: 1 |

Copyright 2023-Present -The University of Texas Health Science Center at Houston |