
|
|||||
|
 | |
| |
| |
| |
| |
| |
|
Gene: TBL3 |
Gene summary for TBL3 |
| Gene information | Species | Human | Gene symbol | TBL3 | Gene ID | 10607 |
| Gene name | transducin beta like 3 | |
| Gene Alias | SAZD | |
| Cytomap | 16p13.3 | |
| Gene Type | protein-coding | GO ID | GO:0000462 | UniProtAcc | Q12788 |
Top |
Malignant transformation analysis |
| Identification of the aberrant gene expression in precancerous and cancerous lesions by comparing the gene expression of stem-like cells in diseased tissues with normal stem cells |
| Entrez ID | Symbol | Replicates | Species | Organ | Tissue | Adj P-value | Log2FC | Malignancy |
| 10607 | TBL3 | LZE4T | Human | Esophagus | ESCC | 6.30e-03 | 7.03e-02 | 0.0811 |
| 10607 | TBL3 | LZE7T | Human | Esophagus | ESCC | 4.92e-04 | 2.96e-01 | 0.0667 |
| 10607 | TBL3 | LZE20T | Human | Esophagus | ESCC | 8.81e-03 | 1.47e-01 | 0.0662 |
| 10607 | TBL3 | LZE24T | Human | Esophagus | ESCC | 7.40e-10 | 2.77e-01 | 0.0596 |
| 10607 | TBL3 | P1T-E | Human | Esophagus | ESCC | 7.09e-14 | 4.69e-01 | 0.0875 |
| 10607 | TBL3 | P2T-E | Human | Esophagus | ESCC | 8.06e-44 | 7.15e-01 | 0.1177 |
| 10607 | TBL3 | P4T-E | Human | Esophagus | ESCC | 9.17e-15 | 2.74e-01 | 0.1323 |
| 10607 | TBL3 | P5T-E | Human | Esophagus | ESCC | 2.03e-10 | 2.43e-01 | 0.1327 |
| 10607 | TBL3 | P8T-E | Human | Esophagus | ESCC | 4.69e-20 | 3.39e-01 | 0.0889 |
| 10607 | TBL3 | P9T-E | Human | Esophagus | ESCC | 1.04e-03 | 1.44e-01 | 0.1131 |
| 10607 | TBL3 | P10T-E | Human | Esophagus | ESCC | 1.27e-07 | 1.43e-01 | 0.116 |
| 10607 | TBL3 | P11T-E | Human | Esophagus | ESCC | 3.20e-06 | 3.94e-01 | 0.1426 |
| 10607 | TBL3 | P12T-E | Human | Esophagus | ESCC | 3.50e-40 | 7.35e-01 | 0.1122 |
| 10607 | TBL3 | P15T-E | Human | Esophagus | ESCC | 5.51e-34 | 5.62e-01 | 0.1149 |
| 10607 | TBL3 | P16T-E | Human | Esophagus | ESCC | 5.03e-13 | 2.13e-01 | 0.1153 |
| 10607 | TBL3 | P17T-E | Human | Esophagus | ESCC | 1.34e-14 | 6.43e-01 | 0.1278 |
| 10607 | TBL3 | P19T-E | Human | Esophagus | ESCC | 1.02e-05 | 5.01e-01 | 0.1662 |
| 10607 | TBL3 | P20T-E | Human | Esophagus | ESCC | 3.42e-14 | 2.76e-01 | 0.1124 |
| 10607 | TBL3 | P21T-E | Human | Esophagus | ESCC | 1.22e-22 | 4.57e-01 | 0.1617 |
| 10607 | TBL3 | P22T-E | Human | Esophagus | ESCC | 5.61e-21 | 3.60e-01 | 0.1236 |
| Page: 1 2 3 4 5 |
| Tissue | Expression Dynamics | Abbreviation |
| Esophagus |  | ESCC: Esophageal squamous cell carcinoma |
| HGIN: High-grade intraepithelial neoplasias | ||
| LGIN: Low-grade intraepithelial neoplasias | ||
| Liver | 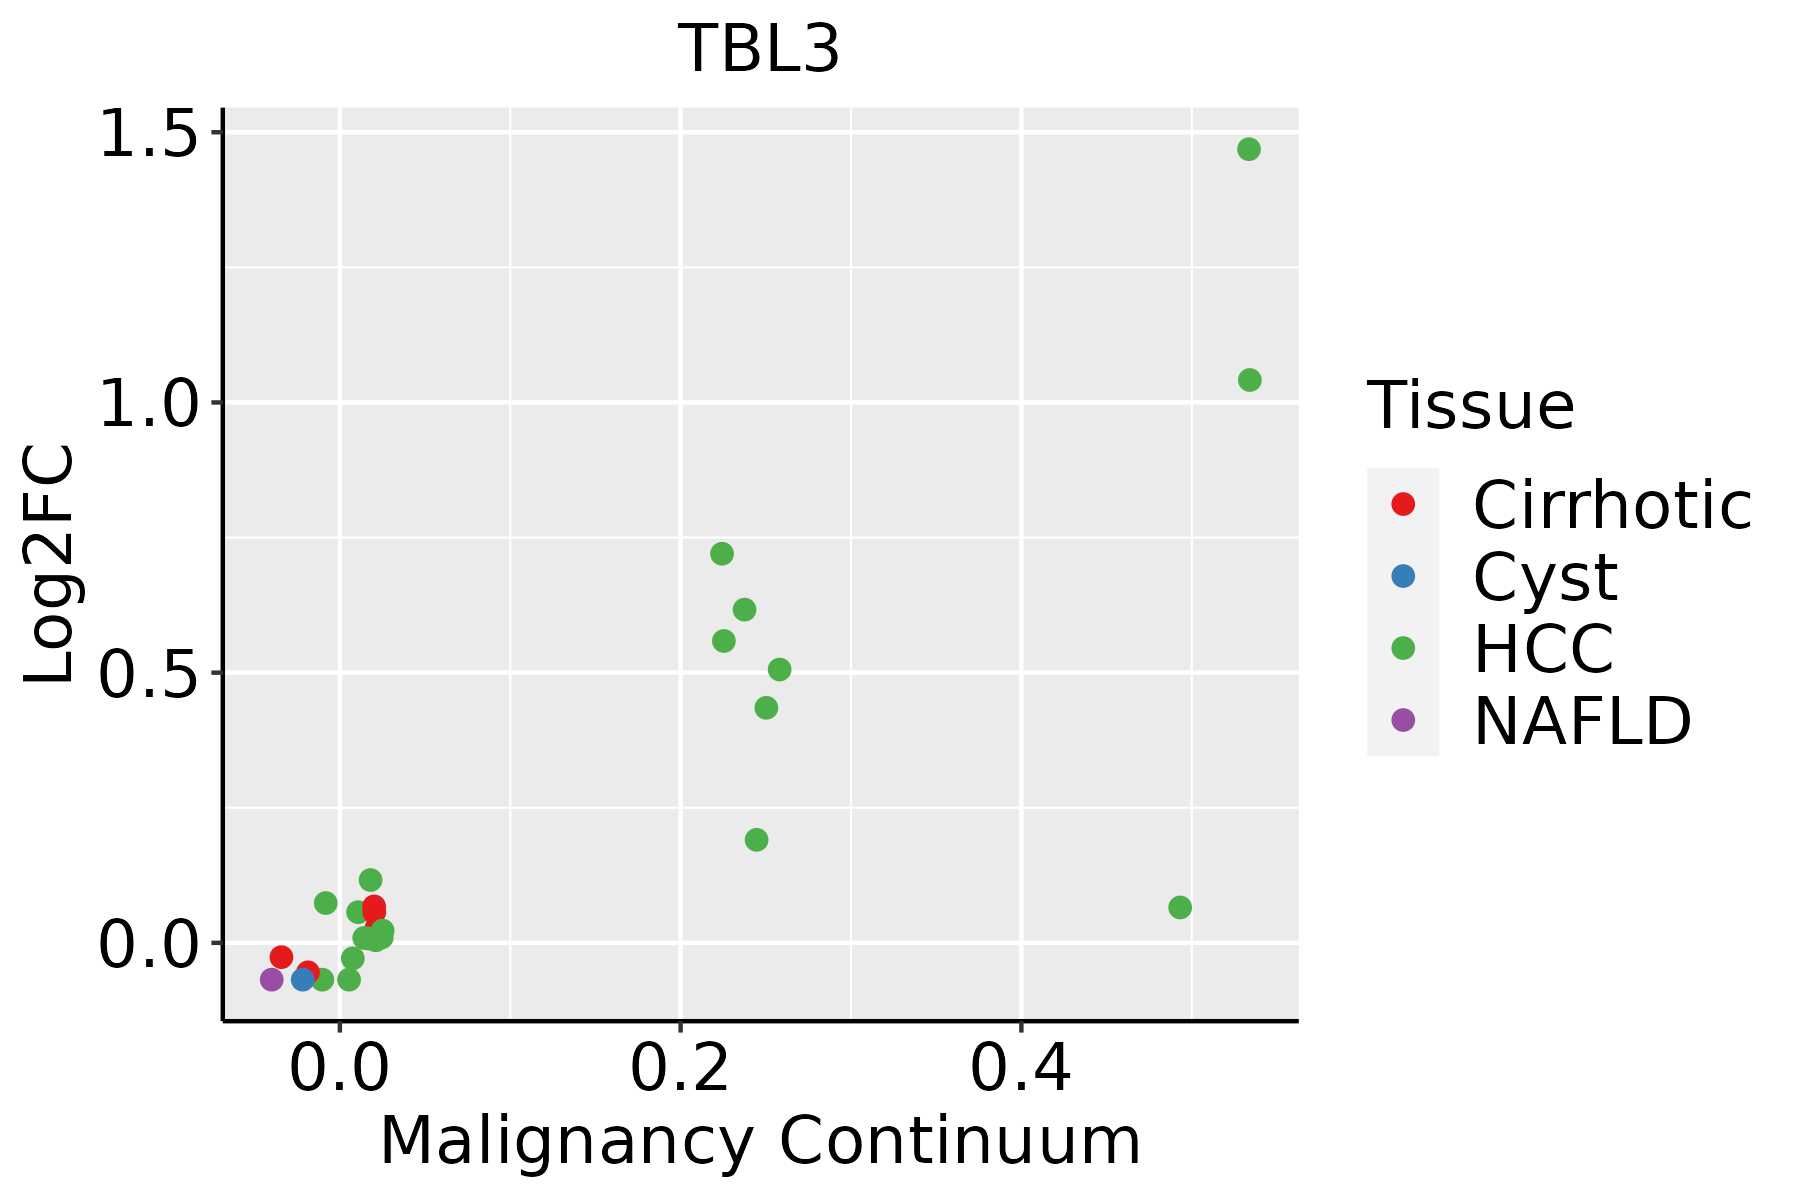 | HCC: Hepatocellular carcinoma |
| NAFLD: Non-alcoholic fatty liver disease | ||
| Oral Cavity |  | EOLP: Erosive Oral lichen planus |
| LP: leukoplakia | ||
| NEOLP: Non-erosive oral lichen planus | ||
| OSCC: Oral squamous cell carcinoma | ||
| Thyroid | 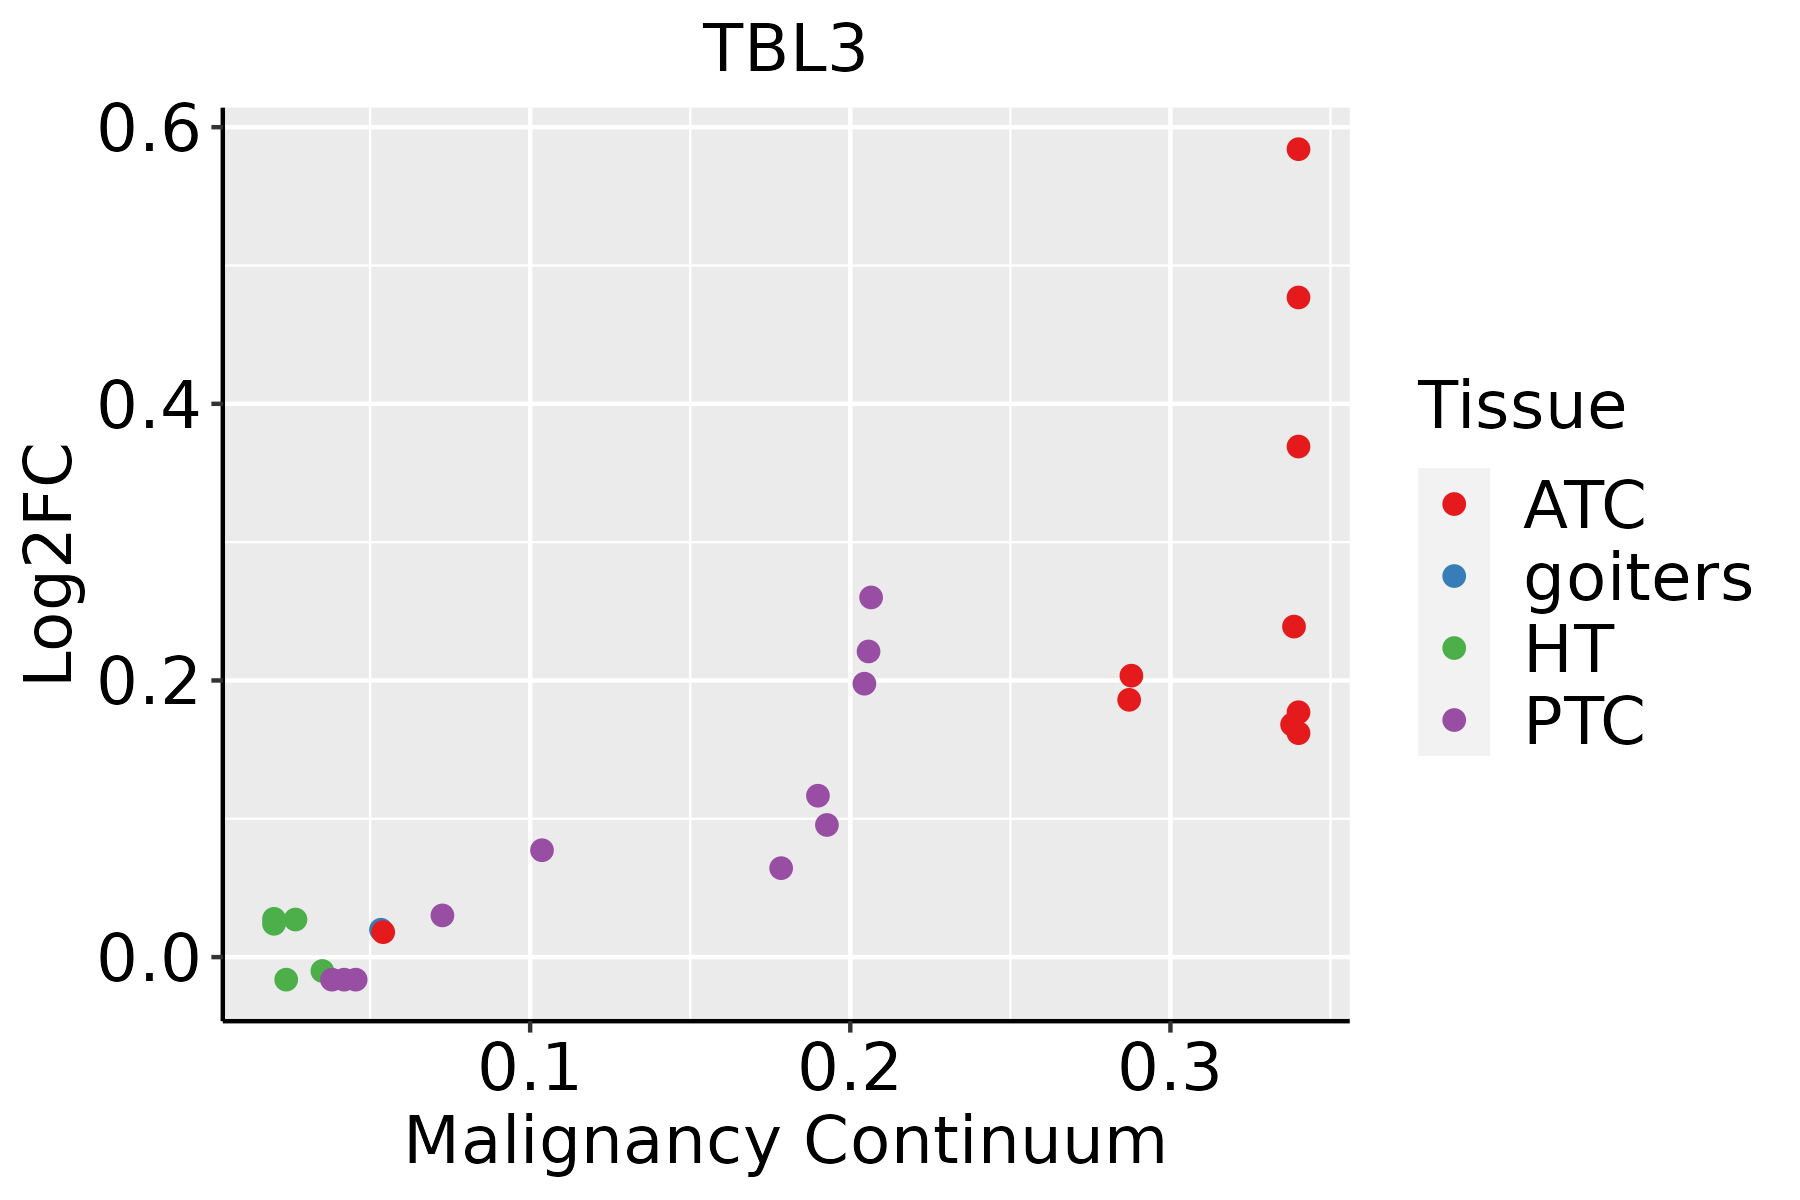 | ATC: Anaplastic thyroid cancer |
| HT: Hashimoto's thyroiditis | ||
| PTC: Papillary thyroid cancer |
| ∗log2FC in expression of this searched gene in stem-like cells from each diseased tissue sample relative to stem-like cells in normal samples in each tissue plotted against the malignancy continuum. Samples are colored based on if they are from different disease stage. |
Top |
Malignant transformation related pathway analysis |
| Find out the enriched GO biological processes and KEGG pathways involved in transition from healthy to precancer to cancer |
| Tissue | Disease Stage | Enriched GO biological Processes |
| Colorectum | AD |  |
| Colorectum | SER |  |
| Colorectum | MSS |  |
| Colorectum | MSI-H |  |
| Colorectum | FAP |  |
| ∗Top 15 enriched GO BP terms are showed in the bar plot of each disease state in each tissue. Each row represents a significant GO biological process which is colored according to the -log10(p.adjust). |
| Page: 1 2 3 4 5 6 7 8 9 |
| GO ID | Tissue | Disease Stage | Description | Gene Ratio | Bg Ratio | pvalue | p.adjust | Count |
| GO:0006364112 | Thyroid | PTC | rRNA processing | 156/5968 | 225/18723 | 5.58e-31 | 5.03e-28 | 156 |
| GO:0016072112 | Thyroid | PTC | rRNA metabolic process | 160/5968 | 236/18723 | 5.68e-30 | 3.58e-27 | 160 |
| GO:003447018 | Thyroid | PTC | ncRNA processing | 215/5968 | 395/18723 | 7.14e-21 | 1.22e-18 | 215 |
| GO:00346608 | Thyroid | PTC | ncRNA metabolic process | 239/5968 | 485/18723 | 5.54e-16 | 4.26e-14 | 239 |
| GO:0042274113 | Thyroid | PTC | ribosomal small subunit biogenesis | 54/5968 | 73/18723 | 1.77e-13 | 9.28e-12 | 54 |
| GO:00304906 | Thyroid | PTC | maturation of SSU-rRNA | 34/5968 | 50/18723 | 1.69e-07 | 3.19e-06 | 34 |
| GO:00004695 | Thyroid | PTC | cleavage involved in rRNA processing | 21/5968 | 27/18723 | 1.24e-06 | 1.79e-05 | 21 |
| GO:00905015 | Thyroid | PTC | RNA phosphodiester bond hydrolysis | 76/5968 | 152/18723 | 2.40e-06 | 3.17e-05 | 76 |
| GO:00004625 | Thyroid | PTC | maturation of SSU-rRNA from tricistronic rRNA transcript (SSU-rRNA, 5.8S rRNA, LSU-rRNA) | 24/5968 | 37/18723 | 3.77e-05 | 3.48e-04 | 24 |
| GO:00004785 | Thyroid | PTC | endonucleolytic cleavage involved in rRNA processing | 11/5968 | 15/18723 | 1.19e-03 | 6.84e-03 | 11 |
| GO:00004795 | Thyroid | PTC | endonucleolytic cleavage of tricistronic rRNA transcript (SSU-rRNA, 5.8S rRNA, LSU-rRNA) | 11/5968 | 15/18723 | 1.19e-03 | 6.84e-03 | 11 |
| GO:00903055 | Thyroid | PTC | nucleic acid phosphodiester bond hydrolysis | 105/5968 | 261/18723 | 2.53e-03 | 1.31e-02 | 105 |
| GO:002261334 | Thyroid | ATC | ribonucleoprotein complex biogenesis | 292/6293 | 463/18723 | 3.05e-39 | 9.63e-36 | 292 |
| GO:004225434 | Thyroid | ATC | ribosome biogenesis | 203/6293 | 299/18723 | 3.63e-34 | 4.59e-31 | 203 |
| GO:000636432 | Thyroid | ATC | rRNA processing | 157/6293 | 225/18723 | 9.02e-29 | 5.70e-26 | 157 |
| GO:001607232 | Thyroid | ATC | rRNA metabolic process | 161/6293 | 236/18723 | 1.02e-27 | 5.89e-25 | 161 |
| GO:003447021 | Thyroid | ATC | ncRNA processing | 216/6293 | 395/18723 | 3.14e-18 | 3.98e-16 | 216 |
| GO:003466021 | Thyroid | ATC | ncRNA metabolic process | 240/6293 | 485/18723 | 2.03e-13 | 9.91e-12 | 240 |
| GO:004227435 | Thyroid | ATC | ribosomal small subunit biogenesis | 55/6293 | 73/18723 | 3.33e-13 | 1.55e-11 | 55 |
| GO:003049013 | Thyroid | ATC | maturation of SSU-rRNA | 35/6293 | 50/18723 | 1.56e-07 | 2.52e-06 | 35 |
| Page: 1 2 3 4 5 6 |
| Pathway ID | Tissue | Disease Stage | Description | Gene Ratio | Bg Ratio | pvalue | p.adjust | qvalue | Count |
| Page: 1 |
Top |
Cell-cell communication analysis |
| Identification of potential cell-cell interactions between two cell types and their ligand-receptor pairs for different disease states |
| Ligand | Receptor | LRpair | Pathway | Tissue | Disease Stage |
| Page: 1 |
Top |
Single-cell gene regulatory network inference analysis |
| Find out the significant the regulons (TFs) and the target genes of each regulon across cell types for different disease states |
| TF | Cell Type | Tissue | Disease Stage | Target Gene | RSS | Regulon Activity |
| ∗The dot plots of a searched regulon are shown for all cell subpopulations in each disease state of each tissue based on the regulon specific score inferred using pySCENIC and by calculating the average expression. |
| Page: 1 |
Top |
Somatic mutation of malignant transformation related genes |
| Annotation of somatic variants for genes involved in malignant transformation |
| Hugo Symbol | Variant Class | Variant Classification | dbSNP RS | HGVSc | HGVSp | HGVSp Short | SWISSPROT | BIOTYPE | SIFT | PolyPhen | Tumor Sample Barcode | Tissue | Histology | Sex | Age | Stage | Therapy Types | Drugs | Outcome |
| TBL3 | SNV | Missense_Mutation | c.218N>G | p.Asp73Gly | p.D73G | Q12788 | protein_coding | tolerated(0.27) | benign(0.013) | TCGA-A2-A0CT-01 | Breast | breast invasive carcinoma | Female | >=65 | I/II | Chemotherapy | cytoxan | SD | |
| TBL3 | SNV | Missense_Mutation | novel | c.745N>G | p.Pro249Ala | p.P249A | Q12788 | protein_coding | tolerated(0.74) | benign(0.001) | TCGA-A2-A0CT-01 | Breast | breast invasive carcinoma | Female | >=65 | I/II | Chemotherapy | cytoxan | SD |
| TBL3 | SNV | Missense_Mutation | novel | c.811N>G | p.Leu271Val | p.L271V | Q12788 | protein_coding | tolerated(0.11) | possibly_damaging(0.804) | TCGA-BH-A1F8-01 | Breast | breast invasive carcinoma | Female | >=65 | III/IV | Unknown | Unknown | PD |
| TBL3 | SNV | Missense_Mutation | c.797N>C | p.Gly266Ala | p.G266A | Q12788 | protein_coding | deleterious(0.01) | probably_damaging(0.999) | TCGA-C8-A26Y-01 | Breast | breast invasive carcinoma | Female | >=65 | I/II | Unknown | Unknown | SD | |
| TBL3 | SNV | Missense_Mutation | c.1829N>A | p.Gly610Glu | p.G610E | Q12788 | protein_coding | deleterious(0) | possibly_damaging(0.772) | TCGA-E2-A14O-01 | Breast | breast invasive carcinoma | Female | >=65 | III/IV | Hormone Therapy | arimidex | SD | |
| TBL3 | insertion | Frame_Shift_Ins | novel | c.744_745insAAGA | p.Pro249LysfsTer88 | p.P249Kfs*88 | Q12788 | protein_coding | TCGA-A2-A0CT-01 | Breast | breast invasive carcinoma | Female | >=65 | I/II | Chemotherapy | cytoxan | SD | ||
| TBL3 | SNV | Missense_Mutation | c.193N>A | p.Asp65Asn | p.D65N | Q12788 | protein_coding | deleterious(0) | probably_damaging(0.931) | TCGA-IR-A3LK-01 | Cervix | cervical & endocervical cancer | Female | >=65 | I/II | Chemotherapy | cisplatin | PD | |
| TBL3 | SNV | Missense_Mutation | c.1915N>C | p.Glu639Gln | p.E639Q | Q12788 | protein_coding | deleterious(0.03) | probably_damaging(0.983) | TCGA-JW-A5VL-01 | Cervix | cervical & endocervical cancer | Female | <65 | I/II | Unknown | Unknown | SD | |
| TBL3 | insertion | Frame_Shift_Ins | novel | c.831_832insCTGAAGG | p.Ser278LeufsTer60 | p.S278Lfs*60 | Q12788 | protein_coding | TCGA-DS-A1OD-01 | Cervix | cervical & endocervical cancer | Female | <65 | I/II | Chemotherapy | cisplatin | SD | ||
| TBL3 | SNV | Missense_Mutation | c.1525N>T | p.Pro509Ser | p.P509S | Q12788 | protein_coding | tolerated(1) | benign(0.031) | TCGA-AD-6964-01 | Colorectum | colon adenocarcinoma | Male | <65 | III/IV | Chemotherapy | folfox | PD |
| Page: 1 2 3 4 5 6 |
Top |
Related drugs of malignant transformation related genes |
| Identification of chemicals and drugs interact with genes involved in malignant transfromation |
| (DGIdb 4.0) |
| Entrez ID | Symbol | Category | Interaction Types | Drug Claim Name | Drug Name | PMIDs |
| Page: 1 |

Copyright 2023-Present -The University of Texas Health Science Center at Houston |