
|
|||||
|
 | |
| |
| |
| |
| |
| |
|
Gene: SRP9 |
Gene summary for SRP9 |
| Gene information | Species | Human | Gene symbol | SRP9 | Gene ID | 6726 |
| Gene name | signal recognition particle 9 | |
| Gene Alias | ALURBP | |
| Cytomap | 1q42.12 | |
| Gene Type | protein-coding | GO ID | GO:0006412 | UniProtAcc | A0A024R3P3 |
Top |
Malignant transformation analysis |
| Identification of the aberrant gene expression in precancerous and cancerous lesions by comparing the gene expression of stem-like cells in diseased tissues with normal stem cells |
| Entrez ID | Symbol | Replicates | Species | Organ | Tissue | Adj P-value | Log2FC | Malignancy |
| 6726 | SRP9 | GSM4909281 | Human | Breast | IDC | 9.28e-15 | 4.69e-01 | 0.21 |
| 6726 | SRP9 | GSM4909285 | Human | Breast | IDC | 2.61e-03 | 3.76e-01 | 0.21 |
| 6726 | SRP9 | GSM4909286 | Human | Breast | IDC | 1.38e-04 | 2.32e-01 | 0.1081 |
| 6726 | SRP9 | GSM4909287 | Human | Breast | IDC | 3.65e-02 | 1.60e-01 | 0.2057 |
| 6726 | SRP9 | GSM4909288 | Human | Breast | IDC | 3.61e-05 | 1.01e-01 | 0.0988 |
| 6726 | SRP9 | GSM4909289 | Human | Breast | IDC | 1.95e-11 | 6.58e-01 | 0.1064 |
| 6726 | SRP9 | GSM4909290 | Human | Breast | IDC | 3.35e-18 | 5.71e-01 | 0.2096 |
| 6726 | SRP9 | GSM4909293 | Human | Breast | IDC | 1.88e-18 | 5.36e-01 | 0.1581 |
| 6726 | SRP9 | GSM4909294 | Human | Breast | IDC | 2.66e-21 | 4.31e-01 | 0.2022 |
| 6726 | SRP9 | GSM4909296 | Human | Breast | IDC | 2.11e-19 | -4.44e-01 | 0.1524 |
| 6726 | SRP9 | GSM4909297 | Human | Breast | IDC | 1.11e-22 | 5.12e-03 | 0.1517 |
| 6726 | SRP9 | GSM4909298 | Human | Breast | IDC | 4.08e-26 | 6.04e-01 | 0.1551 |
| 6726 | SRP9 | GSM4909301 | Human | Breast | IDC | 4.20e-10 | -4.06e-01 | 0.1577 |
| 6726 | SRP9 | GSM4909305 | Human | Breast | IDC | 2.74e-02 | 3.01e-01 | 0.0436 |
| 6726 | SRP9 | GSM4909306 | Human | Breast | IDC | 5.57e-30 | 6.05e-01 | 0.1564 |
| 6726 | SRP9 | GSM4909307 | Human | Breast | IDC | 3.78e-13 | 4.21e-01 | 0.1569 |
| 6726 | SRP9 | GSM4909308 | Human | Breast | IDC | 2.69e-72 | 8.86e-01 | 0.158 |
| 6726 | SRP9 | GSM4909311 | Human | Breast | IDC | 2.36e-43 | -4.89e-01 | 0.1534 |
| 6726 | SRP9 | GSM4909312 | Human | Breast | IDC | 8.01e-23 | 2.68e-01 | 0.1552 |
| 6726 | SRP9 | GSM4909313 | Human | Breast | IDC | 1.20e-05 | 1.47e-01 | 0.0391 |
| Page: 1 2 3 4 5 6 7 8 9 10 11 |
| Tissue | Expression Dynamics | Abbreviation |
| Breast |  | IDC: Invasive ductal carcinoma |
| DCIS: Ductal carcinoma in situ | ||
| Precancer(BRCA1-mut): Precancerous lesion from BRCA1 mutation carriers | ||
| Colorectum (GSE201348) |  | FAP: Familial adenomatous polyposis |
| CRC: Colorectal cancer | ||
| Colorectum (HTA11) |  | AD: Adenomas |
| SER: Sessile serrated lesions | ||
| MSI-H: Microsatellite-high colorectal cancer | ||
| MSS: Microsatellite stable colorectal cancer | ||
| Endometrium |  | AEH: Atypical endometrial hyperplasia |
| EEC: Endometrioid Cancer | ||
| Esophagus | 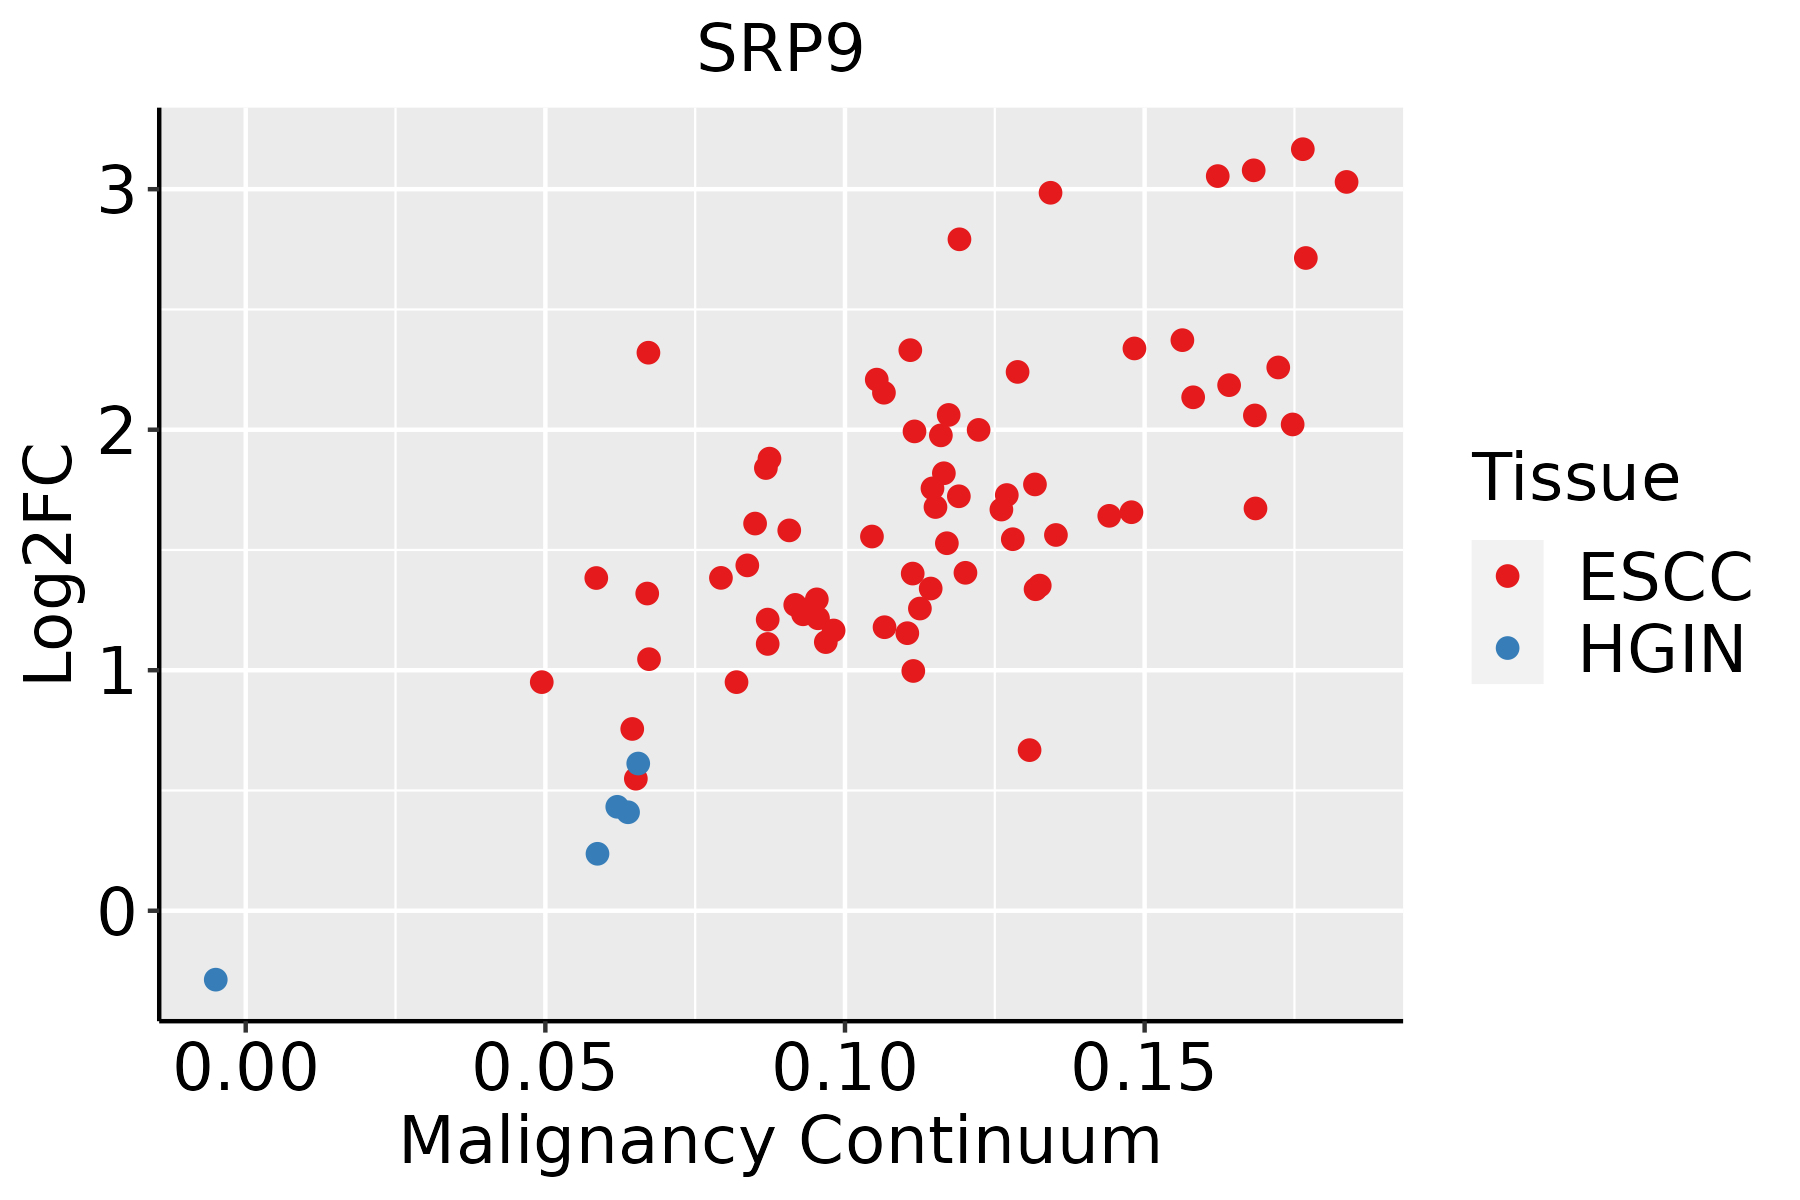 | ESCC: Esophageal squamous cell carcinoma |
| HGIN: High-grade intraepithelial neoplasias | ||
| LGIN: Low-grade intraepithelial neoplasias | ||
| Liver | 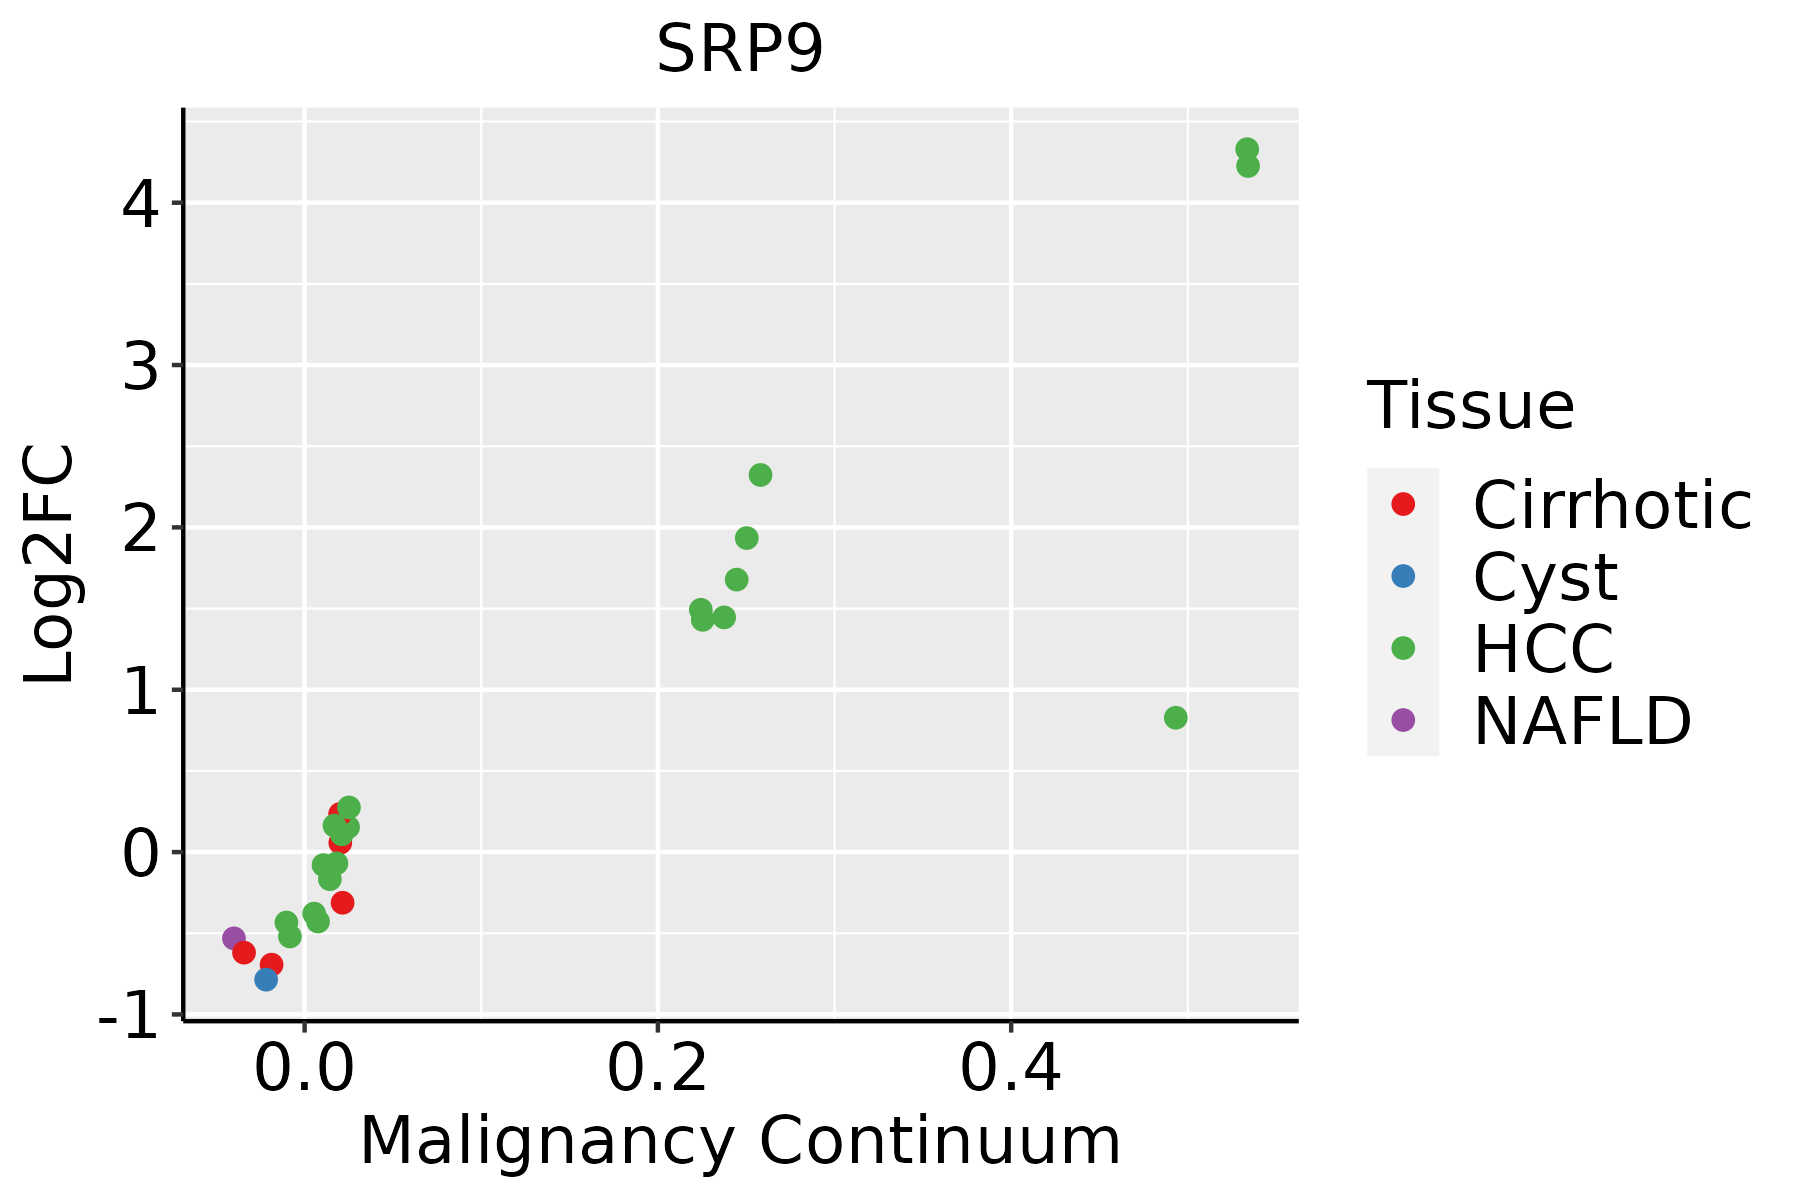 | HCC: Hepatocellular carcinoma |
| NAFLD: Non-alcoholic fatty liver disease | ||
| Oral Cavity | 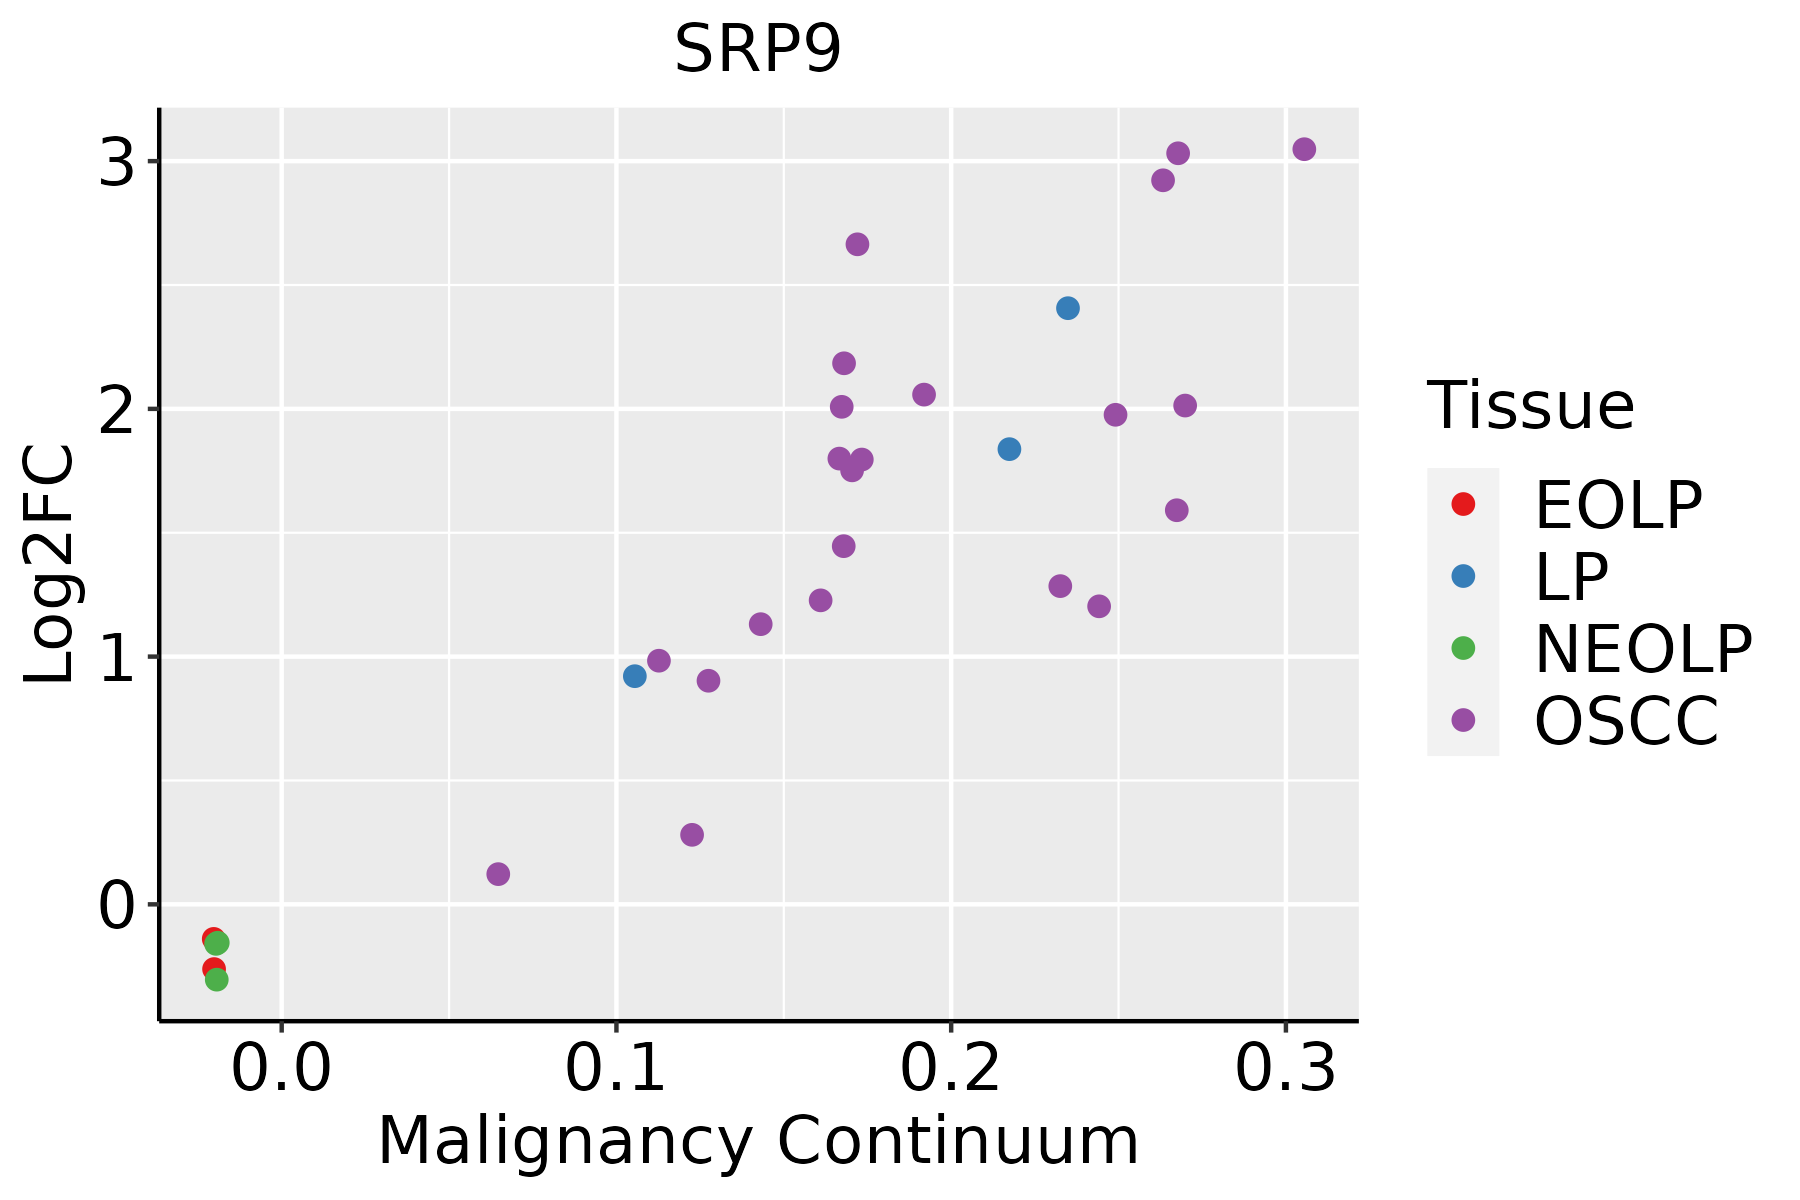 | EOLP: Erosive Oral lichen planus |
| LP: leukoplakia | ||
| NEOLP: Non-erosive oral lichen planus | ||
| OSCC: Oral squamous cell carcinoma | ||
| Prostate |  | BPH: Benign Prostatic Hyperplasia |
| Skin |  | AK: Actinic keratosis |
| cSCC: Cutaneous squamous cell carcinoma | ||
| SCCIS:squamous cell carcinoma in situ | ||
| Thyroid | 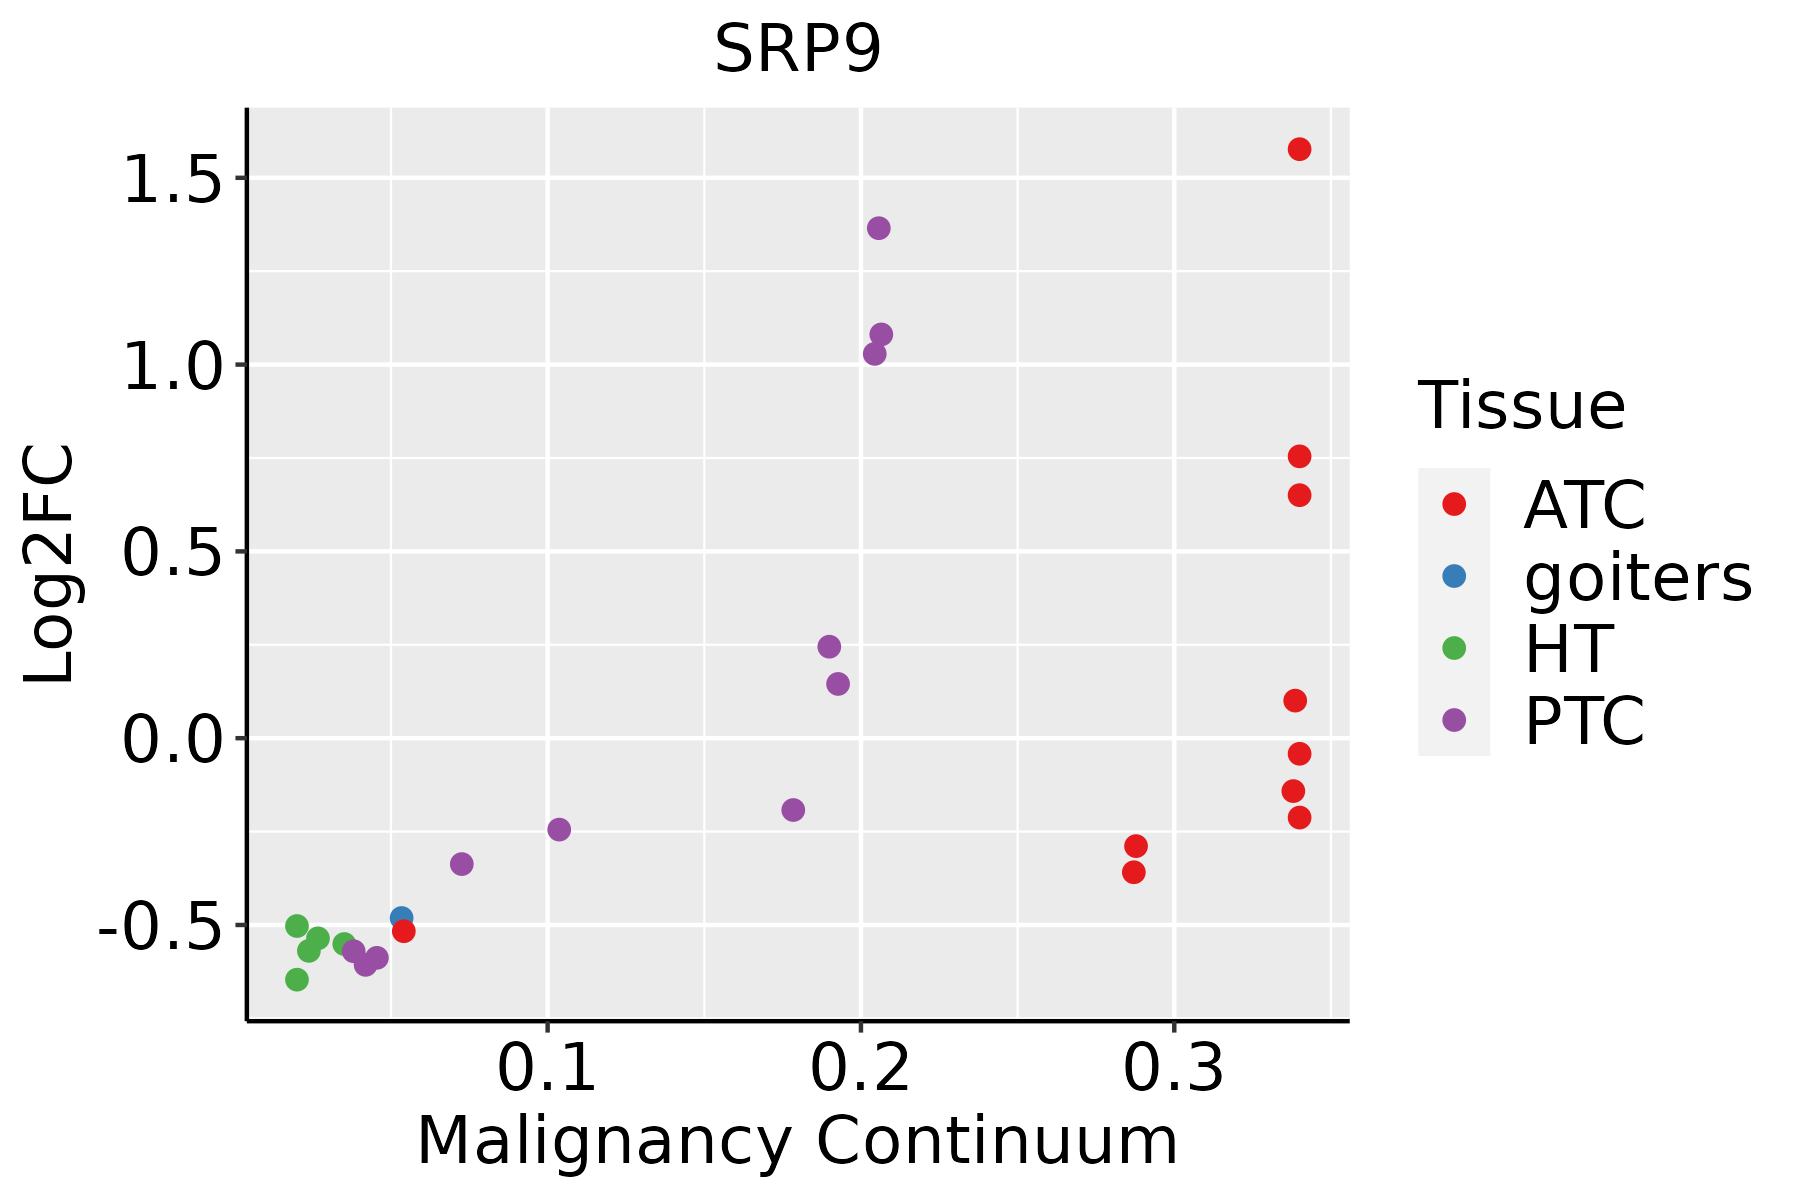 | ATC: Anaplastic thyroid cancer |
| HT: Hashimoto's thyroiditis | ||
| PTC: Papillary thyroid cancer |
| ∗log2FC in expression of this searched gene in stem-like cells from each diseased tissue sample relative to stem-like cells in normal samples in each tissue plotted against the malignancy continuum. Samples are colored based on if they are from different disease stage. |
Top |
Malignant transformation related pathway analysis |
| Find out the enriched GO biological processes and KEGG pathways involved in transition from healthy to precancer to cancer |
| Tissue | Disease Stage | Enriched GO biological Processes |
| Colorectum | AD |  |
| Colorectum | SER |  |
| Colorectum | MSS |  |
| Colorectum | MSI-H |  |
| Colorectum | FAP |  |
| ∗Top 15 enriched GO BP terms are showed in the bar plot of each disease state in each tissue. Each row represents a significant GO biological process which is colored according to the -log10(p.adjust). |
| Page: 1 2 3 4 5 6 7 8 9 |
| GO ID | Tissue | Disease Stage | Description | Gene Ratio | Bg Ratio | pvalue | p.adjust | Count |
| GO:00450474 | Liver | Cirrhotic | protein targeting to ER | 24/4634 | 42/18723 | 7.49e-06 | 1.15e-04 | 24 |
| GO:00066122 | Liver | Cirrhotic | protein targeting to membrane | 53/4634 | 131/18723 | 5.17e-05 | 5.95e-04 | 53 |
| GO:001714811 | Liver | Cirrhotic | negative regulation of translation | 87/4634 | 245/18723 | 1.01e-04 | 1.05e-03 | 87 |
| GO:00066132 | Liver | Cirrhotic | cotranslational protein targeting to membrane | 17/4634 | 31/18723 | 3.19e-04 | 2.77e-03 | 17 |
| GO:007259422 | Liver | HCC | establishment of protein localization to organelle | 299/7958 | 422/18723 | 1.06e-32 | 6.10e-30 | 299 |
| GO:000660512 | Liver | HCC | protein targeting | 219/7958 | 314/18723 | 7.74e-23 | 1.49e-20 | 219 |
| GO:000641722 | Liver | HCC | regulation of translation | 287/7958 | 468/18723 | 8.79e-17 | 8.08e-15 | 287 |
| GO:009015012 | Liver | HCC | establishment of protein localization to membrane | 168/7958 | 260/18723 | 4.07e-13 | 2.13e-11 | 168 |
| GO:007097212 | Liver | HCC | protein localization to endoplasmic reticulum | 54/7958 | 74/18723 | 1.01e-07 | 1.98e-06 | 54 |
| GO:007259911 | Liver | HCC | establishment of protein localization to endoplasmic reticulum | 34/7958 | 46/18723 | 1.53e-05 | 1.67e-04 | 34 |
| GO:004504711 | Liver | HCC | protein targeting to ER | 30/7958 | 42/18723 | 1.40e-04 | 1.13e-03 | 30 |
| GO:003424921 | Liver | HCC | negative regulation of cellular amide metabolic process | 144/7958 | 273/18723 | 3.80e-04 | 2.61e-03 | 144 |
| GO:00066121 | Liver | HCC | protein targeting to membrane | 75/7958 | 131/18723 | 4.58e-04 | 3.04e-03 | 75 |
| GO:000641412 | Liver | HCC | translational elongation | 36/7958 | 55/18723 | 4.94e-04 | 3.23e-03 | 36 |
| GO:001714821 | Liver | HCC | negative regulation of translation | 129/7958 | 245/18723 | 8.14e-04 | 4.87e-03 | 129 |
| GO:00066131 | Liver | HCC | cotranslational protein targeting to membrane | 20/7958 | 31/18723 | 1.11e-02 | 4.09e-02 | 20 |
| GO:000641732 | Liver | Cyst | regulation of translation | 28/496 | 468/18723 | 5.69e-05 | 3.00e-03 | 28 |
| GO:009015021 | Liver | Cyst | establishment of protein localization to membrane | 18/496 | 260/18723 | 2.09e-04 | 7.84e-03 | 18 |
| GO:000660522 | Liver | Cyst | protein targeting | 20/496 | 314/18723 | 2.88e-04 | 9.60e-03 | 20 |
| GO:000641421 | Liver | Cyst | translational elongation | 7/496 | 55/18723 | 5.93e-04 | 1.71e-02 | 7 |
| Page: 1 2 3 4 5 6 7 8 9 10 11 |
| Pathway ID | Tissue | Disease Stage | Description | Gene Ratio | Bg Ratio | pvalue | p.adjust | qvalue | Count |
| hsa030602 | Colorectum | MSS | Protein export | 15/1875 | 23/8465 | 1.13e-05 | 1.26e-04 | 7.71e-05 | 15 |
| hsa030603 | Colorectum | MSS | Protein export | 15/1875 | 23/8465 | 1.13e-05 | 1.26e-04 | 7.71e-05 | 15 |
| hsa0306023 | Endometrium | EEC | Protein export | 11/1237 | 23/8465 | 1.54e-04 | 1.41e-03 | 1.05e-03 | 11 |
| hsa0306033 | Endometrium | EEC | Protein export | 11/1237 | 23/8465 | 1.54e-04 | 1.41e-03 | 1.05e-03 | 11 |
| hsa0306026 | Esophagus | ESCC | Protein export | 22/4205 | 23/8465 | 2.43e-06 | 1.43e-05 | 7.32e-06 | 22 |
| hsa0306036 | Esophagus | ESCC | Protein export | 22/4205 | 23/8465 | 2.43e-06 | 1.43e-05 | 7.32e-06 | 22 |
| hsa030608 | Liver | Cirrhotic | Protein export | 20/2530 | 23/8465 | 2.00e-08 | 3.51e-07 | 2.17e-07 | 20 |
| hsa0306011 | Liver | Cirrhotic | Protein export | 20/2530 | 23/8465 | 2.00e-08 | 3.51e-07 | 2.17e-07 | 20 |
| hsa0306021 | Liver | HCC | Protein export | 21/4020 | 23/8465 | 1.20e-05 | 8.53e-05 | 4.74e-05 | 21 |
| hsa0306031 | Liver | HCC | Protein export | 21/4020 | 23/8465 | 1.20e-05 | 8.53e-05 | 4.74e-05 | 21 |
| hsa0306018 | Oral cavity | OSCC | Protein export | 21/3704 | 23/8465 | 2.42e-06 | 1.27e-05 | 6.45e-06 | 21 |
| hsa0306019 | Oral cavity | OSCC | Protein export | 21/3704 | 23/8465 | 2.42e-06 | 1.27e-05 | 6.45e-06 | 21 |
| hsa0306025 | Oral cavity | LP | Protein export | 21/2418 | 23/8465 | 4.72e-10 | 8.28e-09 | 5.34e-09 | 21 |
| hsa0306035 | Oral cavity | LP | Protein export | 21/2418 | 23/8465 | 4.72e-10 | 8.28e-09 | 5.34e-09 | 21 |
| hsa0306016 | Prostate | BPH | Protein export | 18/1718 | 23/8465 | 3.72e-09 | 5.11e-08 | 3.16e-08 | 18 |
| hsa0306017 | Prostate | BPH | Protein export | 18/1718 | 23/8465 | 3.72e-09 | 5.11e-08 | 3.16e-08 | 18 |
| hsa0306024 | Prostate | Tumor | Protein export | 18/1791 | 23/8465 | 7.50e-09 | 1.03e-07 | 6.42e-08 | 18 |
| hsa0306034 | Prostate | Tumor | Protein export | 18/1791 | 23/8465 | 7.50e-09 | 1.03e-07 | 6.42e-08 | 18 |
| Page: 1 |
Top |
Cell-cell communication analysis |
| Identification of potential cell-cell interactions between two cell types and their ligand-receptor pairs for different disease states |
| Ligand | Receptor | LRpair | Pathway | Tissue | Disease Stage |
| Page: 1 |
Top |
Single-cell gene regulatory network inference analysis |
| Find out the significant the regulons (TFs) and the target genes of each regulon across cell types for different disease states |
| TF | Cell Type | Tissue | Disease Stage | Target Gene | RSS | Regulon Activity |
| ∗The dot plots of a searched regulon are shown for all cell subpopulations in each disease state of each tissue based on the regulon specific score inferred using pySCENIC and by calculating the average expression. |
| Page: 1 |
Top |
Somatic mutation of malignant transformation related genes |
| Annotation of somatic variants for genes involved in malignant transformation |
| Hugo Symbol | Variant Class | Variant Classification | dbSNP RS | HGVSc | HGVSp | HGVSp Short | SWISSPROT | BIOTYPE | SIFT | PolyPhen | Tumor Sample Barcode | Tissue | Histology | Sex | Age | Stage | Therapy Types | Drugs | Outcome |
| SRP9 | SNV | Missense_Mutation | novel | c.166N>A | p.Ala56Thr | p.A56T | P49458 | protein_coding | tolerated(0.12) | possibly_damaging(0.573) | TCGA-A5-A0G2-01 | Endometrium | uterine corpus endometrioid carcinoma | Female | <65 | III/IV | Unknown | Unknown | SD |
| SRP9 | SNV | Missense_Mutation | novel | c.133N>T | p.Asp45Tyr | p.D45Y | P49458 | protein_coding | deleterious(0) | probably_damaging(0.983) | TCGA-A5-A2K5-01 | Endometrium | uterine corpus endometrioid carcinoma | Female | >=65 | I/II | Unknown | Unknown | SD |
| SRP9 | SNV | Missense_Mutation | c.181A>G | p.Lys61Glu | p.K61E | P49458 | protein_coding | deleterious(0) | probably_damaging(0.953) | TCGA-95-7947-01 | Lung | lung adenocarcinoma | Male | >=65 | I/II | Unknown | Unknown | SD | |
| SRP9 | SNV | Missense_Mutation | c.77G>A | p.Arg26His | p.R26H | P49458 | protein_coding | deleterious(0.02) | probably_damaging(0.999) | TCGA-BR-A4QL-01 | Stomach | stomach adenocarcinoma | Female | >=65 | III/IV | Chemotherapy | xeloda | CR | |
| SRP9 | SNV | Missense_Mutation | novel | c.220N>A | p.Val74Ile | p.V74I | P49458 | protein_coding | tolerated(0.08) | benign(0.077) | TCGA-VQ-AA6D-01 | Stomach | stomach adenocarcinoma | Female | <65 | III/IV | Chemotherapy | fluorouracil | CR |
| Page: 1 |
Top |
Related drugs of malignant transformation related genes |
| Identification of chemicals and drugs interact with genes involved in malignant transfromation |
| (DGIdb 4.0) |
| Entrez ID | Symbol | Category | Interaction Types | Drug Claim Name | Drug Name | PMIDs |
| Page: 1 |

Copyright 2023-Present -The University of Texas Health Science Center at Houston |