
|
|||||
|
 | |
| |
| |
| |
| |
| |
|
Gene: SRP72 |
Gene summary for SRP72 |
| Gene information | Species | Human | Gene symbol | SRP72 | Gene ID | 6731 |
| Gene name | signal recognition particle 72 | |
| Gene Alias | BMFF | |
| Cytomap | 4q12 | |
| Gene Type | protein-coding | GO ID | GO:0006605 | UniProtAcc | O76094 |
Top |
Malignant transformation analysis |
| Identification of the aberrant gene expression in precancerous and cancerous lesions by comparing the gene expression of stem-like cells in diseased tissues with normal stem cells |
| Entrez ID | Symbol | Replicates | Species | Organ | Tissue | Adj P-value | Log2FC | Malignancy |
| 6731 | SRP72 | HTA11_347_2000001011 | Human | Colorectum | AD | 1.65e-05 | 3.84e-01 | -0.1954 |
| 6731 | SRP72 | HTA11_99999970781_79442 | Human | Colorectum | MSS | 1.01e-04 | 4.33e-01 | 0.294 |
| 6731 | SRP72 | HTA11_99999965062_69753 | Human | Colorectum | MSI-H | 2.19e-06 | 1.32e+00 | 0.3487 |
| 6731 | SRP72 | HTA11_99999971662_82457 | Human | Colorectum | MSS | 2.07e-07 | 5.21e-01 | 0.3859 |
| 6731 | SRP72 | A015-C-203 | Human | Colorectum | FAP | 3.91e-06 | -2.34e-01 | -0.1294 |
| 6731 | SRP72 | A002-C-201 | Human | Colorectum | FAP | 7.63e-04 | -1.76e-01 | 0.0324 |
| 6731 | SRP72 | A001-C-108 | Human | Colorectum | FAP | 4.47e-02 | -7.00e-02 | -0.0272 |
| 6731 | SRP72 | A002-C-205 | Human | Colorectum | FAP | 5.91e-05 | -1.37e-01 | -0.1236 |
| 6731 | SRP72 | A015-C-006 | Human | Colorectum | FAP | 4.71e-03 | -8.12e-02 | -0.0994 |
| 6731 | SRP72 | A002-C-114 | Human | Colorectum | FAP | 8.28e-05 | -2.24e-01 | -0.1561 |
| 6731 | SRP72 | A015-C-104 | Human | Colorectum | FAP | 4.91e-05 | -1.26e-01 | -0.1899 |
| 6731 | SRP72 | A002-C-016 | Human | Colorectum | FAP | 2.30e-04 | -1.39e-01 | 0.0521 |
| 6731 | SRP72 | A002-C-116 | Human | Colorectum | FAP | 2.58e-07 | -1.11e-01 | -0.0452 |
| 6731 | SRP72 | A014-C-008 | Human | Colorectum | FAP | 3.89e-02 | -1.80e-01 | -0.191 |
| 6731 | SRP72 | A018-E-020 | Human | Colorectum | FAP | 1.50e-02 | -8.88e-02 | -0.2034 |
| 6731 | SRP72 | F034 | Human | Colorectum | FAP | 3.27e-02 | -7.21e-02 | -0.0665 |
| 6731 | SRP72 | AEH-subject1 | Human | Endometrium | AEH | 5.12e-07 | -3.37e-01 | -0.3059 |
| 6731 | SRP72 | AEH-subject2 | Human | Endometrium | AEH | 2.12e-11 | -3.84e-01 | -0.2525 |
| 6731 | SRP72 | AEH-subject3 | Human | Endometrium | AEH | 5.17e-09 | -2.70e-01 | -0.2576 |
| 6731 | SRP72 | AEH-subject4 | Human | Endometrium | AEH | 7.45e-05 | -2.92e-01 | -0.2657 |
| Page: 1 2 3 4 5 6 7 8 9 |
| Tissue | Expression Dynamics | Abbreviation |
| Colorectum (GSE201348) |  | FAP: Familial adenomatous polyposis |
| CRC: Colorectal cancer | ||
| Colorectum (HTA11) |  | AD: Adenomas |
| SER: Sessile serrated lesions | ||
| MSI-H: Microsatellite-high colorectal cancer | ||
| MSS: Microsatellite stable colorectal cancer | ||
| Endometrium | 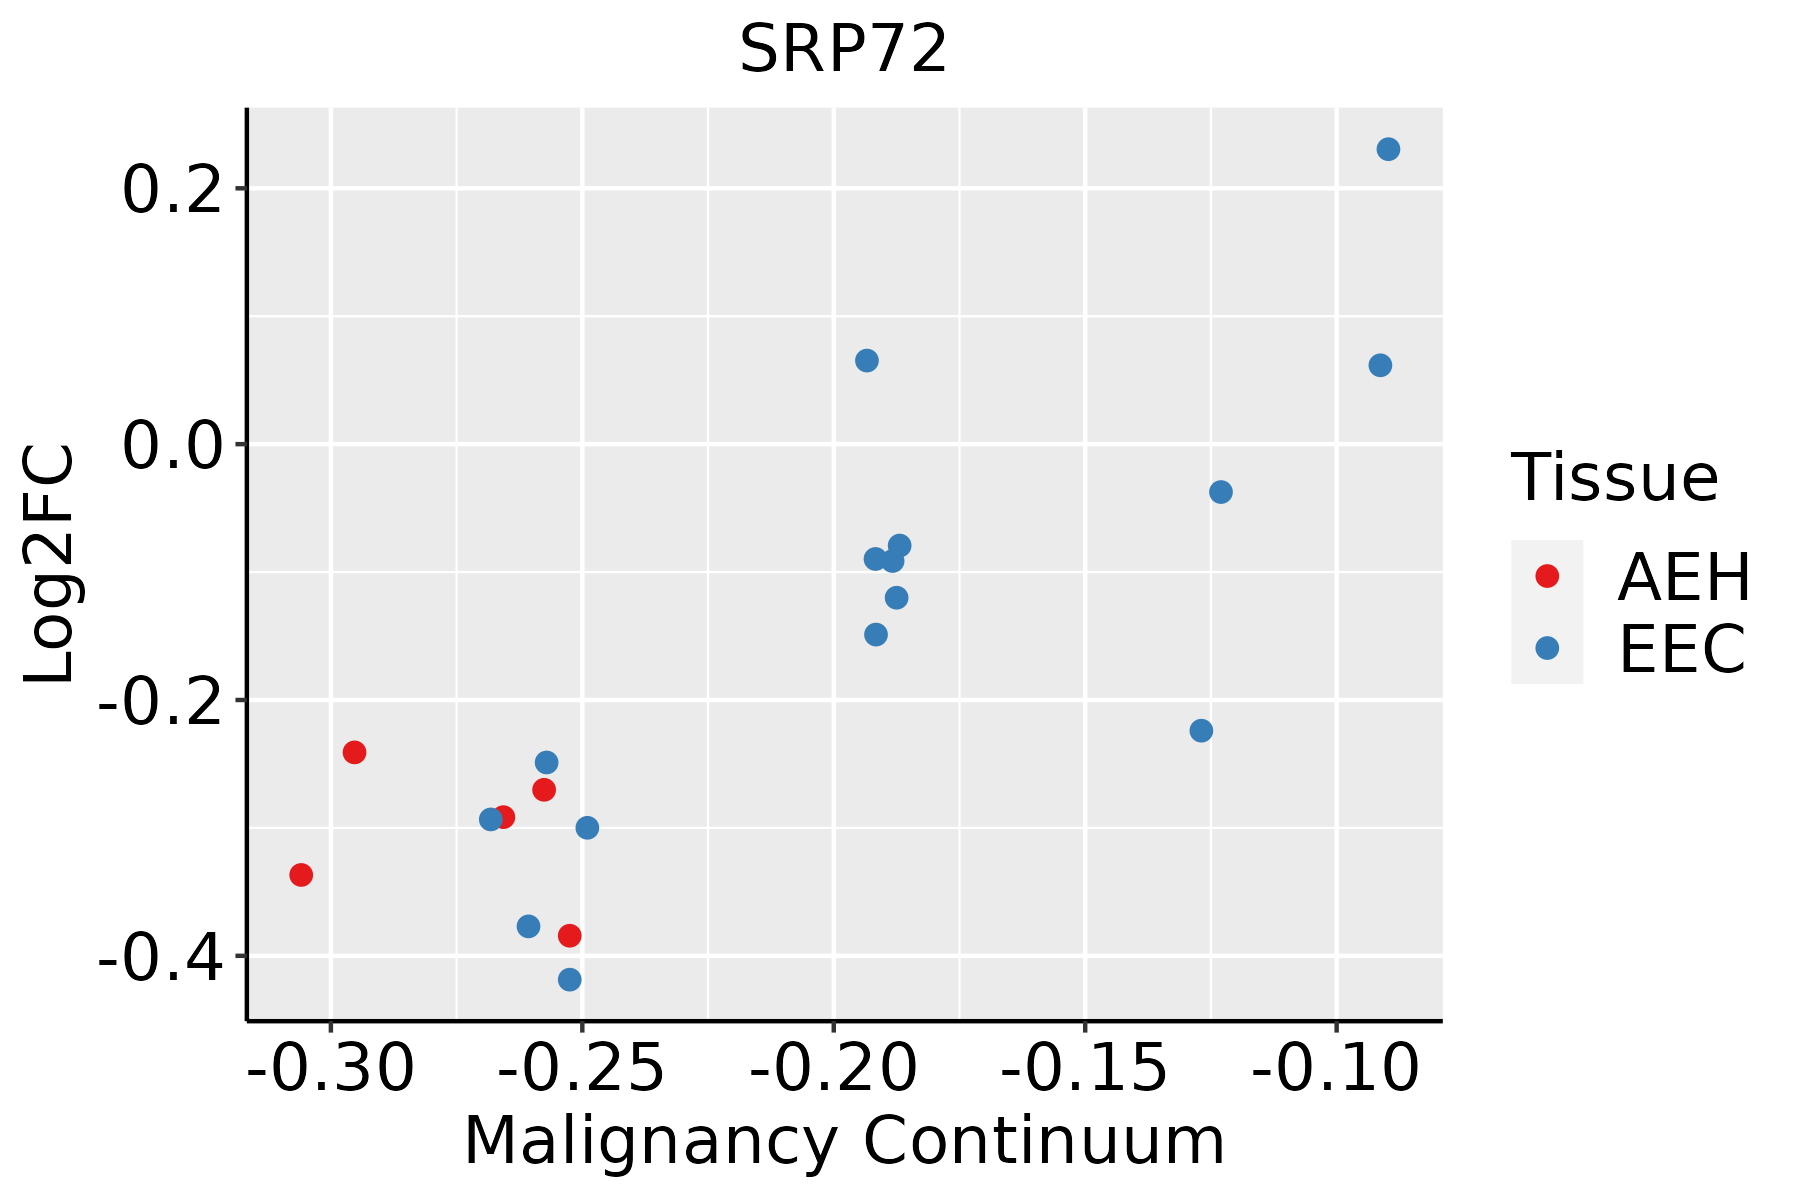 | AEH: Atypical endometrial hyperplasia |
| EEC: Endometrioid Cancer | ||
| Esophagus | 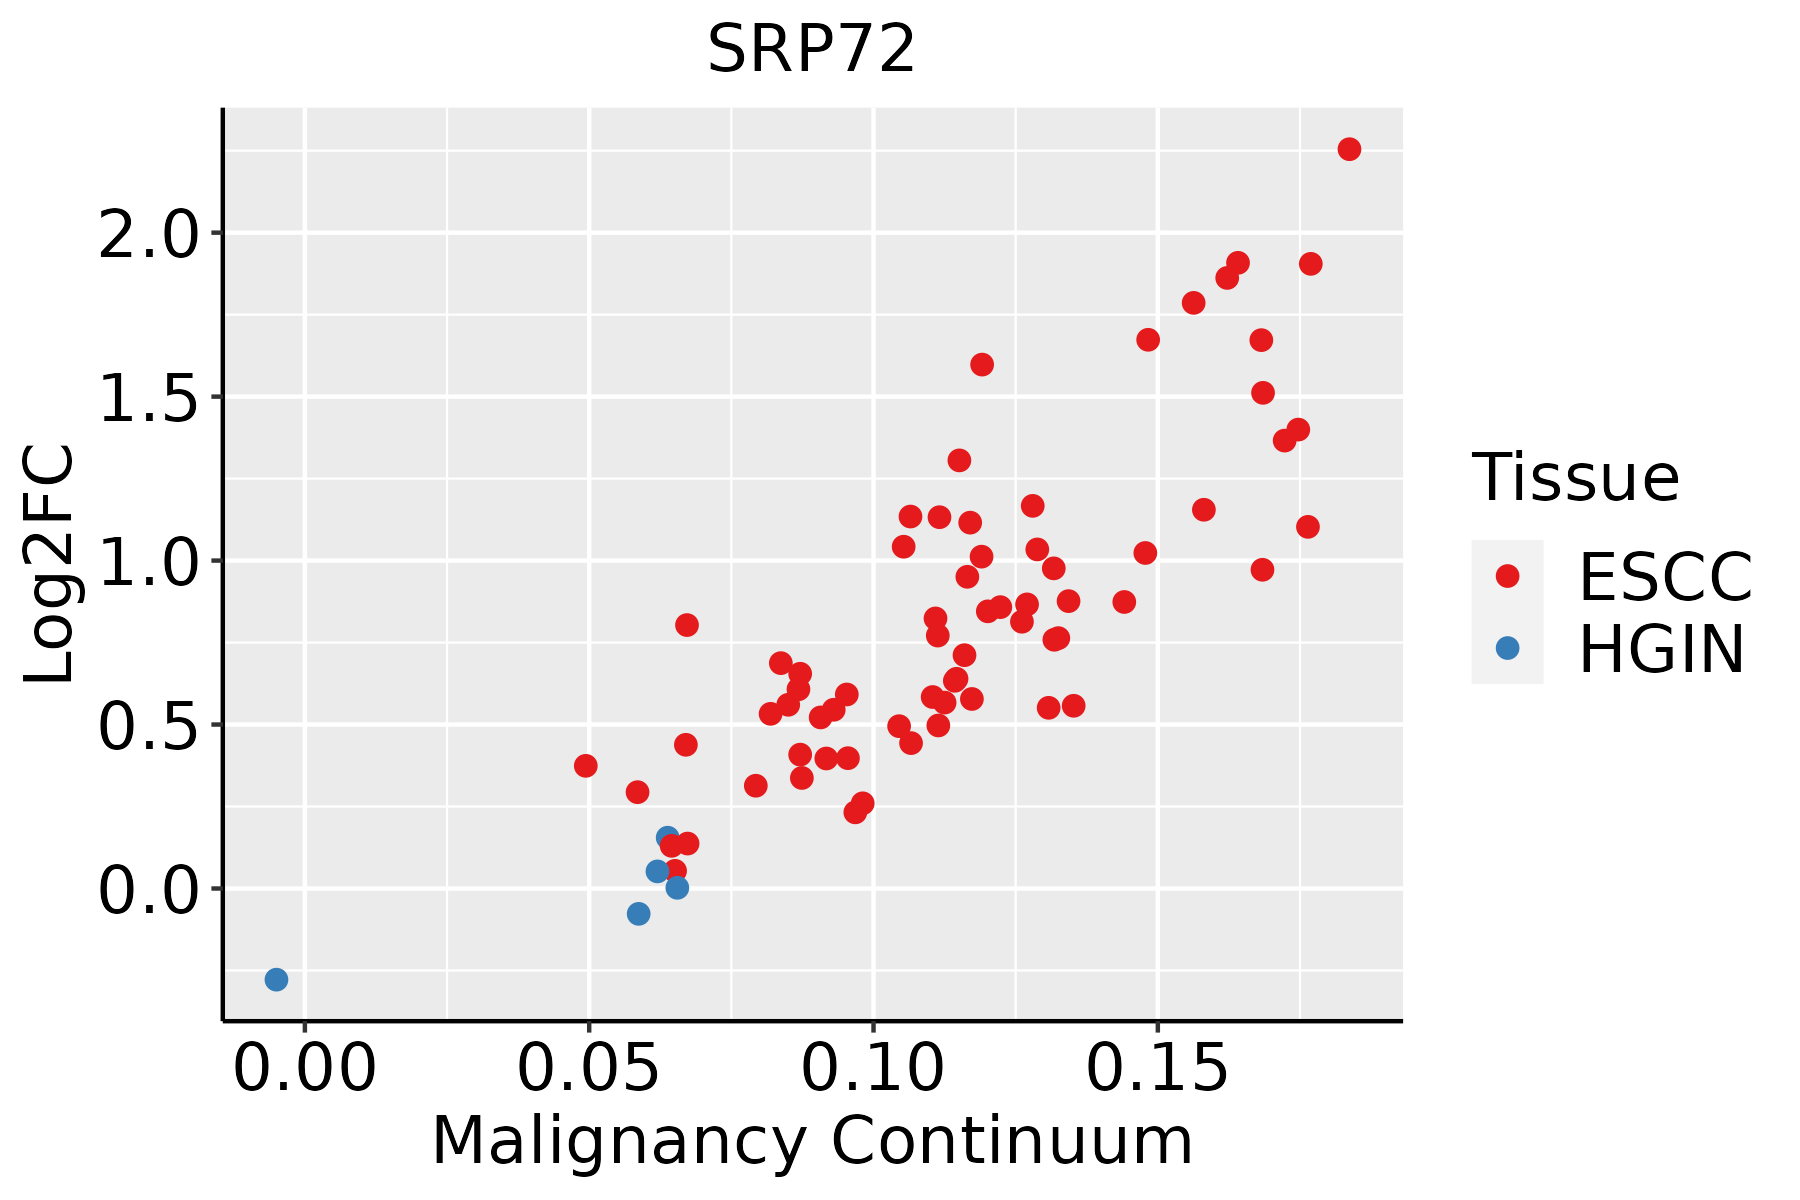 | ESCC: Esophageal squamous cell carcinoma |
| HGIN: High-grade intraepithelial neoplasias | ||
| LGIN: Low-grade intraepithelial neoplasias | ||
| Liver | 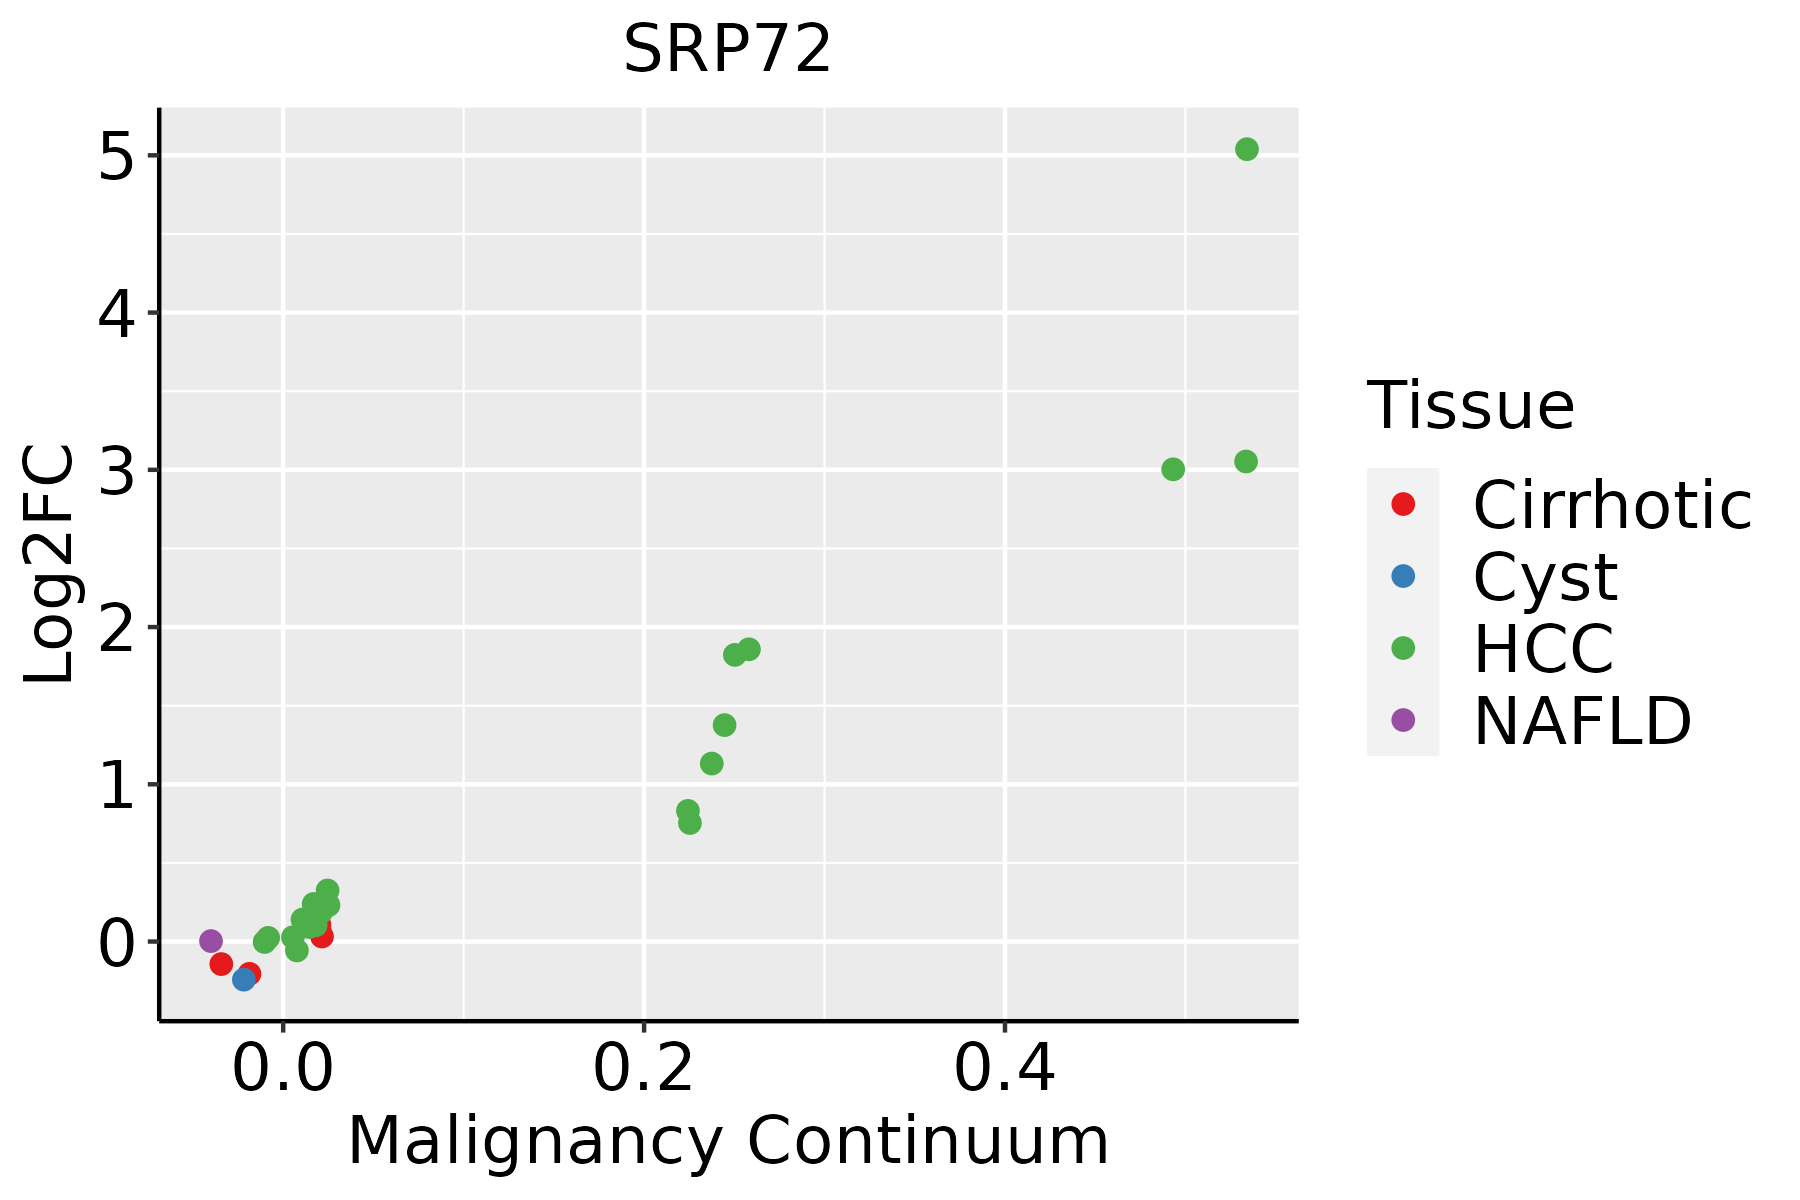 | HCC: Hepatocellular carcinoma |
| NAFLD: Non-alcoholic fatty liver disease | ||
| Oral Cavity | 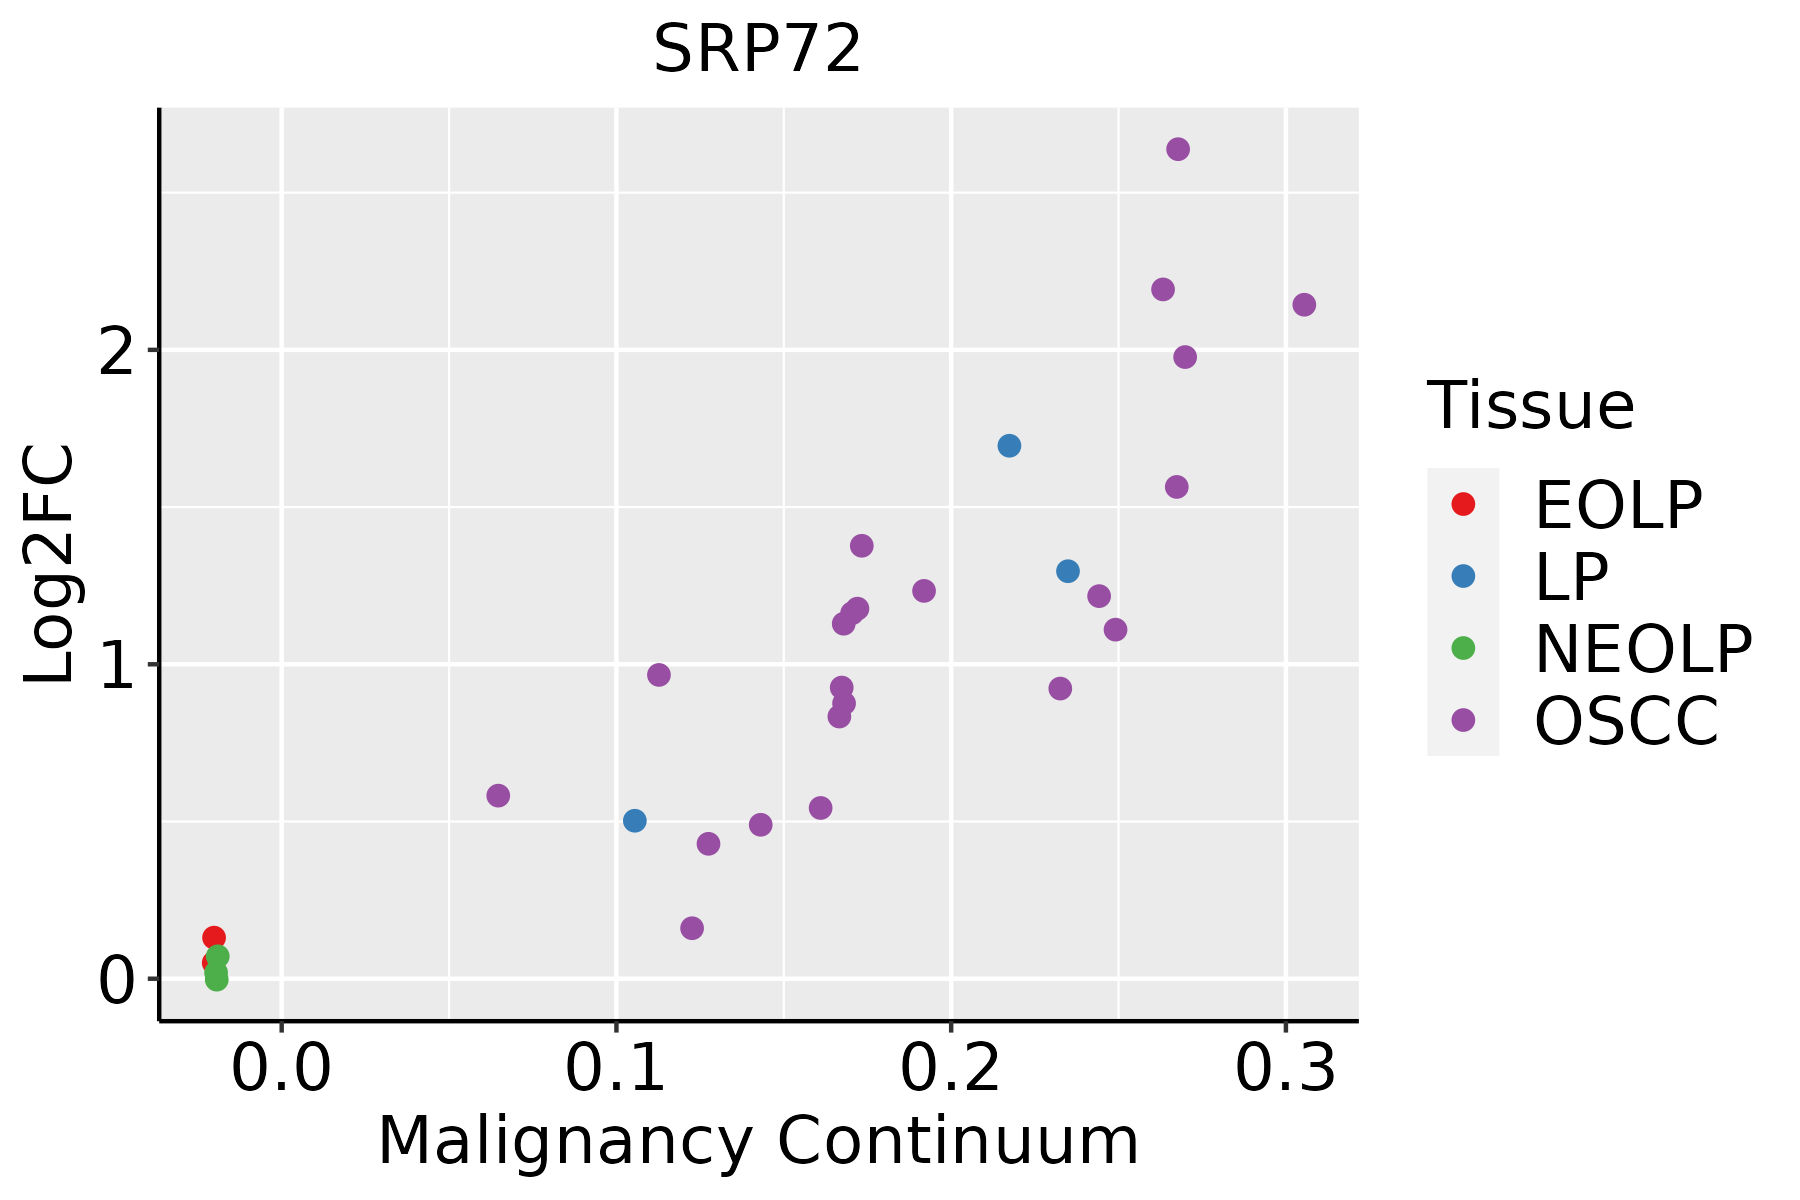 | EOLP: Erosive Oral lichen planus |
| LP: leukoplakia | ||
| NEOLP: Non-erosive oral lichen planus | ||
| OSCC: Oral squamous cell carcinoma | ||
| Prostate | 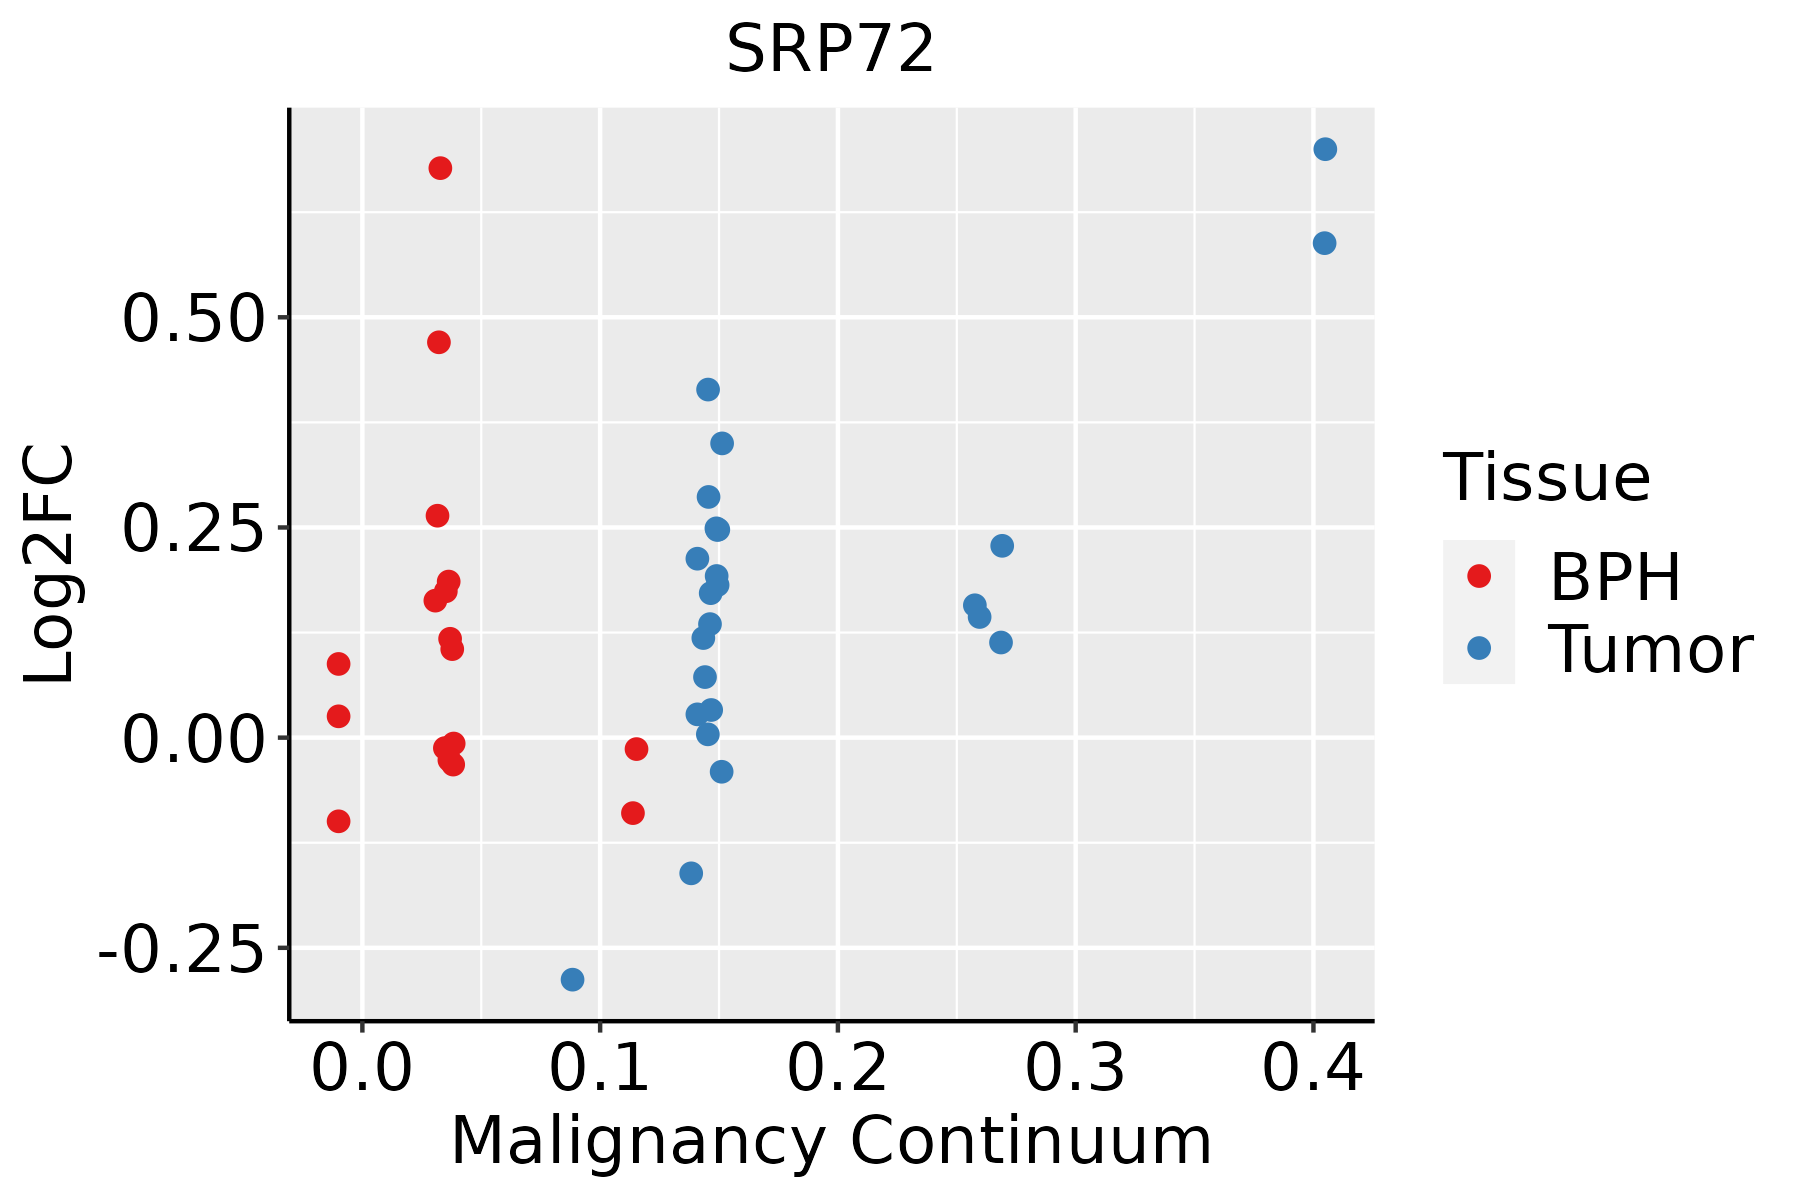 | BPH: Benign Prostatic Hyperplasia |
| Skin | 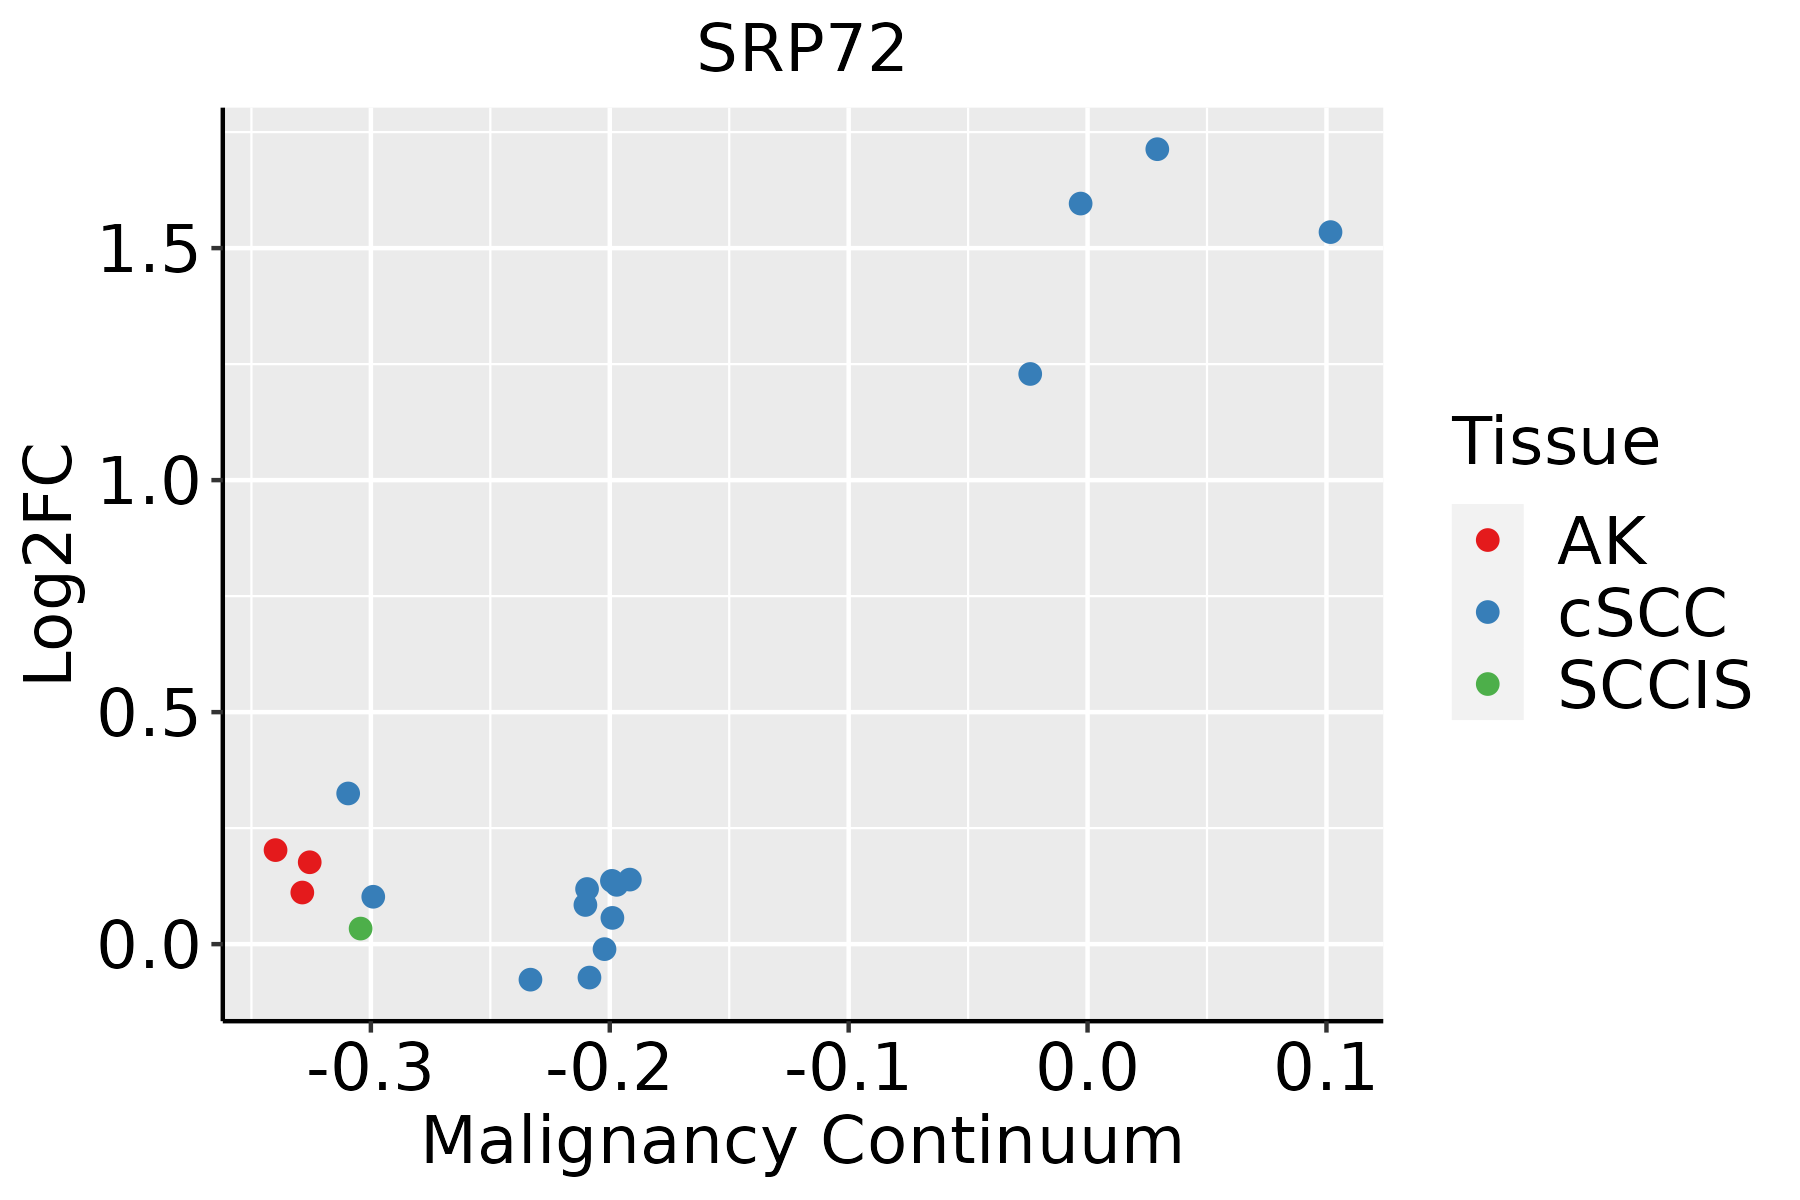 | AK: Actinic keratosis |
| cSCC: Cutaneous squamous cell carcinoma | ||
| SCCIS:squamous cell carcinoma in situ | ||
| Thyroid |  | ATC: Anaplastic thyroid cancer |
| HT: Hashimoto's thyroiditis | ||
| PTC: Papillary thyroid cancer |
| ∗log2FC in expression of this searched gene in stem-like cells from each diseased tissue sample relative to stem-like cells in normal samples in each tissue plotted against the malignancy continuum. Samples are colored based on if they are from different disease stage. |
Top |
Malignant transformation related pathway analysis |
| Find out the enriched GO biological processes and KEGG pathways involved in transition from healthy to precancer to cancer |
| Tissue | Disease Stage | Enriched GO biological Processes |
| Colorectum | AD |  |
| Colorectum | SER |  |
| Colorectum | MSS |  |
| Colorectum | MSI-H |  |
| Colorectum | FAP |  |
| ∗Top 15 enriched GO BP terms are showed in the bar plot of each disease state in each tissue. Each row represents a significant GO biological process which is colored according to the -log10(p.adjust). |
| Page: 1 2 3 4 5 6 7 8 9 |
| GO ID | Tissue | Disease Stage | Description | Gene Ratio | Bg Ratio | pvalue | p.adjust | Count |
| GO:000660532 | Oral cavity | NEOLP | protein targeting | 48/2005 | 314/18723 | 7.23e-03 | 3.66e-02 | 48 |
| GO:007259416 | Prostate | BPH | establishment of protein localization to organelle | 142/3107 | 422/18723 | 4.01e-18 | 1.31e-15 | 142 |
| GO:000660518 | Prostate | BPH | protein targeting | 102/3107 | 314/18723 | 2.51e-12 | 2.05e-10 | 102 |
| GO:00709728 | Prostate | BPH | protein localization to endoplasmic reticulum | 36/3107 | 74/18723 | 1.61e-10 | 9.22e-09 | 36 |
| GO:009015016 | Prostate | BPH | establishment of protein localization to membrane | 77/3107 | 260/18723 | 1.06e-07 | 2.56e-06 | 77 |
| GO:00725997 | Prostate | BPH | establishment of protein localization to endoplasmic reticulum | 23/3107 | 46/18723 | 1.71e-07 | 3.85e-06 | 23 |
| GO:00450476 | Prostate | BPH | protein targeting to ER | 21/3107 | 42/18723 | 5.88e-07 | 1.15e-05 | 21 |
| GO:00066134 | Prostate | BPH | cotranslational protein targeting to membrane | 15/3107 | 31/18723 | 4.00e-05 | 4.30e-04 | 15 |
| GO:0006614 | Prostate | BPH | SRP-dependent cotranslational protein targeting to membrane | 10/3107 | 26/18723 | 6.33e-03 | 2.89e-02 | 10 |
| GO:007259417 | Prostate | Tumor | establishment of protein localization to organelle | 151/3246 | 422/18723 | 3.19e-20 | 2.83e-17 | 151 |
| GO:000660519 | Prostate | Tumor | protein targeting | 109/3246 | 314/18723 | 6.11e-14 | 7.30e-12 | 109 |
| GO:007097216 | Prostate | Tumor | protein localization to endoplasmic reticulum | 36/3246 | 74/18723 | 5.66e-10 | 2.95e-08 | 36 |
| GO:007259913 | Prostate | Tumor | establishment of protein localization to endoplasmic reticulum | 23/3246 | 46/18723 | 3.87e-07 | 8.56e-06 | 23 |
| GO:009015017 | Prostate | Tumor | establishment of protein localization to membrane | 77/3246 | 260/18723 | 6.46e-07 | 1.33e-05 | 77 |
| GO:004504713 | Prostate | Tumor | protein targeting to ER | 21/3246 | 42/18723 | 1.24e-06 | 2.31e-05 | 21 |
| GO:000661312 | Prostate | Tumor | cotranslational protein targeting to membrane | 15/3246 | 31/18723 | 6.78e-05 | 7.21e-04 | 15 |
| GO:00066141 | Prostate | Tumor | SRP-dependent cotranslational protein targeting to membrane | 10/3246 | 26/18723 | 8.67e-03 | 3.76e-02 | 10 |
| GO:007259427 | Skin | cSCC | establishment of protein localization to organelle | 213/4864 | 422/18723 | 1.40e-27 | 5.15e-25 | 213 |
| GO:000660527 | Skin | cSCC | protein targeting | 153/4864 | 314/18723 | 2.62e-18 | 3.36e-16 | 153 |
| GO:009015024 | Skin | cSCC | establishment of protein localization to membrane | 123/4864 | 260/18723 | 8.34e-14 | 5.18e-12 | 123 |
| Page: 1 2 3 4 5 6 7 |
| Pathway ID | Tissue | Disease Stage | Description | Gene Ratio | Bg Ratio | pvalue | p.adjust | qvalue | Count |
| hsa03060 | Colorectum | AD | Protein export | 14/2092 | 23/8465 | 2.43e-04 | 1.90e-03 | 1.21e-03 | 14 |
| hsa030601 | Colorectum | AD | Protein export | 14/2092 | 23/8465 | 2.43e-04 | 1.90e-03 | 1.21e-03 | 14 |
| hsa030602 | Colorectum | MSS | Protein export | 15/1875 | 23/8465 | 1.13e-05 | 1.26e-04 | 7.71e-05 | 15 |
| hsa030603 | Colorectum | MSS | Protein export | 15/1875 | 23/8465 | 1.13e-05 | 1.26e-04 | 7.71e-05 | 15 |
| hsa030606 | Colorectum | FAP | Protein export | 10/1404 | 23/8465 | 2.17e-03 | 1.05e-02 | 6.39e-03 | 10 |
| hsa030607 | Colorectum | FAP | Protein export | 10/1404 | 23/8465 | 2.17e-03 | 1.05e-02 | 6.39e-03 | 10 |
| hsa0306014 | Endometrium | AEH | Protein export | 11/1197 | 23/8465 | 1.14e-04 | 1.06e-03 | 7.73e-04 | 11 |
| hsa0306015 | Endometrium | AEH | Protein export | 11/1197 | 23/8465 | 1.14e-04 | 1.06e-03 | 7.73e-04 | 11 |
| hsa0306023 | Endometrium | EEC | Protein export | 11/1237 | 23/8465 | 1.54e-04 | 1.41e-03 | 1.05e-03 | 11 |
| hsa0306033 | Endometrium | EEC | Protein export | 11/1237 | 23/8465 | 1.54e-04 | 1.41e-03 | 1.05e-03 | 11 |
| hsa0306026 | Esophagus | ESCC | Protein export | 22/4205 | 23/8465 | 2.43e-06 | 1.43e-05 | 7.32e-06 | 22 |
| hsa0306036 | Esophagus | ESCC | Protein export | 22/4205 | 23/8465 | 2.43e-06 | 1.43e-05 | 7.32e-06 | 22 |
| hsa030608 | Liver | Cirrhotic | Protein export | 20/2530 | 23/8465 | 2.00e-08 | 3.51e-07 | 2.17e-07 | 20 |
| hsa0306011 | Liver | Cirrhotic | Protein export | 20/2530 | 23/8465 | 2.00e-08 | 3.51e-07 | 2.17e-07 | 20 |
| hsa0306021 | Liver | HCC | Protein export | 21/4020 | 23/8465 | 1.20e-05 | 8.53e-05 | 4.74e-05 | 21 |
| hsa0306031 | Liver | HCC | Protein export | 21/4020 | 23/8465 | 1.20e-05 | 8.53e-05 | 4.74e-05 | 21 |
| hsa0306018 | Oral cavity | OSCC | Protein export | 21/3704 | 23/8465 | 2.42e-06 | 1.27e-05 | 6.45e-06 | 21 |
| hsa0306019 | Oral cavity | OSCC | Protein export | 21/3704 | 23/8465 | 2.42e-06 | 1.27e-05 | 6.45e-06 | 21 |
| hsa0306025 | Oral cavity | LP | Protein export | 21/2418 | 23/8465 | 4.72e-10 | 8.28e-09 | 5.34e-09 | 21 |
| hsa0306035 | Oral cavity | LP | Protein export | 21/2418 | 23/8465 | 4.72e-10 | 8.28e-09 | 5.34e-09 | 21 |
| Page: 1 2 |
Top |
Cell-cell communication analysis |
| Identification of potential cell-cell interactions between two cell types and their ligand-receptor pairs for different disease states |
| Ligand | Receptor | LRpair | Pathway | Tissue | Disease Stage |
| Page: 1 |
Top |
Single-cell gene regulatory network inference analysis |
| Find out the significant the regulons (TFs) and the target genes of each regulon across cell types for different disease states |
| TF | Cell Type | Tissue | Disease Stage | Target Gene | RSS | Regulon Activity |
| ∗The dot plots of a searched regulon are shown for all cell subpopulations in each disease state of each tissue based on the regulon specific score inferred using pySCENIC and by calculating the average expression. |
| Page: 1 |
Top |
Somatic mutation of malignant transformation related genes |
| Annotation of somatic variants for genes involved in malignant transformation |
| Hugo Symbol | Variant Class | Variant Classification | dbSNP RS | HGVSc | HGVSp | HGVSp Short | SWISSPROT | BIOTYPE | SIFT | PolyPhen | Tumor Sample Barcode | Tissue | Histology | Sex | Age | Stage | Therapy Types | Drugs | Outcome |
| SRP72 | SNV | Missense_Mutation | novel | c.1305N>T | p.Trp435Cys | p.W435C | O76094 | protein_coding | deleterious(0) | possibly_damaging(0.907) | TCGA-A2-A3XV-01 | Breast | breast invasive carcinoma | Female | <65 | I/II | Chemotherapy | carboplatin | CR |
| SRP72 | SNV | Missense_Mutation | rs781230154 | c.37N>A | p.Ala13Thr | p.A13T | O76094 | protein_coding | tolerated(0.17) | benign(0.115) | TCGA-AO-A0JG-01 | Breast | breast invasive carcinoma | Female | <65 | III/IV | Chemotherapy | doxorubicin | SD |
| SRP72 | SNV | Missense_Mutation | c.652N>A | p.Glu218Lys | p.E218K | O76094 | protein_coding | deleterious(0.04) | probably_damaging(0.998) | TCGA-EK-A3GK-01 | Cervix | cervical & endocervical cancer | Female | <65 | I/II | Unknown | Unknown | SD | |
| SRP72 | SNV | Missense_Mutation | c.1188N>C | p.Leu396Phe | p.L396F | O76094 | protein_coding | deleterious(0.04) | probably_damaging(0.976) | TCGA-EK-A3GK-01 | Cervix | cervical & endocervical cancer | Female | <65 | I/II | Unknown | Unknown | SD | |
| SRP72 | SNV | Missense_Mutation | novel | c.499G>A | p.Glu167Lys | p.E167K | O76094 | protein_coding | tolerated(0.15) | possibly_damaging(0.776) | TCGA-ZJ-AB0H-01 | Cervix | cervical & endocervical cancer | Female | <65 | III/IV | Unknown | Unknown | SD |
| SRP72 | SNV | Missense_Mutation | rs763555511 | c.1742N>A | p.Arg581Gln | p.R581Q | O76094 | protein_coding | tolerated(0.07) | possibly_damaging(0.57) | TCGA-AA-3845-01 | Colorectum | colon adenocarcinoma | Female | >=65 | I/II | Unknown | Unknown | PD |
| SRP72 | SNV | Missense_Mutation | c.1892N>T | p.Ala631Val | p.A631V | O76094 | protein_coding | tolerated(0.13) | benign(0.001) | TCGA-AA-3977-01 | Colorectum | colon adenocarcinoma | Male | >=65 | I/II | Unknown | Unknown | SD | |
| SRP72 | SNV | Missense_Mutation | novel | c.101N>G | p.Val34Gly | p.V34G | O76094 | protein_coding | deleterious(0) | benign(0.173) | TCGA-AA-A00N-01 | Colorectum | colon adenocarcinoma | Male | >=65 | I/II | Unknown | Unknown | PD |
| SRP72 | SNV | Missense_Mutation | novel | c.1183N>C | p.Ile395Leu | p.I395L | O76094 | protein_coding | deleterious(0.04) | benign(0.006) | TCGA-CA-6717-01 | Colorectum | colon adenocarcinoma | Male | <65 | I/II | Chemotherapy | oxaliplatin | CR |
| SRP72 | SNV | Missense_Mutation | c.760A>C | p.Lys254Gln | p.K254Q | O76094 | protein_coding | deleterious(0) | probably_damaging(0.99) | TCGA-CA-6718-01 | Colorectum | colon adenocarcinoma | Male | <65 | I/II | Unknown | Unknown | PD |
| Page: 1 2 3 4 5 6 7 |
Top |
Related drugs of malignant transformation related genes |
| Identification of chemicals and drugs interact with genes involved in malignant transfromation |
| (DGIdb 4.0) |
| Entrez ID | Symbol | Category | Interaction Types | Drug Claim Name | Drug Name | PMIDs |
| Page: 1 |

Copyright 2023-Present -The University of Texas Health Science Center at Houston |