
|
|||||
|
 | |
| |
| |
| |
| |
| |
|
Gene: SLC52A2 |
Gene summary for SLC52A2 |
| Gene information | Species | Human | Gene symbol | SLC52A2 | Gene ID | 79581 |
| Gene name | solute carrier family 52 member 2 | |
| Gene Alias | BVVLS2 | |
| Cytomap | 8q24.3 | |
| Gene Type | protein-coding | GO ID | GO:0006766 | UniProtAcc | Q9HAB3 |
Top |
Malignant transformation analysis |
| Identification of the aberrant gene expression in precancerous and cancerous lesions by comparing the gene expression of stem-like cells in diseased tissues with normal stem cells |
| Entrez ID | Symbol | Replicates | Species | Organ | Tissue | Adj P-value | Log2FC | Malignancy |
| 79581 | SLC52A2 | GSM4909281 | Human | Breast | IDC | 6.45e-21 | 5.74e-01 | 0.21 |
| 79581 | SLC52A2 | GSM4909285 | Human | Breast | IDC | 4.13e-09 | 3.13e-01 | 0.21 |
| 79581 | SLC52A2 | GSM4909311 | Human | Breast | IDC | 5.96e-07 | 7.38e-02 | 0.1534 |
| 79581 | SLC52A2 | GSM4909312 | Human | Breast | IDC | 4.84e-09 | 3.93e-01 | 0.1552 |
| 79581 | SLC52A2 | GSM4909317 | Human | Breast | IDC | 2.94e-04 | 3.35e-01 | 0.1355 |
| 79581 | SLC52A2 | GSM4909319 | Human | Breast | IDC | 2.56e-16 | 1.24e-01 | 0.1563 |
| 79581 | SLC52A2 | GSM4909321 | Human | Breast | IDC | 7.53e-03 | 2.24e-01 | 0.1559 |
| 79581 | SLC52A2 | brca1 | Human | Breast | Precancer | 6.20e-03 | 2.94e-01 | -0.0338 |
| 79581 | SLC52A2 | brca2 | Human | Breast | Precancer | 2.85e-06 | 2.65e-01 | -0.024 |
| 79581 | SLC52A2 | NCCBC5 | Human | Breast | DCIS | 3.16e-03 | 2.77e-02 | 0.2046 |
| 79581 | SLC52A2 | P1 | Human | Breast | IDC | 1.23e-02 | -1.15e-01 | 0.1527 |
| 79581 | SLC52A2 | DCIS2 | Human | Breast | DCIS | 1.14e-30 | 8.19e-02 | 0.0085 |
| 79581 | SLC52A2 | HTA11_2487_2000001011 | Human | Colorectum | SER | 1.24e-02 | 3.26e-01 | -0.1808 |
| 79581 | SLC52A2 | HTA11_1938_2000001011 | Human | Colorectum | AD | 1.05e-04 | 4.10e-01 | -0.0811 |
| 79581 | SLC52A2 | HTA11_347_2000001011 | Human | Colorectum | AD | 4.80e-04 | 2.51e-01 | -0.1954 |
| 79581 | SLC52A2 | HTA11_2112_2000001011 | Human | Colorectum | SER | 6.38e-03 | 5.98e-01 | -0.2196 |
| 79581 | SLC52A2 | HTA11_696_2000001011 | Human | Colorectum | AD | 6.04e-04 | 2.37e-01 | -0.1464 |
| 79581 | SLC52A2 | HTA11_866_2000001011 | Human | Colorectum | AD | 8.13e-05 | 2.02e-01 | -0.1001 |
| 79581 | SLC52A2 | HTA11_1391_2000001011 | Human | Colorectum | AD | 4.57e-09 | 5.41e-01 | -0.059 |
| 79581 | SLC52A2 | HTA11_7696_3000711011 | Human | Colorectum | AD | 6.70e-07 | 2.91e-01 | 0.0674 |
| Page: 1 2 3 4 5 6 7 8 |
| Tissue | Expression Dynamics | Abbreviation |
| Breast | 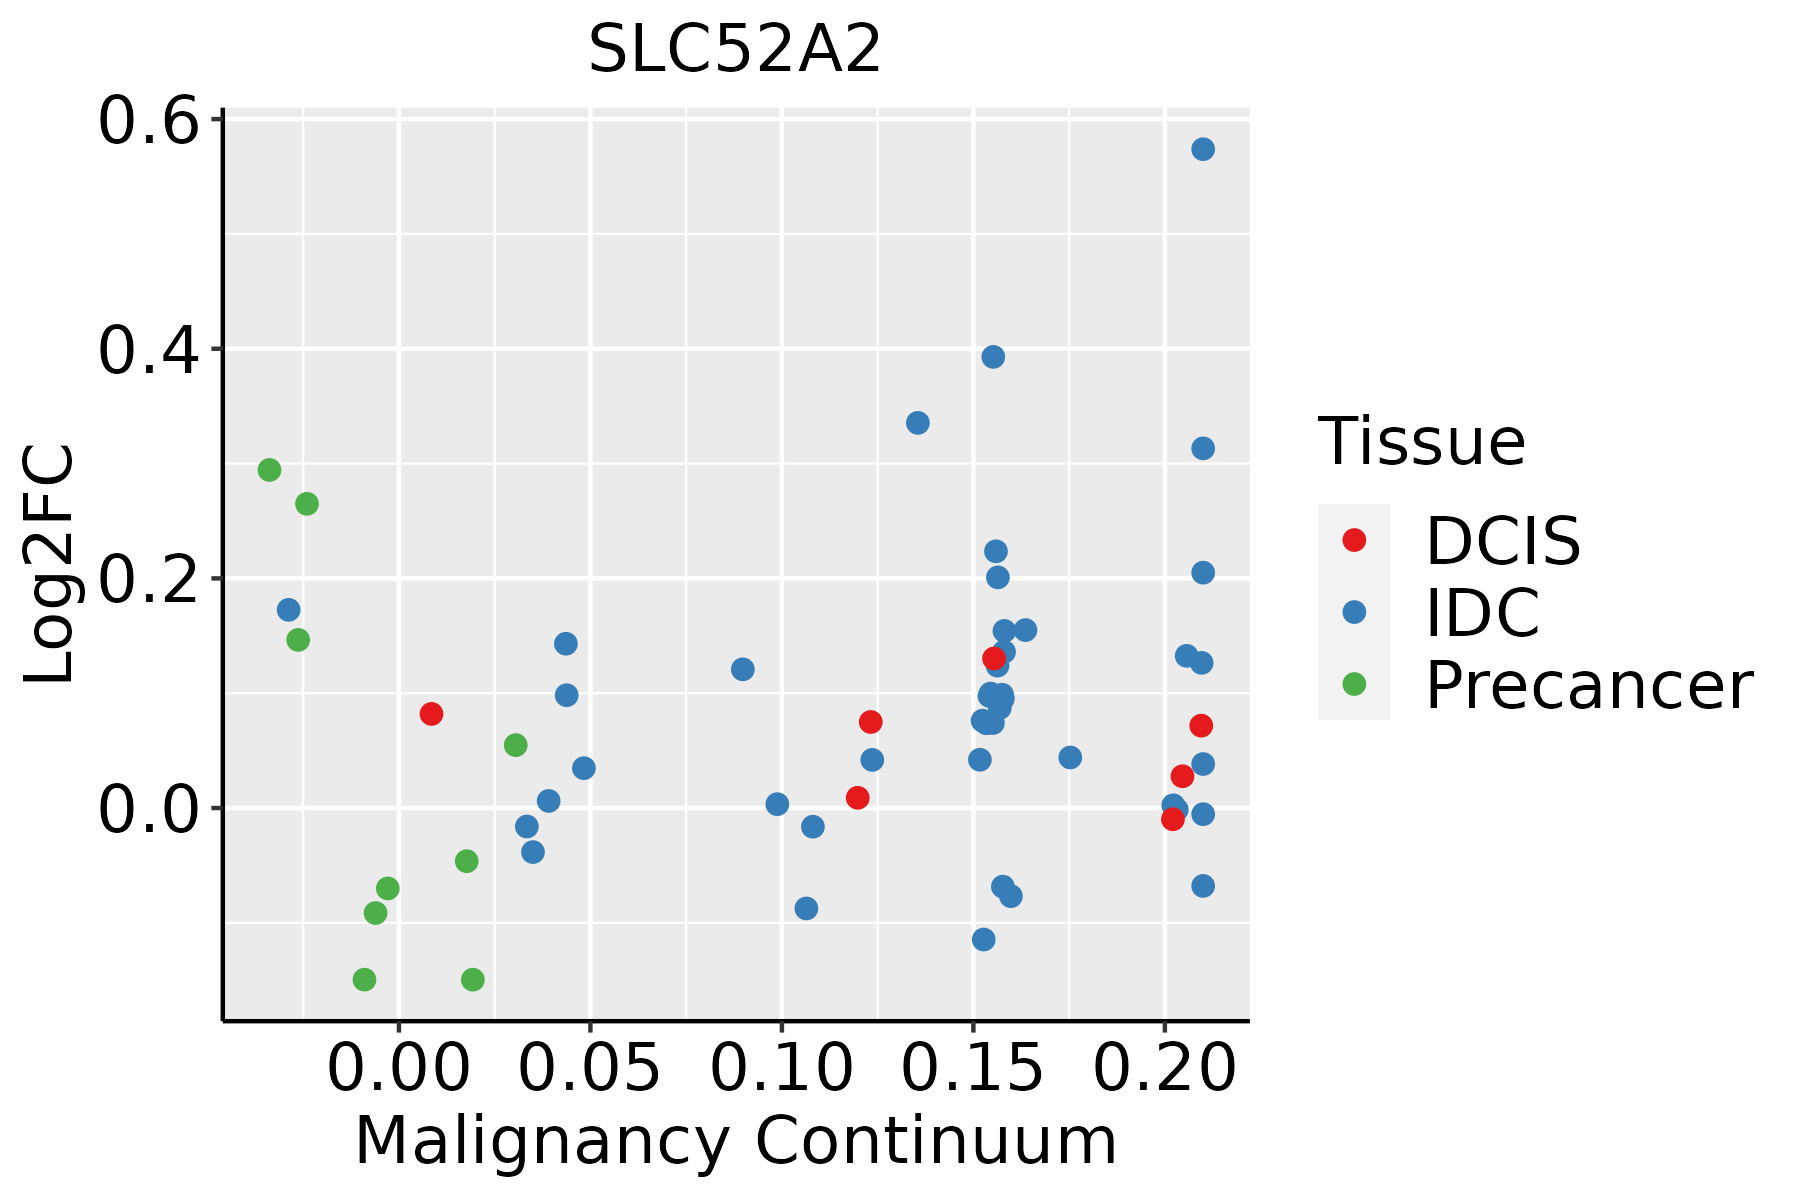 | IDC: Invasive ductal carcinoma |
| DCIS: Ductal carcinoma in situ | ||
| Precancer(BRCA1-mut): Precancerous lesion from BRCA1 mutation carriers | ||
| Colorectum (GSE201348) |  | FAP: Familial adenomatous polyposis |
| CRC: Colorectal cancer | ||
| Colorectum (HTA11) |  | AD: Adenomas |
| SER: Sessile serrated lesions | ||
| MSI-H: Microsatellite-high colorectal cancer | ||
| MSS: Microsatellite stable colorectal cancer | ||
| Esophagus | 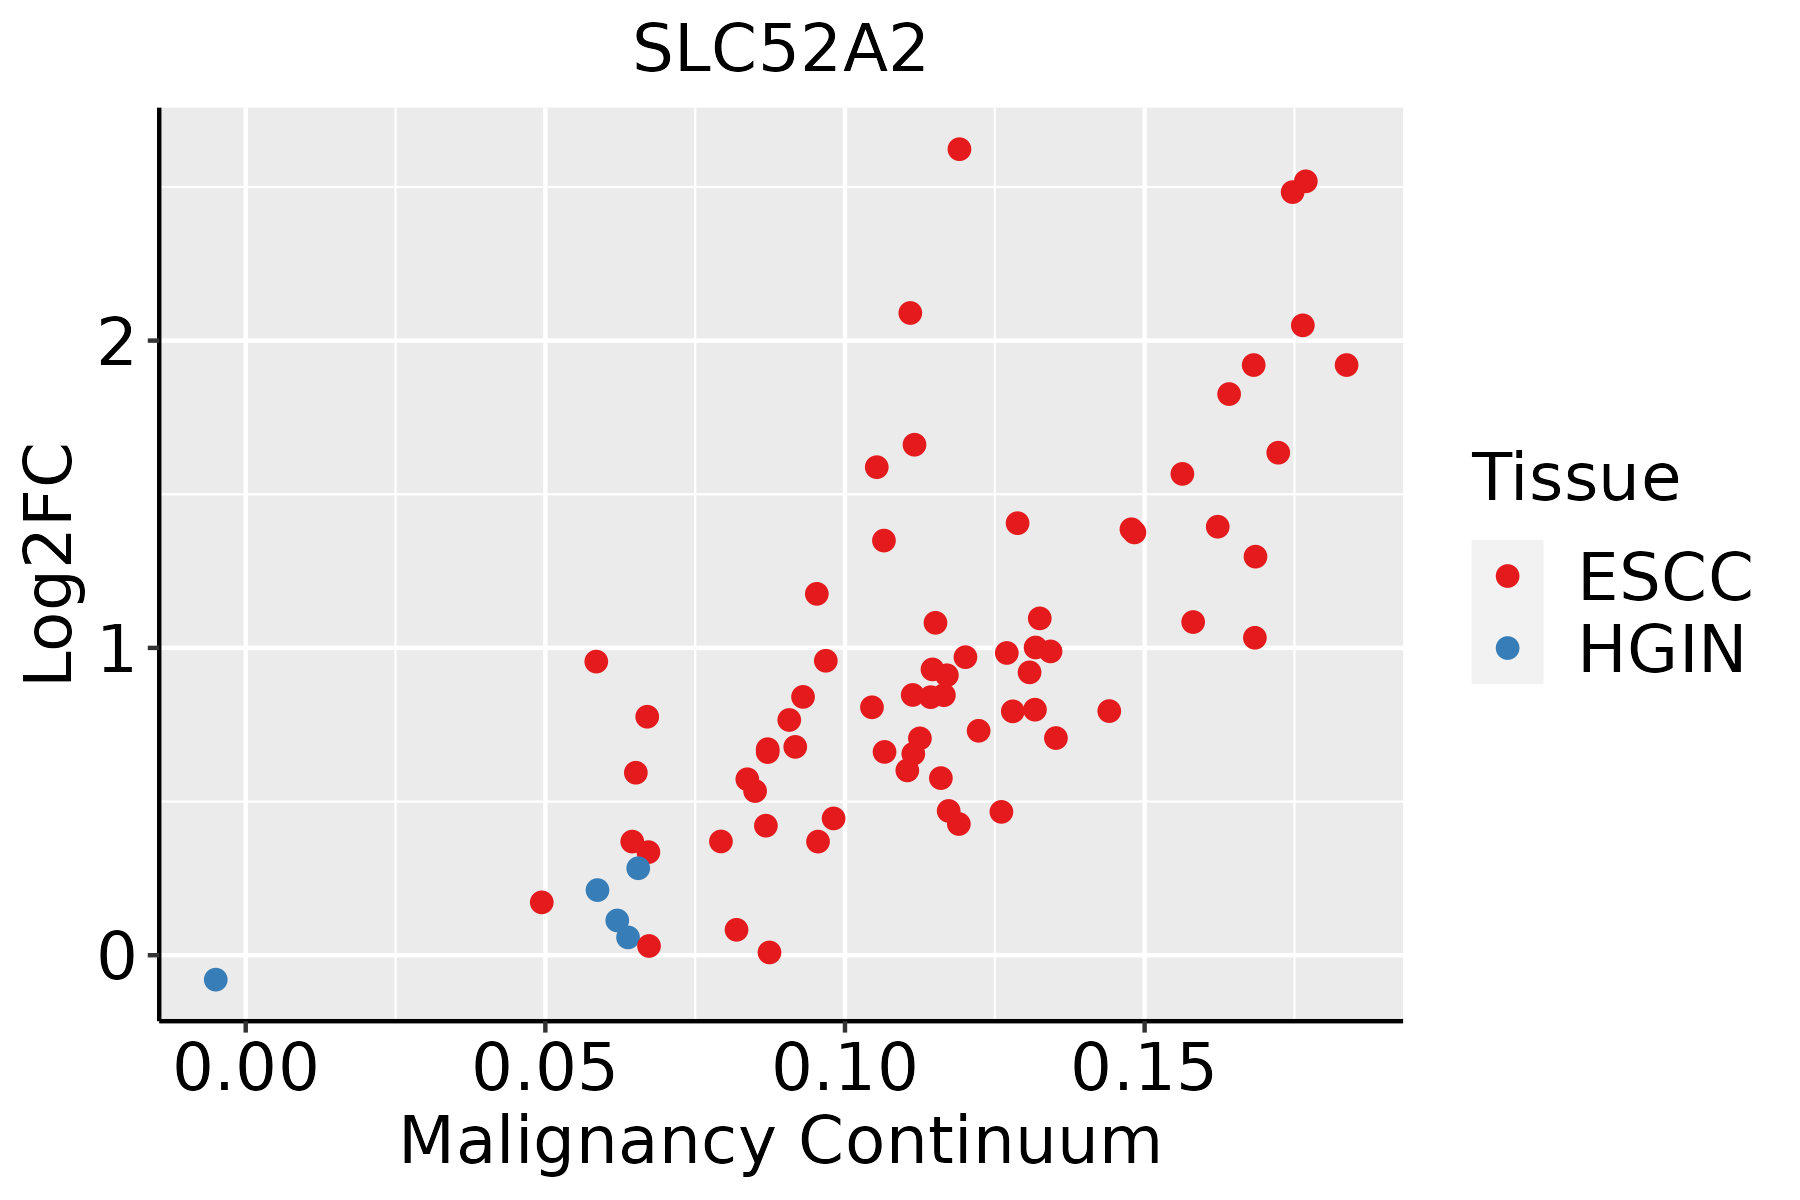 | ESCC: Esophageal squamous cell carcinoma |
| HGIN: High-grade intraepithelial neoplasias | ||
| LGIN: Low-grade intraepithelial neoplasias | ||
| Liver | 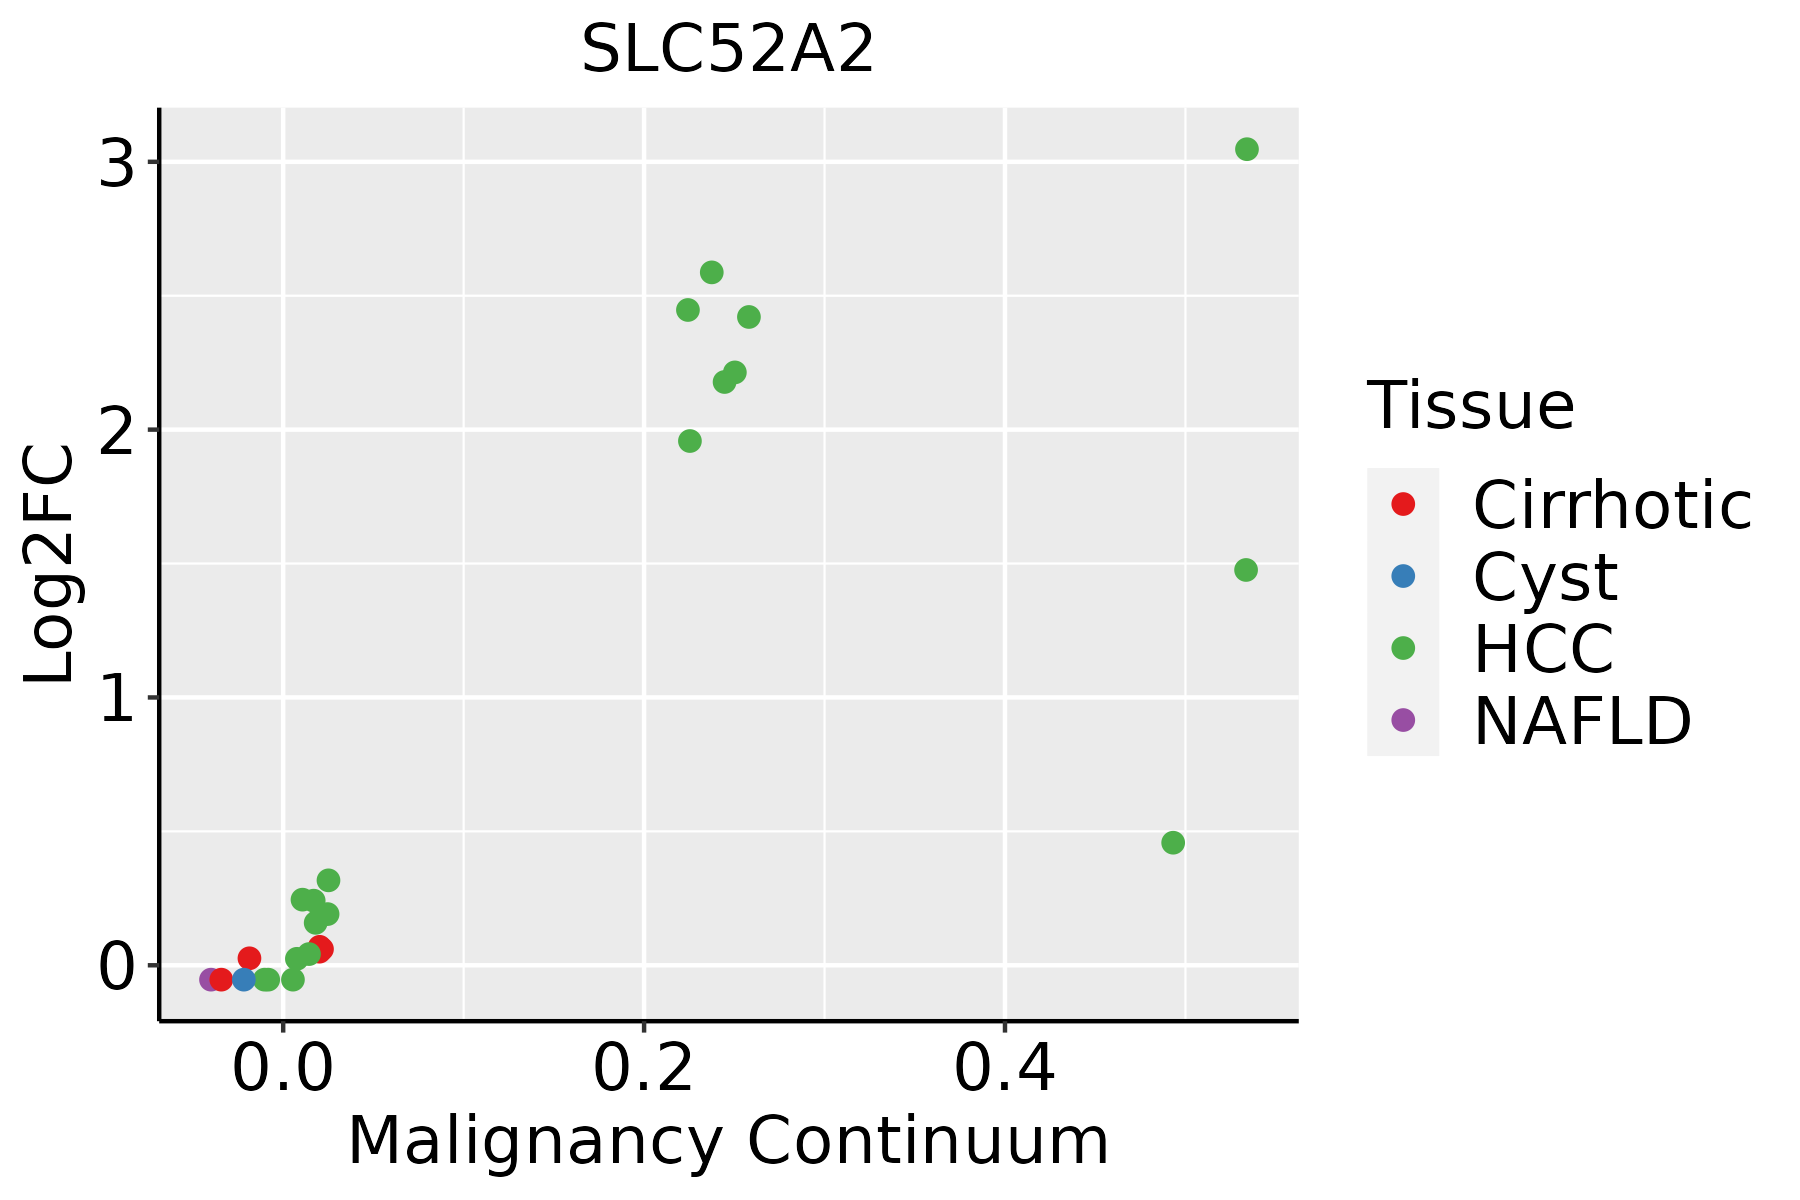 | HCC: Hepatocellular carcinoma |
| NAFLD: Non-alcoholic fatty liver disease | ||
| Oral Cavity | 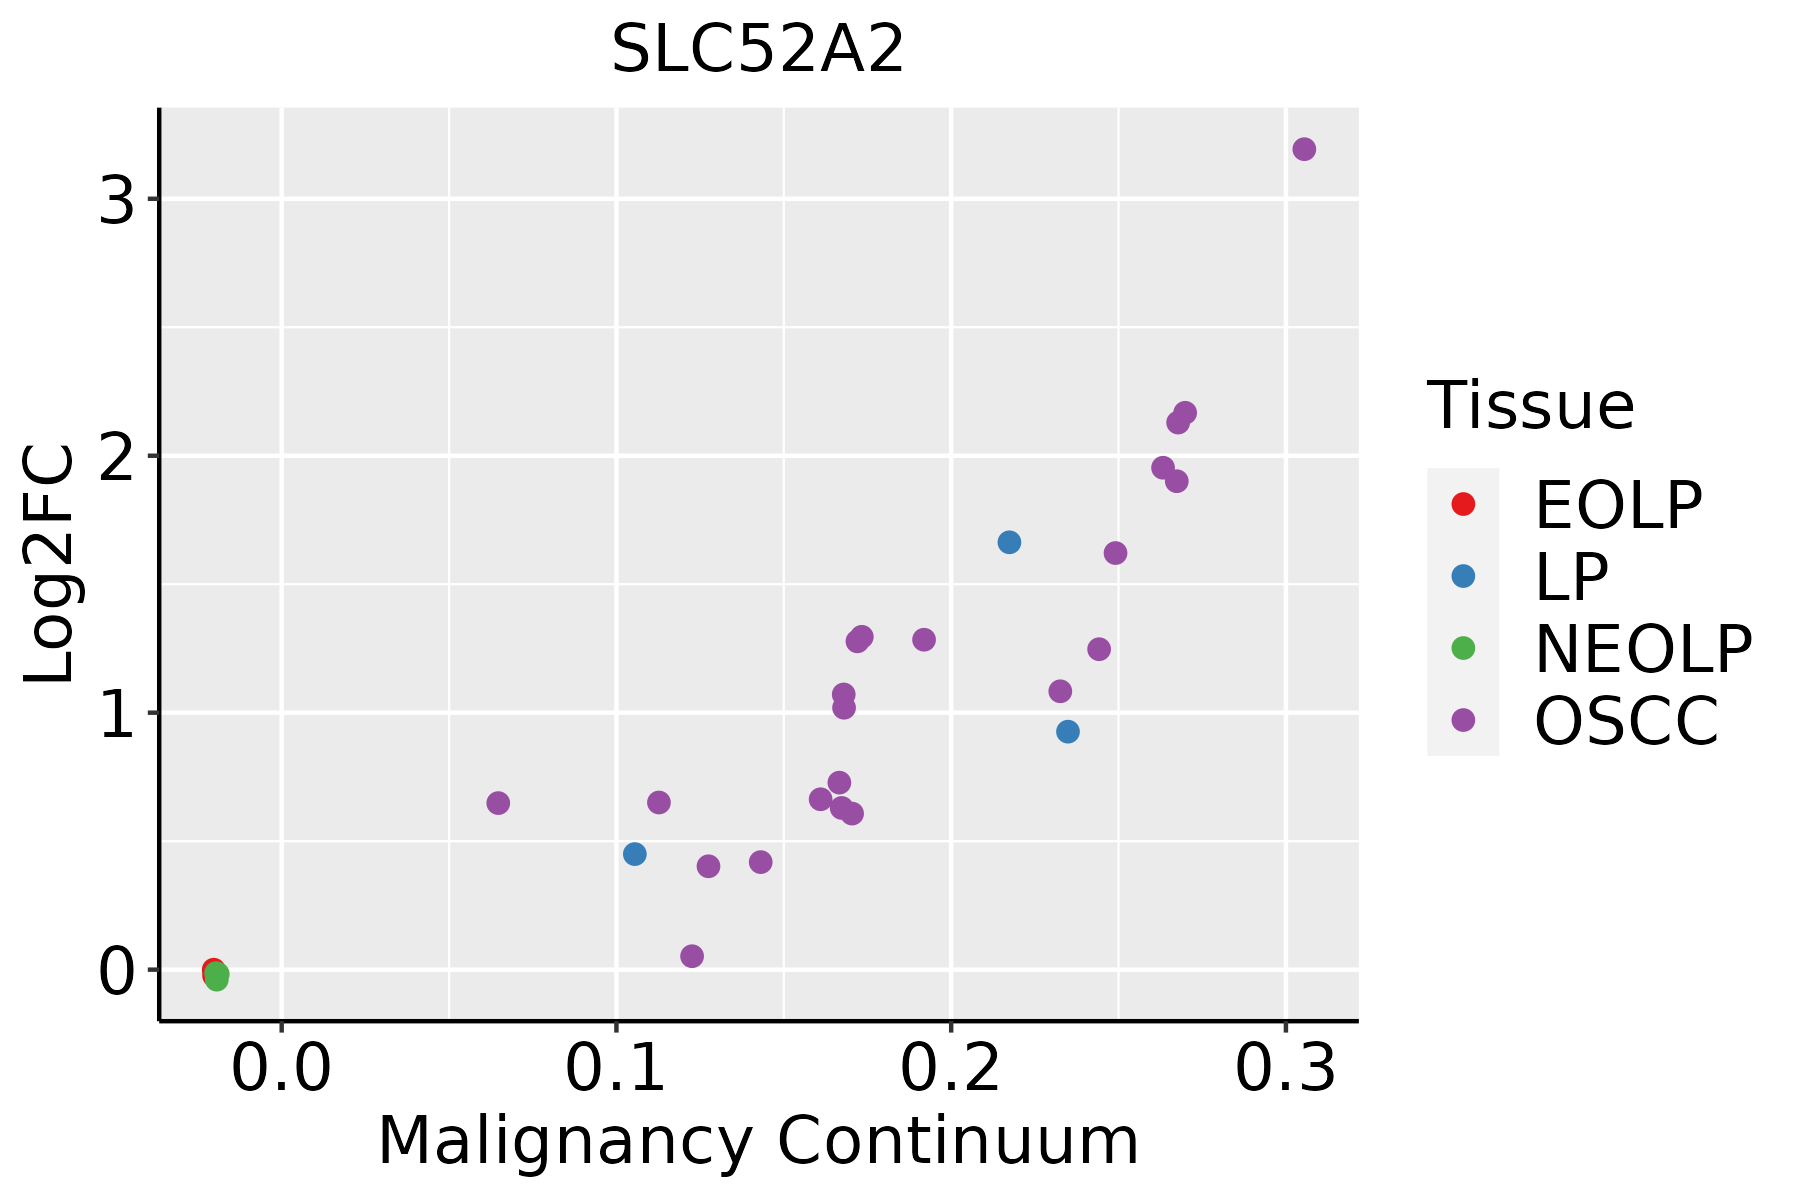 | EOLP: Erosive Oral lichen planus |
| LP: leukoplakia | ||
| NEOLP: Non-erosive oral lichen planus | ||
| OSCC: Oral squamous cell carcinoma | ||
| Skin | 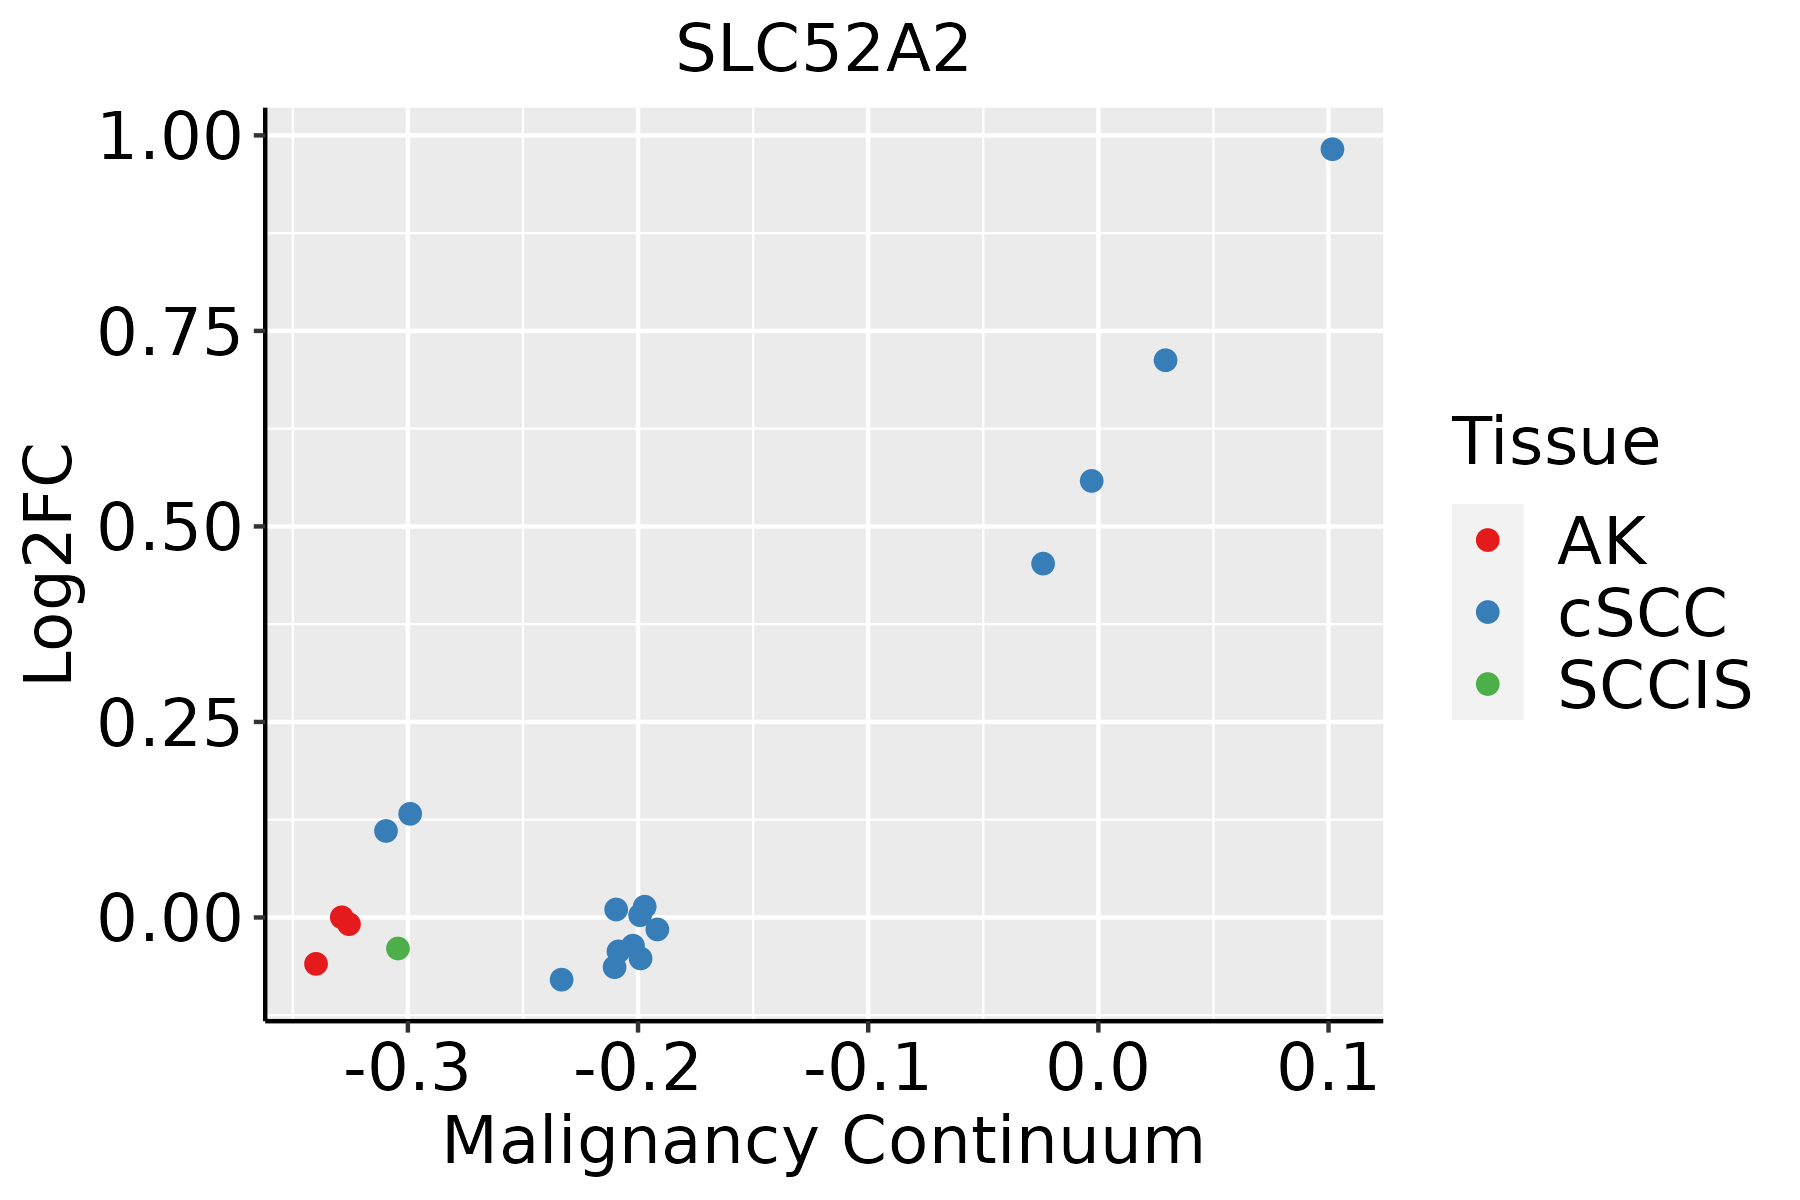 | AK: Actinic keratosis |
| cSCC: Cutaneous squamous cell carcinoma | ||
| SCCIS:squamous cell carcinoma in situ | ||
| Thyroid |  | ATC: Anaplastic thyroid cancer |
| HT: Hashimoto's thyroiditis | ||
| PTC: Papillary thyroid cancer |
| ∗log2FC in expression of this searched gene in stem-like cells from each diseased tissue sample relative to stem-like cells in normal samples in each tissue plotted against the malignancy continuum. Samples are colored based on if they are from different disease stage. |
Top |
Malignant transformation related pathway analysis |
| Find out the enriched GO biological processes and KEGG pathways involved in transition from healthy to precancer to cancer |
| Tissue | Disease Stage | Enriched GO biological Processes |
| Colorectum | AD |  |
| Colorectum | SER |  |
| Colorectum | MSS |  |
| Colorectum | MSI-H |  |
| Colorectum | FAP |  |
| ∗Top 15 enriched GO BP terms are showed in the bar plot of each disease state in each tissue. Each row represents a significant GO biological process which is colored according to the -log10(p.adjust). |
| Page: 1 2 3 4 5 6 7 8 9 |
| GO ID | Tissue | Disease Stage | Description | Gene Ratio | Bg Ratio | pvalue | p.adjust | Count |
| GO:004671829 | Skin | cSCC | viral entry into host cell | 56/4864 | 144/18723 | 4.46e-04 | 3.42e-03 | 56 |
| GO:00067672 | Skin | cSCC | water-soluble vitamin metabolic process | 24/4864 | 59/18723 | 9.59e-03 | 4.30e-02 | 24 |
| GO:0016032113 | Thyroid | PTC | viral process | 236/5968 | 415/18723 | 2.48e-26 | 8.24e-24 | 236 |
| GO:0019058113 | Thyroid | PTC | viral life cycle | 167/5968 | 317/18723 | 8.87e-15 | 5.89e-13 | 167 |
| GO:0044403113 | Thyroid | PTC | biological process involved in symbiotic interaction | 151/5968 | 290/18723 | 5.83e-13 | 2.85e-11 | 151 |
| GO:0051701113 | Thyroid | PTC | biological process involved in interaction with host | 109/5968 | 203/18723 | 8.64e-11 | 2.99e-09 | 109 |
| GO:0052126113 | Thyroid | PTC | movement in host environment | 91/5968 | 175/18723 | 2.41e-08 | 5.43e-07 | 91 |
| GO:0044409113 | Thyroid | PTC | entry into host | 72/5968 | 151/18723 | 3.48e-05 | 3.29e-04 | 72 |
| GO:0046718112 | Thyroid | PTC | viral entry into host cell | 68/5968 | 144/18723 | 8.26e-05 | 7.00e-04 | 68 |
| GO:001603234 | Thyroid | ATC | viral process | 241/6293 | 415/18723 | 5.50e-25 | 2.04e-22 | 241 |
| GO:001905835 | Thyroid | ATC | viral life cycle | 173/6293 | 317/18723 | 9.22e-15 | 5.50e-13 | 173 |
| GO:004440334 | Thyroid | ATC | biological process involved in symbiotic interaction | 153/6293 | 290/18723 | 1.12e-11 | 4.12e-10 | 153 |
| GO:005170134 | Thyroid | ATC | biological process involved in interaction with host | 112/6293 | 203/18723 | 1.93e-10 | 5.76e-09 | 112 |
| GO:005212633 | Thyroid | ATC | movement in host environment | 94/6293 | 175/18723 | 3.20e-08 | 6.00e-07 | 94 |
| GO:004440933 | Thyroid | ATC | entry into host | 76/6293 | 151/18723 | 1.54e-05 | 1.43e-04 | 76 |
| GO:004671833 | Thyroid | ATC | viral entry into host cell | 72/6293 | 144/18723 | 3.38e-05 | 2.80e-04 | 72 |
| Page: 1 2 3 4 5 |
| Pathway ID | Tissue | Disease Stage | Description | Gene Ratio | Bg Ratio | pvalue | p.adjust | qvalue | Count |
| Page: 1 |
Top |
Cell-cell communication analysis |
| Identification of potential cell-cell interactions between two cell types and their ligand-receptor pairs for different disease states |
| Ligand | Receptor | LRpair | Pathway | Tissue | Disease Stage |
| Page: 1 |
Top |
Single-cell gene regulatory network inference analysis |
| Find out the significant the regulons (TFs) and the target genes of each regulon across cell types for different disease states |
| TF | Cell Type | Tissue | Disease Stage | Target Gene | RSS | Regulon Activity |
| ∗The dot plots of a searched regulon are shown for all cell subpopulations in each disease state of each tissue based on the regulon specific score inferred using pySCENIC and by calculating the average expression. |
| Page: 1 |
Top |
Somatic mutation of malignant transformation related genes |
| Annotation of somatic variants for genes involved in malignant transformation |
| Hugo Symbol | Variant Class | Variant Classification | dbSNP RS | HGVSc | HGVSp | HGVSp Short | SWISSPROT | BIOTYPE | SIFT | PolyPhen | Tumor Sample Barcode | Tissue | Histology | Sex | Age | Stage | Therapy Types | Drugs | Outcome |
| SLC52A2 | SNV | Missense_Mutation | c.342N>G | p.Phe114Leu | p.F114L | Q9HAB3 | protein_coding | tolerated(0.31) | benign(0.003) | TCGA-C8-A274-01 | Breast | breast invasive carcinoma | Female | <65 | I/II | Hormone Therapy | tamoxiphen | SD | |
| SLC52A2 | SNV | Missense_Mutation | rs781873022 | c.1289A>G | p.Tyr430Cys | p.Y430C | Q9HAB3 | protein_coding | deleterious(0.01) | benign(0.253) | TCGA-E2-A1B4-01 | Breast | breast invasive carcinoma | Female | >=65 | III/IV | Hormone Therapy | arimidex | SD |
| SLC52A2 | insertion | Frame_Shift_Ins | novel | c.381_382insCAAGACTCCTGGGCTGCGG | p.Ser128GlnfsTer68 | p.S128Qfs*68 | Q9HAB3 | protein_coding | TCGA-A2-A0D1-01 | Breast | breast invasive carcinoma | Female | >=65 | I/II | Chemotherapy | taxotere | SD | ||
| SLC52A2 | deletion | Frame_Shift_Del | c.979delC | p.Leu327TrpfsTer27 | p.L327Wfs*27 | Q9HAB3 | protein_coding | TCGA-BH-A0C1-01 | Breast | breast invasive carcinoma | Female | <65 | III/IV | Chemotherapy | adriamycin | PD | |||
| SLC52A2 | deletion | Frame_Shift_Del | novel | c.884delC | p.Pro295LeufsTer59 | p.P295Lfs*59 | Q9HAB3 | protein_coding | TCGA-EW-A2FV-01 | Breast | breast invasive carcinoma | Female | <65 | III/IV | Chemotherapy | docetaxel | SD | ||
| SLC52A2 | SNV | Missense_Mutation | rs782253510 | c.1019N>A | p.Gly340Asp | p.G340D | Q9HAB3 | protein_coding | deleterious(0.01) | possibly_damaging(0.653) | TCGA-DS-A0VM-01 | Cervix | cervical & endocervical cancer | Female | <65 | I/II | Chemotherapy | cisplatin | PD |
| SLC52A2 | SNV | Missense_Mutation | c.1028N>T | p.Ser343Phe | p.S343F | Q9HAB3 | protein_coding | deleterious(0.03) | benign(0.033) | TCGA-3L-AA1B-01 | Colorectum | colon adenocarcinoma | Female | <65 | I/II | Unknown | Unknown | SD | |
| SLC52A2 | SNV | Missense_Mutation | c.307N>A | p.Ala103Thr | p.A103T | Q9HAB3 | protein_coding | tolerated(0.48) | benign(0.001) | TCGA-CK-4951-01 | Colorectum | colon adenocarcinoma | Female | >=65 | I/II | Unknown | Unknown | PD | |
| SLC52A2 | SNV | Missense_Mutation | rs144883729 | c.613N>A | p.Val205Ile | p.V205I | Q9HAB3 | protein_coding | tolerated(0.15) | benign(0.073) | TCGA-CK-4951-01 | Colorectum | colon adenocarcinoma | Female | >=65 | I/II | Unknown | Unknown | PD |
| SLC52A2 | SNV | Missense_Mutation | c.736N>A | p.Glu246Lys | p.E246K | Q9HAB3 | protein_coding | tolerated(0.2) | benign(0.081) | TCGA-CK-4951-01 | Colorectum | colon adenocarcinoma | Female | >=65 | I/II | Unknown | Unknown | PD |
| Page: 1 2 3 4 |
Top |
Related drugs of malignant transformation related genes |
| Identification of chemicals and drugs interact with genes involved in malignant transfromation |
| (DGIdb 4.0) |
| Entrez ID | Symbol | Category | Interaction Types | Drug Claim Name | Drug Name | PMIDs |
| Page: 1 |

Copyright 2023-Present -The University of Texas Health Science Center at Houston |