
|
|||||
|
 | |
| |
| |
| |
| |
| |
|
Gene: SEMA4A |
Gene summary for SEMA4A |
| Gene information | Species | Human | Gene symbol | SEMA4A | Gene ID | 64218 |
| Gene name | semaphorin 4A | |
| Gene Alias | CORD10 | |
| Cytomap | 1q22 | |
| Gene Type | protein-coding | GO ID | GO:0000902 | UniProtAcc | Q9H3S1 |
Top |
Malignant transformation analysis |
| Identification of the aberrant gene expression in precancerous and cancerous lesions by comparing the gene expression of stem-like cells in diseased tissues with normal stem cells |
| Entrez ID | Symbol | Replicates | Species | Organ | Tissue | Adj P-value | Log2FC | Malignancy |
| 64218 | SEMA4A | LZE4T | Human | Esophagus | ESCC | 6.31e-03 | 1.22e-01 | 0.0811 |
| 64218 | SEMA4A | LZE8T | Human | Esophagus | ESCC | 3.44e-07 | 2.26e-01 | 0.067 |
| 64218 | SEMA4A | LZE22T | Human | Esophagus | ESCC | 3.87e-03 | 2.92e-01 | 0.068 |
| 64218 | SEMA4A | LZE24T | Human | Esophagus | ESCC | 2.86e-10 | 2.02e-01 | 0.0596 |
| 64218 | SEMA4A | P1T-E | Human | Esophagus | ESCC | 1.84e-05 | 6.93e-01 | 0.0875 |
| 64218 | SEMA4A | P2T-E | Human | Esophagus | ESCC | 8.03e-33 | 5.74e-01 | 0.1177 |
| 64218 | SEMA4A | P4T-E | Human | Esophagus | ESCC | 2.70e-14 | 2.03e-01 | 0.1323 |
| 64218 | SEMA4A | P8T-E | Human | Esophagus | ESCC | 8.81e-17 | 3.87e-01 | 0.0889 |
| 64218 | SEMA4A | P9T-E | Human | Esophagus | ESCC | 1.10e-05 | 3.76e-01 | 0.1131 |
| 64218 | SEMA4A | P10T-E | Human | Esophagus | ESCC | 1.10e-34 | 9.05e-01 | 0.116 |
| 64218 | SEMA4A | P11T-E | Human | Esophagus | ESCC | 9.99e-05 | 3.19e-01 | 0.1426 |
| 64218 | SEMA4A | P12T-E | Human | Esophagus | ESCC | 2.20e-15 | 3.71e-01 | 0.1122 |
| 64218 | SEMA4A | P15T-E | Human | Esophagus | ESCC | 3.96e-21 | 6.20e-01 | 0.1149 |
| 64218 | SEMA4A | P16T-E | Human | Esophagus | ESCC | 3.42e-27 | 6.22e-01 | 0.1153 |
| 64218 | SEMA4A | P20T-E | Human | Esophagus | ESCC | 2.16e-07 | 3.83e-01 | 0.1124 |
| 64218 | SEMA4A | P21T-E | Human | Esophagus | ESCC | 7.36e-18 | 3.13e-01 | 0.1617 |
| 64218 | SEMA4A | P22T-E | Human | Esophagus | ESCC | 1.16e-15 | 2.62e-01 | 0.1236 |
| 64218 | SEMA4A | P23T-E | Human | Esophagus | ESCC | 1.33e-09 | 3.18e-01 | 0.108 |
| 64218 | SEMA4A | P24T-E | Human | Esophagus | ESCC | 2.06e-07 | 1.31e-01 | 0.1287 |
| 64218 | SEMA4A | P26T-E | Human | Esophagus | ESCC | 3.52e-37 | 6.70e-01 | 0.1276 |
| Page: 1 2 3 4 |
| Tissue | Expression Dynamics | Abbreviation |
| Esophagus | 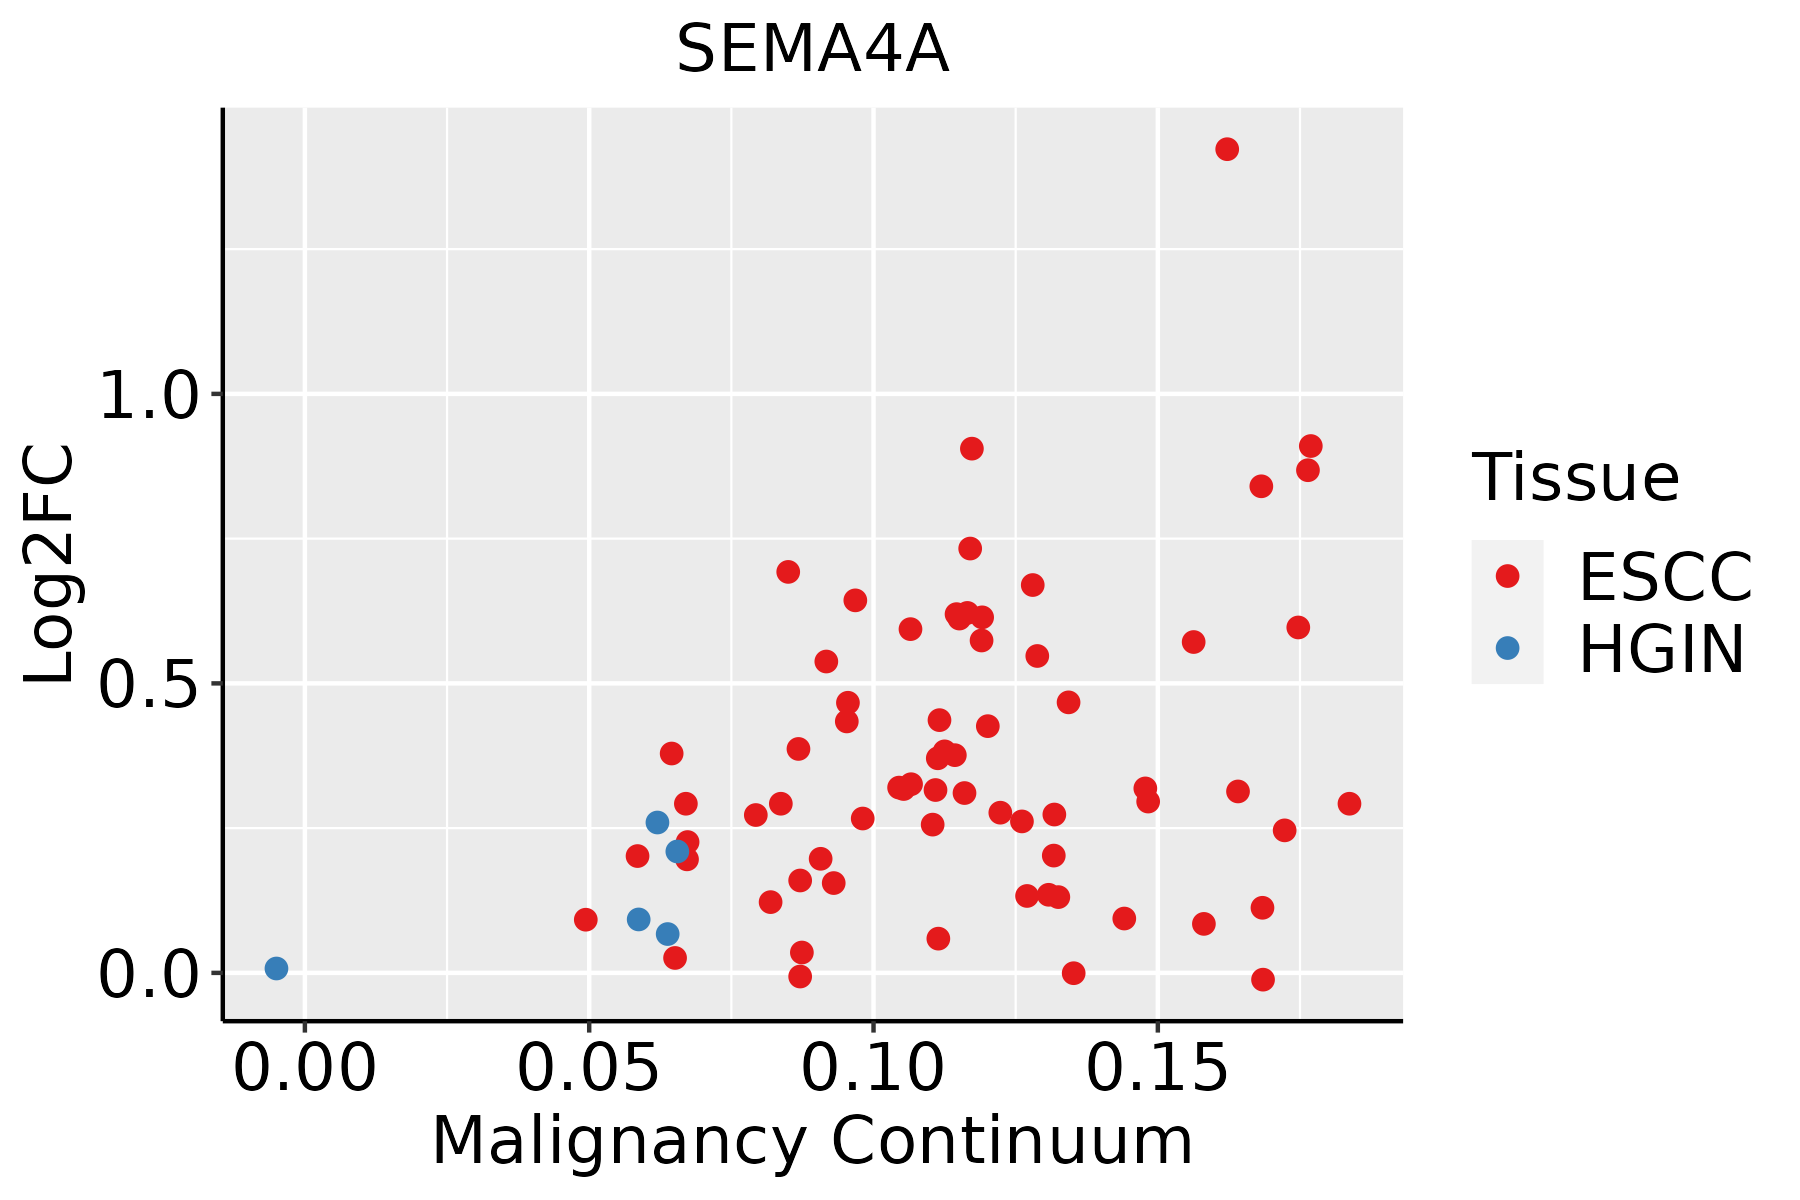 | ESCC: Esophageal squamous cell carcinoma |
| HGIN: High-grade intraepithelial neoplasias | ||
| LGIN: Low-grade intraepithelial neoplasias | ||
| Oral Cavity |  | EOLP: Erosive Oral lichen planus |
| LP: leukoplakia | ||
| NEOLP: Non-erosive oral lichen planus | ||
| OSCC: Oral squamous cell carcinoma | ||
| Thyroid |  | ATC: Anaplastic thyroid cancer |
| HT: Hashimoto's thyroiditis | ||
| PTC: Papillary thyroid cancer |
| ∗log2FC in expression of this searched gene in stem-like cells from each diseased tissue sample relative to stem-like cells in normal samples in each tissue plotted against the malignancy continuum. Samples are colored based on if they are from different disease stage. |
Top |
Malignant transformation related pathway analysis |
| Find out the enriched GO biological processes and KEGG pathways involved in transition from healthy to precancer to cancer |
| Tissue | Disease Stage | Enriched GO biological Processes |
| Colorectum | AD |  |
| Colorectum | SER |  |
| Colorectum | MSS |  |
| Colorectum | MSI-H |  |
| Colorectum | FAP |  |
| ∗Top 15 enriched GO BP terms are showed in the bar plot of each disease state in each tissue. Each row represents a significant GO biological process which is colored according to the -log10(p.adjust). |
| Page: 1 2 3 4 5 6 7 8 9 |
| GO ID | Tissue | Disease Stage | Description | Gene Ratio | Bg Ratio | pvalue | p.adjust | Count |
| GO:006056018 | Thyroid | PTC | developmental growth involved in morphogenesis | 105/5968 | 234/18723 | 1.94e-05 | 1.98e-04 | 105 |
| GO:00507708 | Thyroid | PTC | regulation of axonogenesis | 74/5968 | 154/18723 | 1.96e-05 | 2.00e-04 | 74 |
| GO:199013817 | Thyroid | PTC | neuron projection extension | 81/5968 | 172/18723 | 2.07e-05 | 2.08e-04 | 81 |
| GO:0010631111 | Thyroid | PTC | epithelial cell migration | 149/5968 | 357/18723 | 4.83e-05 | 4.33e-04 | 149 |
| GO:000836115 | Thyroid | PTC | regulation of cell size | 83/5968 | 181/18723 | 5.45e-05 | 4.84e-04 | 83 |
| GO:005196214 | Thyroid | PTC | positive regulation of nervous system development | 117/5968 | 272/18723 | 6.72e-05 | 5.89e-04 | 117 |
| GO:0090132111 | Thyroid | PTC | epithelium migration | 149/5968 | 360/18723 | 7.89e-05 | 6.74e-04 | 149 |
| GO:0090130111 | Thyroid | PTC | tissue migration | 150/5968 | 365/18723 | 1.13e-04 | 9.01e-04 | 150 |
| GO:0010632111 | Thyroid | PTC | regulation of epithelial cell migration | 123/5968 | 292/18723 | 1.33e-04 | 1.05e-03 | 123 |
| GO:00313459 | Thyroid | PTC | negative regulation of cell projection organization | 83/5968 | 186/18723 | 1.72e-04 | 1.32e-03 | 83 |
| GO:00519608 | Thyroid | PTC | regulation of nervous system development | 177/5968 | 443/18723 | 1.72e-04 | 1.32e-03 | 177 |
| GO:00305167 | Thyroid | PTC | regulation of axon extension | 47/5968 | 95/18723 | 2.60e-04 | 1.86e-03 | 47 |
| GO:00109778 | Thyroid | PTC | negative regulation of neuron projection development | 63/5968 | 137/18723 | 3.70e-04 | 2.50e-03 | 63 |
| GO:004592614 | Thyroid | PTC | negative regulation of growth | 105/5968 | 249/18723 | 3.76e-04 | 2.54e-03 | 105 |
| GO:190188817 | Thyroid | PTC | regulation of cell junction assembly | 88/5968 | 204/18723 | 4.50e-04 | 2.97e-03 | 88 |
| GO:00613873 | Thyroid | PTC | regulation of extent of cell growth | 52/5968 | 110/18723 | 5.20e-04 | 3.37e-03 | 52 |
| GO:004876215 | Thyroid | PTC | mesenchymal cell differentiation | 99/5968 | 236/18723 | 6.72e-04 | 4.22e-03 | 99 |
| GO:00303087 | Thyroid | PTC | negative regulation of cell growth | 80/5968 | 188/18723 | 1.28e-03 | 7.31e-03 | 80 |
| GO:004354219 | Thyroid | PTC | endothelial cell migration | 112/5968 | 279/18723 | 2.03e-03 | 1.09e-02 | 112 |
| GO:004886318 | Thyroid | PTC | stem cell differentiation | 85/5968 | 206/18723 | 2.71e-03 | 1.36e-02 | 85 |
| Page: 1 2 3 4 5 6 |
| Pathway ID | Tissue | Disease Stage | Description | Gene Ratio | Bg Ratio | pvalue | p.adjust | qvalue | Count |
| hsa0436016 | Esophagus | ESCC | Axon guidance | 108/4205 | 182/8465 | 5.13e-03 | 1.30e-02 | 6.67e-03 | 108 |
| hsa0436017 | Esophagus | ESCC | Axon guidance | 108/4205 | 182/8465 | 5.13e-03 | 1.30e-02 | 6.67e-03 | 108 |
| hsa0436014 | Oral cavity | OSCC | Axon guidance | 97/3704 | 182/8465 | 5.59e-03 | 1.33e-02 | 6.76e-03 | 97 |
| hsa0436015 | Oral cavity | OSCC | Axon guidance | 97/3704 | 182/8465 | 5.59e-03 | 1.33e-02 | 6.76e-03 | 97 |
| Page: 1 |
Top |
Cell-cell communication analysis |
| Identification of potential cell-cell interactions between two cell types and their ligand-receptor pairs for different disease states |
| Ligand | Receptor | LRpair | Pathway | Tissue | Disease Stage |
| SEMA4A | NRP1_PLXNA4 | SEMA4A_NRP1_PLXNA4 | SEMA4 | Breast | DCIS |
| SEMA4A | PLXNB2 | SEMA4A_PLXNB2 | SEMA4 | Breast | DCIS |
| SEMA4A | PLXNB1 | SEMA4A_PLXNB1 | SEMA4 | Cervix | ADJ |
| SEMA4A | PLXNB2 | SEMA4A_PLXNB2 | SEMA4 | Cervix | ADJ |
| SEMA4A | NRP1_PLXNA2 | SEMA4A_NRP1_PLXNA2 | SEMA4 | Cervix | CC |
| SEMA4A | PLXNB1 | SEMA4A_PLXNB1 | SEMA4 | Cervix | CC |
| SEMA4A | PLXNB2 | SEMA4A_PLXNB2 | SEMA4 | Cervix | CC |
| SEMA4A | NRP1_PLXNA2 | SEMA4A_NRP1_PLXNA2 | SEMA4 | CRC | AD |
| SEMA4A | PLXNB1 | SEMA4A_PLXNB1 | SEMA4 | CRC | AD |
| SEMA4A | NRP1_PLXNA2 | SEMA4A_NRP1_PLXNA2 | SEMA4 | CRC | ADJ |
| SEMA4A | NRP1_PLXNA4 | SEMA4A_NRP1_PLXNA4 | SEMA4 | CRC | ADJ |
| SEMA4A | PLXNB2 | SEMA4A_PLXNB2 | SEMA4 | CRC | ADJ |
| SEMA4A | NRP1_PLXNA1 | SEMA4A_NRP1_PLXNA1 | SEMA4 | CRC | MSI-H |
| SEMA4A | NRP1_PLXNA2 | SEMA4A_NRP1_PLXNA2 | SEMA4 | CRC | MSI-H |
| SEMA4A | PLXNB1 | SEMA4A_PLXNB1 | SEMA4 | CRC | MSI-H |
| SEMA4A | PLXNB2 | SEMA4A_PLXNB2 | SEMA4 | CRC | MSI-H |
| SEMA4A | NRP1_PLXNA2 | SEMA4A_NRP1_PLXNA2 | SEMA4 | CRC | SER |
| SEMA4A | PLXNB1 | SEMA4A_PLXNB1 | SEMA4 | CRC | SER |
| SEMA4A | PLXNB2 | SEMA4A_PLXNB2 | SEMA4 | CRC | SER |
| SEMA4A | NRP1_PLXNA2 | SEMA4A_NRP1_PLXNA2 | SEMA4 | Endometrium | ADJ |
| Page: 1 2 3 4 |
Top |
Single-cell gene regulatory network inference analysis |
| Find out the significant the regulons (TFs) and the target genes of each regulon across cell types for different disease states |
| TF | Cell Type | Tissue | Disease Stage | Target Gene | RSS | Regulon Activity |
| ∗The dot plots of a searched regulon are shown for all cell subpopulations in each disease state of each tissue based on the regulon specific score inferred using pySCENIC and by calculating the average expression. |
| Page: 1 |
Top |
Somatic mutation of malignant transformation related genes |
| Annotation of somatic variants for genes involved in malignant transformation |
| Hugo Symbol | Variant Class | Variant Classification | dbSNP RS | HGVSc | HGVSp | HGVSp Short | SWISSPROT | BIOTYPE | SIFT | PolyPhen | Tumor Sample Barcode | Tissue | Histology | Sex | Age | Stage | Therapy Types | Drugs | Outcome |
| SEMA4A | SNV | Missense_Mutation | novel | c.2215C>G | p.Pro739Ala | p.P739A | Q9H3S1 | protein_coding | tolerated(0.19) | benign(0.009) | TCGA-A2-A3XT-01 | Breast | breast invasive carcinoma | Female | <65 | I/II | Chemotherapy | cyclophosphamide | PR |
| SEMA4A | SNV | Missense_Mutation | c.112N>T | p.Pro38Ser | p.P38S | Q9H3S1 | protein_coding | tolerated(0.09) | probably_damaging(0.992) | TCGA-AN-A0AT-01 | Breast | breast invasive carcinoma | Female | <65 | I/II | Unknown | Unknown | SD | |
| SEMA4A | SNV | Missense_Mutation | c.2099T>A | p.Ile700Asn | p.I700N | Q9H3S1 | protein_coding | deleterious(0.01) | benign(0.118) | TCGA-AO-A12F-01 | Breast | breast invasive carcinoma | Female | <65 | I/II | Chemotherapy | paclitaxel | SD | |
| SEMA4A | SNV | Missense_Mutation | c.1294N>G | p.Leu432Val | p.L432V | Q9H3S1 | protein_coding | tolerated(0.44) | benign(0.007) | TCGA-C8-A274-01 | Breast | breast invasive carcinoma | Female | <65 | I/II | Hormone Therapy | tamoxiphen | SD | |
| SEMA4A | SNV | Missense_Mutation | rs370407549 | c.103G>A | p.Gly35Arg | p.G35R | Q9H3S1 | protein_coding | tolerated(0.07) | benign(0.019) | TCGA-EW-A6SB-01 | Breast | breast invasive carcinoma | Female | <65 | I/II | Unknown | Unknown | SD |
| SEMA4A | SNV | Missense_Mutation | novel | c.1742N>G | p.Pro581Arg | p.P581R | Q9H3S1 | protein_coding | tolerated(0.22) | benign(0.334) | TCGA-V7-A7HQ-01 | Breast | breast invasive carcinoma | Female | >=65 | III/IV | Hormone Therapy | letrozole | CR |
| SEMA4A | insertion | Frame_Shift_Ins | novel | c.775_776insCTACCCAC | p.Arg259ThrfsTer32 | p.R259Tfs*32 | Q9H3S1 | protein_coding | TCGA-BH-A0BM-01 | Breast | breast invasive carcinoma | Female | <65 | I/II | Chemotherapy | adriamycin | SD | ||
| SEMA4A | insertion | Frame_Shift_Ins | novel | c.776_777insACTTTCCTCTGTA | p.His261SerfsTer11 | p.H261Sfs*11 | Q9H3S1 | protein_coding | TCGA-BH-A0BM-01 | Breast | breast invasive carcinoma | Female | <65 | I/II | Chemotherapy | adriamycin | SD | ||
| SEMA4A | SNV | Missense_Mutation | novel | c.226C>T | p.Leu76Phe | p.L76F | Q9H3S1 | protein_coding | deleterious(0) | probably_damaging(0.999) | TCGA-C5-A7UI-01 | Cervix | cervical & endocervical cancer | Female | <65 | I/II | Unknown | Unknown | SD |
| SEMA4A | SNV | Missense_Mutation | c.960N>G | p.Ile320Met | p.I320M | Q9H3S1 | protein_coding | deleterious(0.03) | possibly_damaging(0.56) | TCGA-DR-A0ZM-01 | Cervix | cervical & endocervical cancer | Female | <65 | III/IV | Unspecific | Cisplatin | SD |
| Page: 1 2 3 4 5 6 7 8 9 |
Top |
Related drugs of malignant transformation related genes |
| Identification of chemicals and drugs interact with genes involved in malignant transfromation |
| (DGIdb 4.0) |
| Entrez ID | Symbol | Category | Interaction Types | Drug Claim Name | Drug Name | PMIDs |
| Page: 1 |

Copyright 2023-Present -The University of Texas Health Science Center at Houston |