
|
|||||
|
 | |
| |
| |
| |
| |
| |
|
Gene: SCIN |
Gene summary for SCIN |
| Gene information | Species | Human | Gene symbol | SCIN | Gene ID | 85477 |
| Gene name | scinderin | |
| Gene Alias | SCIN | |
| Cytomap | 7p21.3 | |
| Gene Type | protein-coding | GO ID | GO:0001501 | UniProtAcc | Q9Y6U3 |
Top |
Malignant transformation analysis |
| Identification of the aberrant gene expression in precancerous and cancerous lesions by comparing the gene expression of stem-like cells in diseased tissues with normal stem cells |
| Entrez ID | Symbol | Replicates | Species | Organ | Tissue | Adj P-value | Log2FC | Malignancy |
| 85477 | SCIN | HTA11_2487_2000001011 | Human | Colorectum | SER | 2.69e-14 | 4.79e-01 | -0.1808 |
| 85477 | SCIN | HTA11_78_2000001011 | Human | Colorectum | AD | 1.44e-06 | 3.33e-01 | -0.1088 |
| 85477 | SCIN | HTA11_347_2000001011 | Human | Colorectum | AD | 2.13e-04 | 2.50e-01 | -0.1954 |
| 85477 | SCIN | HTA11_411_2000001011 | Human | Colorectum | SER | 8.64e-09 | 9.20e-01 | -0.2602 |
| 85477 | SCIN | HTA11_2112_2000001011 | Human | Colorectum | SER | 3.31e-02 | 4.31e-01 | -0.2196 |
| 85477 | SCIN | HTA11_3361_2000001011 | Human | Colorectum | AD | 9.56e-03 | 2.57e-01 | -0.1207 |
| 85477 | SCIN | HTA11_83_2000001011 | Human | Colorectum | SER | 4.01e-02 | 2.44e-01 | -0.1526 |
| 85477 | SCIN | HTA11_696_2000001011 | Human | Colorectum | AD | 1.04e-04 | 3.29e-01 | -0.1464 |
| Page: 1 |
| Tissue | Expression Dynamics | Abbreviation |
| Colorectum (GSE201348) |  | FAP: Familial adenomatous polyposis |
| CRC: Colorectal cancer | ||
| Colorectum (HTA11) | 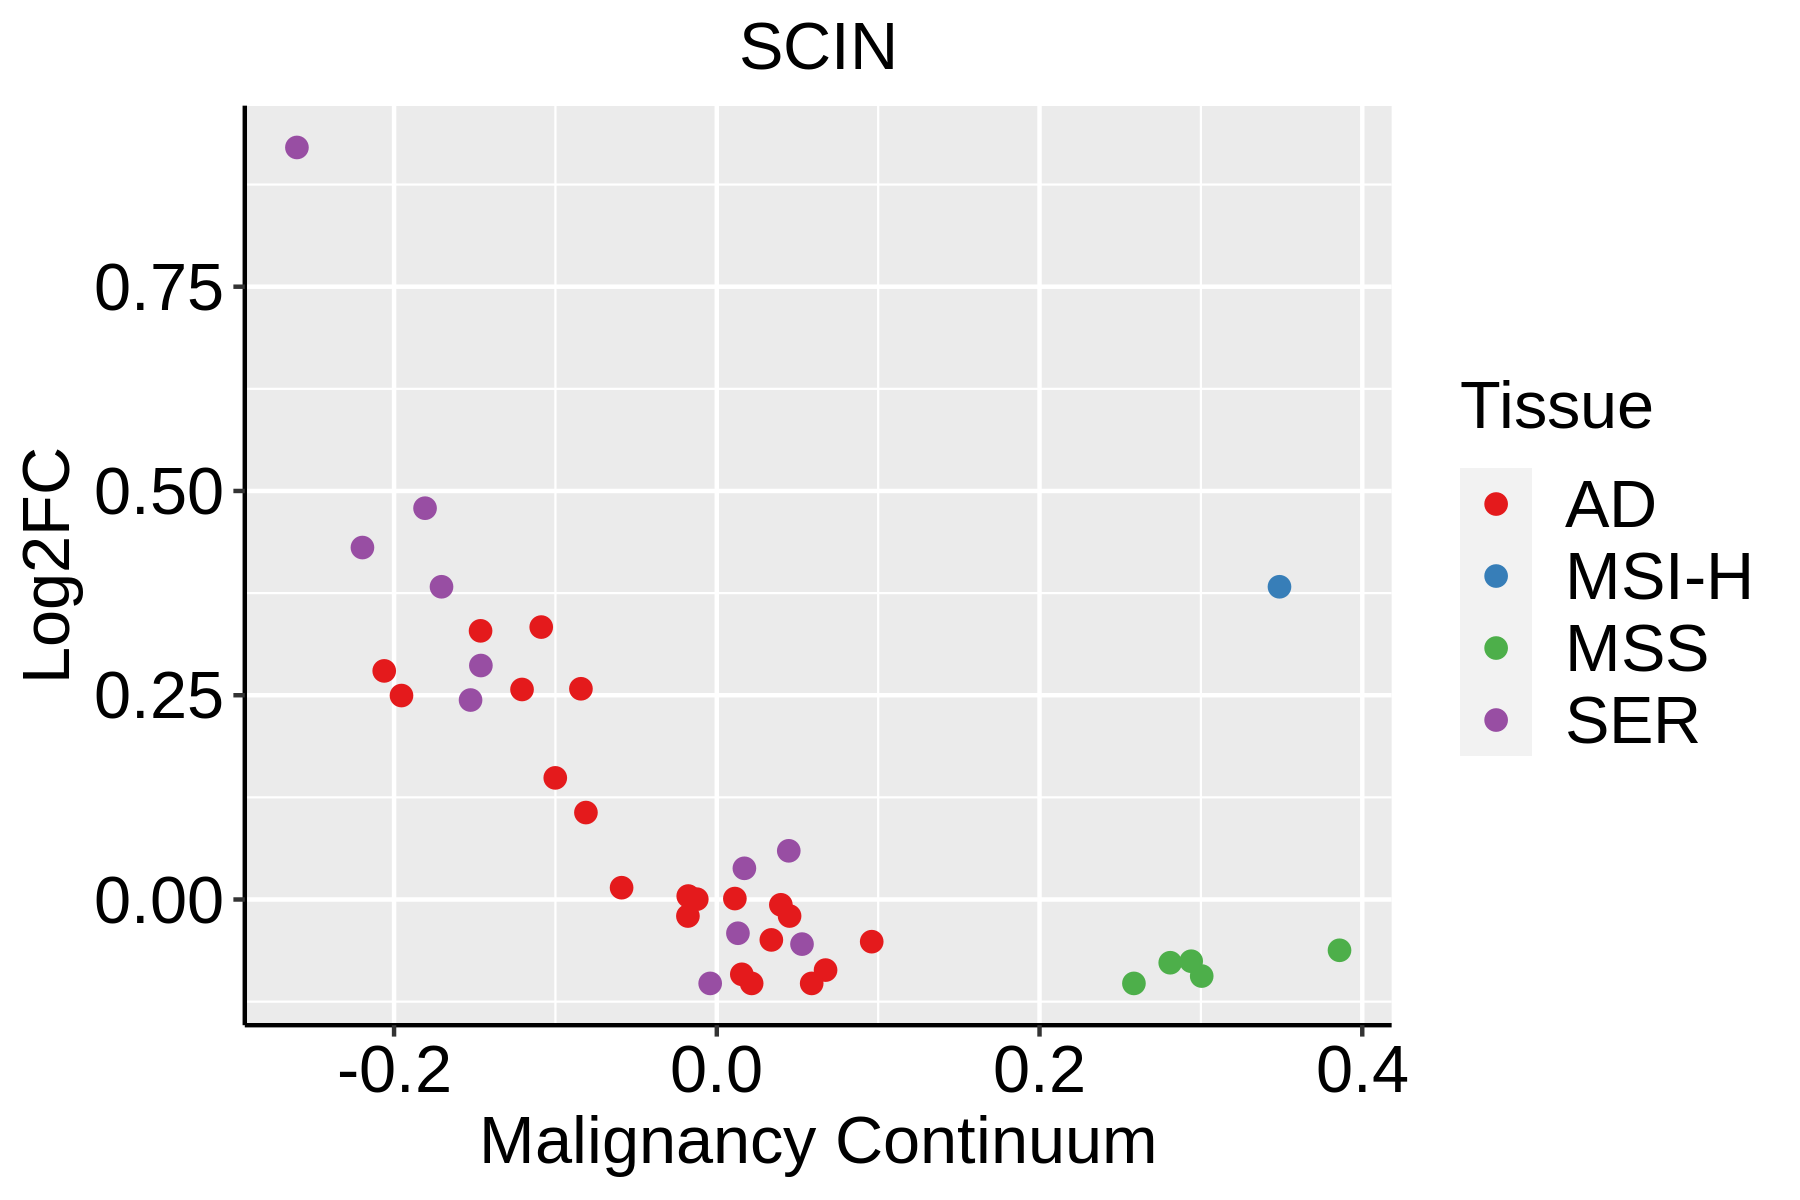 | AD: Adenomas |
| SER: Sessile serrated lesions | ||
| MSI-H: Microsatellite-high colorectal cancer | ||
| MSS: Microsatellite stable colorectal cancer |
| ∗log2FC in expression of this searched gene in stem-like cells from each diseased tissue sample relative to stem-like cells in normal samples in each tissue plotted against the malignancy continuum. Samples are colored based on if they are from different disease stage. |
Top |
Malignant transformation related pathway analysis |
| Find out the enriched GO biological processes and KEGG pathways involved in transition from healthy to precancer to cancer |
| Tissue | Disease Stage | Enriched GO biological Processes |
| Colorectum | AD |  |
| Colorectum | SER |  |
| Colorectum | MSS |  |
| Colorectum | MSI-H |  |
| Colorectum | FAP |  |
| ∗Top 15 enriched GO BP terms are showed in the bar plot of each disease state in each tissue. Each row represents a significant GO biological process which is colored according to the -log10(p.adjust). |
| Page: 1 2 3 4 5 6 7 8 9 |
| GO ID | Tissue | Disease Stage | Description | Gene Ratio | Bg Ratio | pvalue | p.adjust | Count |
| GO:00308341 | Colorectum | SER | regulation of actin filament depolymerization | 21/2897 | 54/18723 | 2.57e-05 | 7.07e-04 | 21 |
| GO:00510161 | Colorectum | SER | barbed-end actin filament capping | 13/2897 | 26/18723 | 4.02e-05 | 1.02e-03 | 13 |
| GO:00516931 | Colorectum | SER | actin filament capping | 16/2897 | 41/18723 | 2.21e-04 | 3.89e-03 | 16 |
| GO:00308351 | Colorectum | SER | negative regulation of actin filament depolymerization | 17/2897 | 45/18723 | 2.25e-04 | 3.91e-03 | 17 |
| GO:00511251 | Colorectum | SER | regulation of actin nucleation | 13/2897 | 30/18723 | 2.52e-04 | 4.23e-03 | 13 |
| GO:00436241 | Colorectum | SER | cellular protein complex disassembly | 37/2897 | 136/18723 | 3.08e-04 | 5.00e-03 | 37 |
| GO:00325071 | Colorectum | SER | maintenance of protein location in cell | 21/2897 | 65/18723 | 5.39e-04 | 7.57e-03 | 21 |
| GO:00512611 | Colorectum | SER | protein depolymerization | 31/2897 | 114/18723 | 9.18e-04 | 1.11e-02 | 31 |
| GO:00451851 | Colorectum | SER | maintenance of protein location | 26/2897 | 94/18723 | 1.76e-03 | 1.81e-02 | 26 |
| GO:00068871 | Colorectum | SER | exocytosis | 75/2897 | 352/18723 | 2.05e-03 | 2.03e-02 | 75 |
| GO:00300991 | Colorectum | SER | myeloid cell differentiation | 80/2897 | 381/18723 | 2.28e-03 | 2.18e-02 | 80 |
| GO:19018791 | Colorectum | SER | regulation of protein depolymerization | 24/2897 | 87/18723 | 2.69e-03 | 2.44e-02 | 24 |
| GO:00432441 | Colorectum | SER | regulation of protein-containing complex disassembly | 30/2897 | 121/18723 | 5.03e-03 | 3.88e-02 | 30 |
| GO:19018801 | Colorectum | SER | negative regulation of protein depolymerization | 20/2897 | 72/18723 | 5.36e-03 | 4.03e-02 | 20 |
| GO:00510471 | Colorectum | SER | positive regulation of secretion | 65/2897 | 310/18723 | 5.71e-03 | 4.19e-02 | 65 |
| GO:00516511 | Colorectum | SER | maintenance of location in cell | 47/2897 | 214/18723 | 7.20e-03 | 4.99e-02 | 47 |
| Page: 1 2 3 4 5 |
| Pathway ID | Tissue | Disease Stage | Description | Gene Ratio | Bg Ratio | pvalue | p.adjust | qvalue | Count |
| hsa04666 | Colorectum | AD | Fc gamma R-mediated phagocytosis | 46/2092 | 97/8465 | 9.10e-07 | 1.22e-05 | 7.77e-06 | 46 |
| hsa04810 | Colorectum | AD | Regulation of actin cytoskeleton | 75/2092 | 229/8465 | 3.36e-03 | 1.76e-02 | 1.12e-02 | 75 |
| hsa046661 | Colorectum | AD | Fc gamma R-mediated phagocytosis | 46/2092 | 97/8465 | 9.10e-07 | 1.22e-05 | 7.77e-06 | 46 |
| hsa048101 | Colorectum | AD | Regulation of actin cytoskeleton | 75/2092 | 229/8465 | 3.36e-03 | 1.76e-02 | 1.12e-02 | 75 |
| hsa046662 | Colorectum | SER | Fc gamma R-mediated phagocytosis | 39/1580 | 97/8465 | 5.84e-07 | 9.70e-06 | 7.04e-06 | 39 |
| hsa048102 | Colorectum | SER | Regulation of actin cytoskeleton | 60/1580 | 229/8465 | 2.74e-03 | 2.02e-02 | 1.47e-02 | 60 |
| hsa046663 | Colorectum | SER | Fc gamma R-mediated phagocytosis | 39/1580 | 97/8465 | 5.84e-07 | 9.70e-06 | 7.04e-06 | 39 |
| hsa048103 | Colorectum | SER | Regulation of actin cytoskeleton | 60/1580 | 229/8465 | 2.74e-03 | 2.02e-02 | 1.47e-02 | 60 |
| Page: 1 |
Top |
Cell-cell communication analysis |
| Identification of potential cell-cell interactions between two cell types and their ligand-receptor pairs for different disease states |
| Ligand | Receptor | LRpair | Pathway | Tissue | Disease Stage |
| Page: 1 |
Top |
Single-cell gene regulatory network inference analysis |
| Find out the significant the regulons (TFs) and the target genes of each regulon across cell types for different disease states |
| TF | Cell Type | Tissue | Disease Stage | Target Gene | RSS | Regulon Activity |
| ∗The dot plots of a searched regulon are shown for all cell subpopulations in each disease state of each tissue based on the regulon specific score inferred using pySCENIC and by calculating the average expression. |
| Page: 1 |
Top |
Somatic mutation of malignant transformation related genes |
| Annotation of somatic variants for genes involved in malignant transformation |
| Hugo Symbol | Variant Class | Variant Classification | dbSNP RS | HGVSc | HGVSp | HGVSp Short | SWISSPROT | BIOTYPE | SIFT | PolyPhen | Tumor Sample Barcode | Tissue | Histology | Sex | Age | Stage | Therapy Types | Drugs | Outcome |
| SCIN | SNV | Missense_Mutation | novel | c.1045G>T | p.Asp349Tyr | p.D349Y | Q9Y6U3 | protein_coding | deleterious(0.02) | probably_damaging(0.939) | TCGA-AN-A046-01 | Breast | breast invasive carcinoma | Female | >=65 | I/II | Unknown | Unknown | SD |
| SCIN | SNV | Missense_Mutation | novel | c.810N>A | p.Asn270Lys | p.N270K | Q9Y6U3 | protein_coding | deleterious(0.03) | probably_damaging(0.997) | TCGA-AO-A1KT-01 | Breast | breast invasive carcinoma | Female | >=65 | I/II | Chemotherapy | fluorouracil | SD |
| SCIN | SNV | Missense_Mutation | rs78038322 | c.631N>A | p.Val211Met | p.V211M | Q9Y6U3 | protein_coding | deleterious(0.01) | benign(0.149) | TCGA-AR-A0U0-01 | Breast | breast invasive carcinoma | Female | >=65 | I/II | Unknown | Unknown | SD |
| SCIN | SNV | Missense_Mutation | c.929N>A | p.Met310Lys | p.M310K | Q9Y6U3 | protein_coding | deleterious(0.01) | benign(0.168) | TCGA-B6-A0RE-01 | Breast | breast invasive carcinoma | Female | <65 | I/II | Unknown | Unknown | SD | |
| SCIN | SNV | Missense_Mutation | c.2018C>T | p.Ser673Phe | p.S673F | Q9Y6U3 | protein_coding | tolerated(0.28) | probably_damaging(0.997) | TCGA-BH-A0HF-01 | Breast | breast invasive carcinoma | Female | >=65 | I/II | Hormone Therapy | arimidex | SD | |
| SCIN | SNV | Missense_Mutation | c.130N>A | p.Asp44Asn | p.D44N | Q9Y6U3 | protein_coding | deleterious(0) | probably_damaging(1) | TCGA-BH-A209-01 | Breast | breast invasive carcinoma | Female | >=65 | I/II | Unknown | Unknown | SD | |
| SCIN | insertion | Frame_Shift_Ins | novel | c.1305_1306insCGTTCAATGTTGGCACGAAGGGCACACTCCTCTGCCTGGAAGTCCC | p.Ile436ArgfsTer29 | p.I436Rfs*29 | Q9Y6U3 | protein_coding | TCGA-A2-A0D0-01 | Breast | breast invasive carcinoma | Female | <65 | I/II | Chemotherapy | cytoxan | SD | ||
| SCIN | insertion | In_Frame_Ins | novel | c.1973_1974insATTTTA | p.Ile658_Gly659insPheTyr | p.I658_G659insFY | Q9Y6U3 | protein_coding | TCGA-AC-A3QQ-01 | Breast | breast invasive carcinoma | Female | <65 | I/II | Unknown | Unknown | SD | ||
| SCIN | insertion | Nonsense_Mutation | novel | c.629_630insTGAGGTATATACATAATTGTTACACTTCATTCTG | p.Val211GlufsTer5 | p.V211Efs*5 | Q9Y6U3 | protein_coding | TCGA-AR-A0U0-01 | Breast | breast invasive carcinoma | Female | >=65 | I/II | Unknown | Unknown | SD | ||
| SCIN | insertion | Frame_Shift_Ins | novel | c.1973_1974insATTTTATGTTTACATGGTAC | p.Gly659PhefsTer20 | p.G659Ffs*20 | Q9Y6U3 | protein_coding | TCGA-AR-A0U0-01 | Breast | breast invasive carcinoma | Female | >=65 | I/II | Unknown | Unknown | SD |
| Page: 1 2 3 4 5 6 7 8 |
Top |
Related drugs of malignant transformation related genes |
| Identification of chemicals and drugs interact with genes involved in malignant transfromation |
| (DGIdb 4.0) |
| Entrez ID | Symbol | Category | Interaction Types | Drug Claim Name | Drug Name | PMIDs |
| Page: 1 |

Copyright 2023-Present -The University of Texas Health Science Center at Houston |