
|
|||||
|
 | |
| |
| |
| |
| |
| |
|
Gene: RRS1 |
Gene summary for RRS1 |
| Gene information | Species | Human | Gene symbol | RRS1 | Gene ID | 23212 |
| Gene name | ribosome biogenesis regulator 1 homolog | |
| Gene Alias | RRS1 | |
| Cytomap | 8q13.1 | |
| Gene Type | protein-coding | GO ID | GO:0000027 | UniProtAcc | Q15050 |
Top |
Malignant transformation analysis |
| Identification of the aberrant gene expression in precancerous and cancerous lesions by comparing the gene expression of stem-like cells in diseased tissues with normal stem cells |
| Entrez ID | Symbol | Replicates | Species | Organ | Tissue | Adj P-value | Log2FC | Malignancy |
| 23212 | RRS1 | LZE2T | Human | Esophagus | ESCC | 1.14e-05 | 4.11e-01 | 0.082 |
| 23212 | RRS1 | LZE4T | Human | Esophagus | ESCC | 4.09e-07 | 1.85e-01 | 0.0811 |
| 23212 | RRS1 | LZE7T | Human | Esophagus | ESCC | 2.65e-04 | 4.48e-02 | 0.0667 |
| 23212 | RRS1 | LZE8T | Human | Esophagus | ESCC | 5.70e-05 | 3.90e-02 | 0.067 |
| 23212 | RRS1 | LZE24T | Human | Esophagus | ESCC | 1.37e-03 | 1.54e-01 | 0.0596 |
| 23212 | RRS1 | P2T-E | Human | Esophagus | ESCC | 1.64e-12 | 2.29e-01 | 0.1177 |
| 23212 | RRS1 | P4T-E | Human | Esophagus | ESCC | 8.78e-10 | 4.44e-01 | 0.1323 |
| 23212 | RRS1 | P5T-E | Human | Esophagus | ESCC | 7.15e-16 | 3.27e-01 | 0.1327 |
| 23212 | RRS1 | P8T-E | Human | Esophagus | ESCC | 3.95e-09 | 2.87e-02 | 0.0889 |
| 23212 | RRS1 | P9T-E | Human | Esophagus | ESCC | 3.41e-10 | 2.79e-01 | 0.1131 |
| 23212 | RRS1 | P10T-E | Human | Esophagus | ESCC | 2.81e-10 | 2.00e-01 | 0.116 |
| 23212 | RRS1 | P11T-E | Human | Esophagus | ESCC | 2.67e-03 | 5.34e-01 | 0.1426 |
| 23212 | RRS1 | P12T-E | Human | Esophagus | ESCC | 1.15e-16 | 2.89e-01 | 0.1122 |
| 23212 | RRS1 | P15T-E | Human | Esophagus | ESCC | 4.52e-16 | 4.66e-01 | 0.1149 |
| 23212 | RRS1 | P16T-E | Human | Esophagus | ESCC | 1.48e-16 | 5.65e-01 | 0.1153 |
| 23212 | RRS1 | P17T-E | Human | Esophagus | ESCC | 7.37e-03 | 3.59e-01 | 0.1278 |
| 23212 | RRS1 | P20T-E | Human | Esophagus | ESCC | 1.37e-15 | 3.72e-01 | 0.1124 |
| 23212 | RRS1 | P21T-E | Human | Esophagus | ESCC | 3.70e-22 | 6.37e-01 | 0.1617 |
| 23212 | RRS1 | P22T-E | Human | Esophagus | ESCC | 7.54e-25 | 4.21e-01 | 0.1236 |
| 23212 | RRS1 | P23T-E | Human | Esophagus | ESCC | 9.72e-27 | 7.82e-01 | 0.108 |
| Page: 1 2 3 4 5 |
| Tissue | Expression Dynamics | Abbreviation |
| Esophagus | 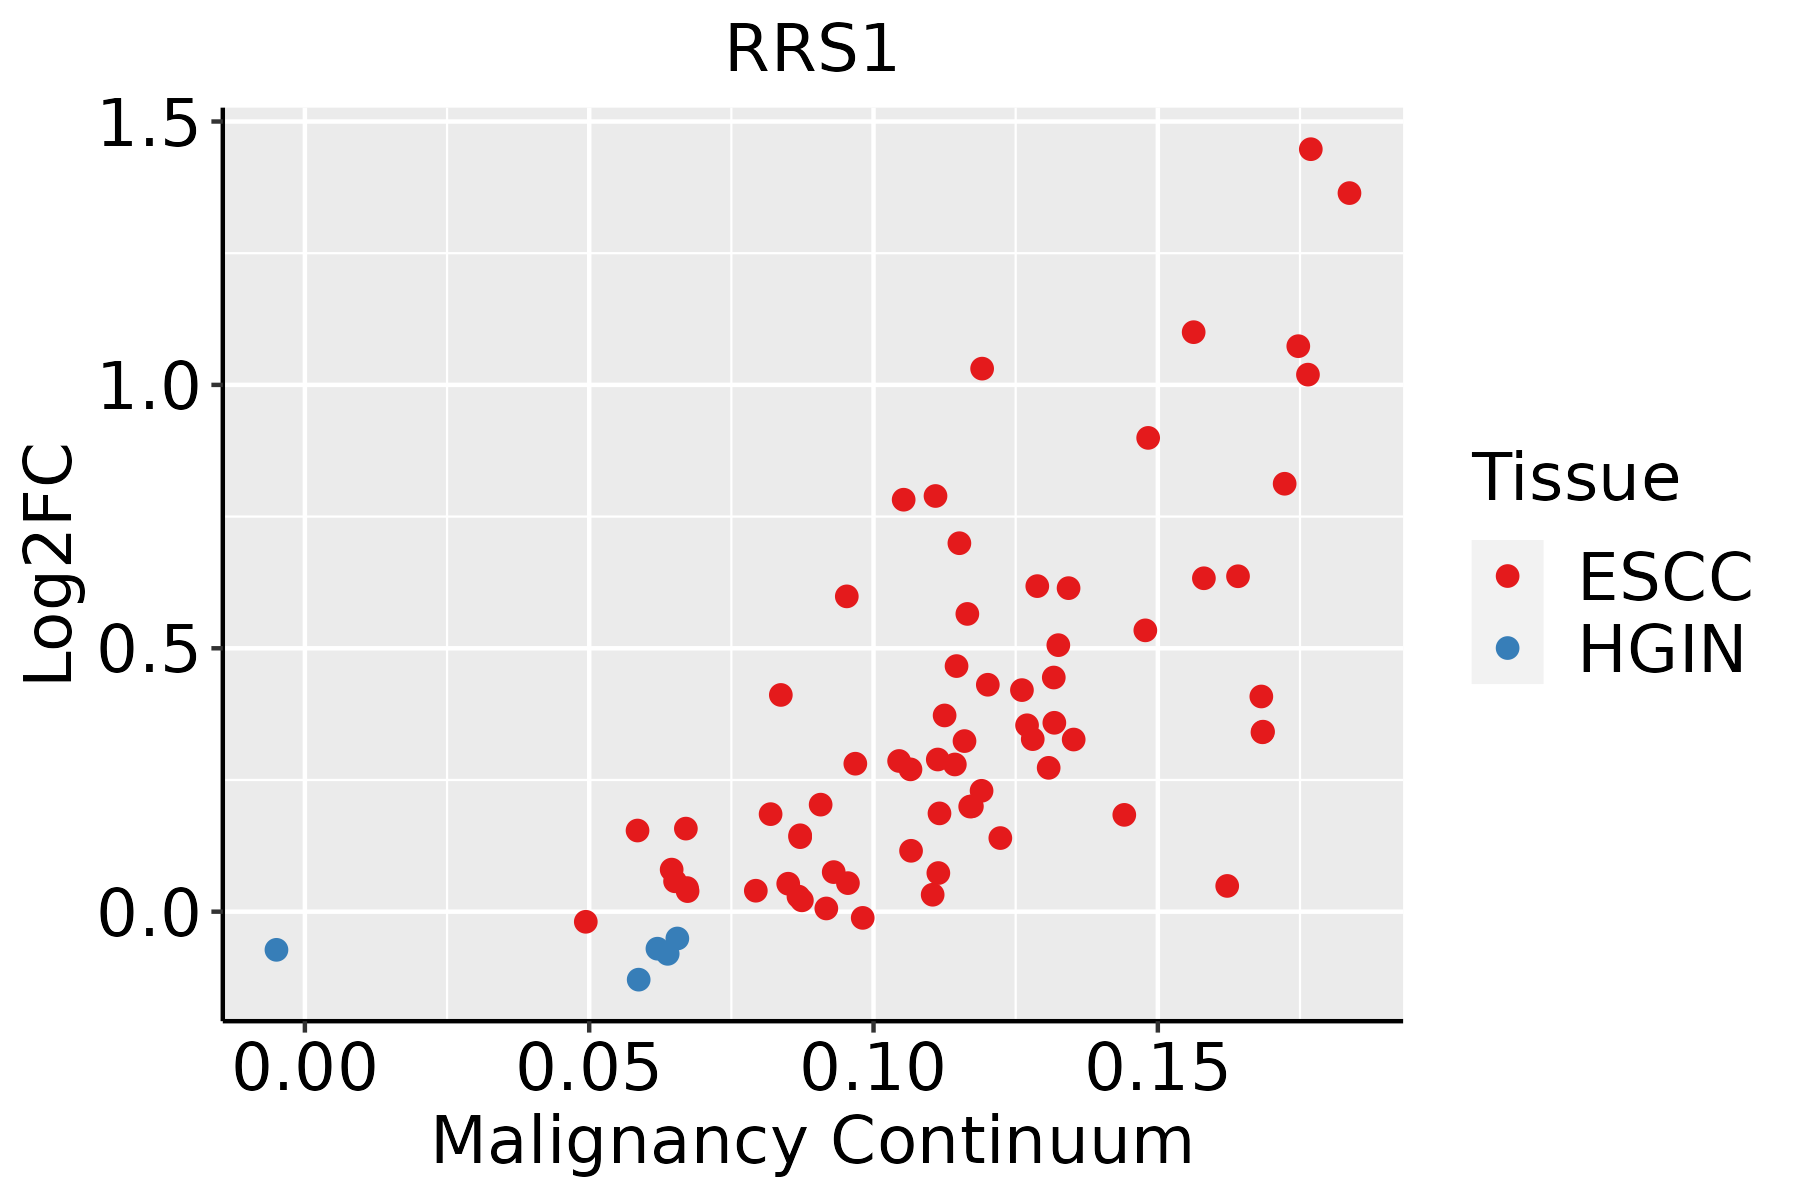 | ESCC: Esophageal squamous cell carcinoma |
| HGIN: High-grade intraepithelial neoplasias | ||
| LGIN: Low-grade intraepithelial neoplasias | ||
| Liver | 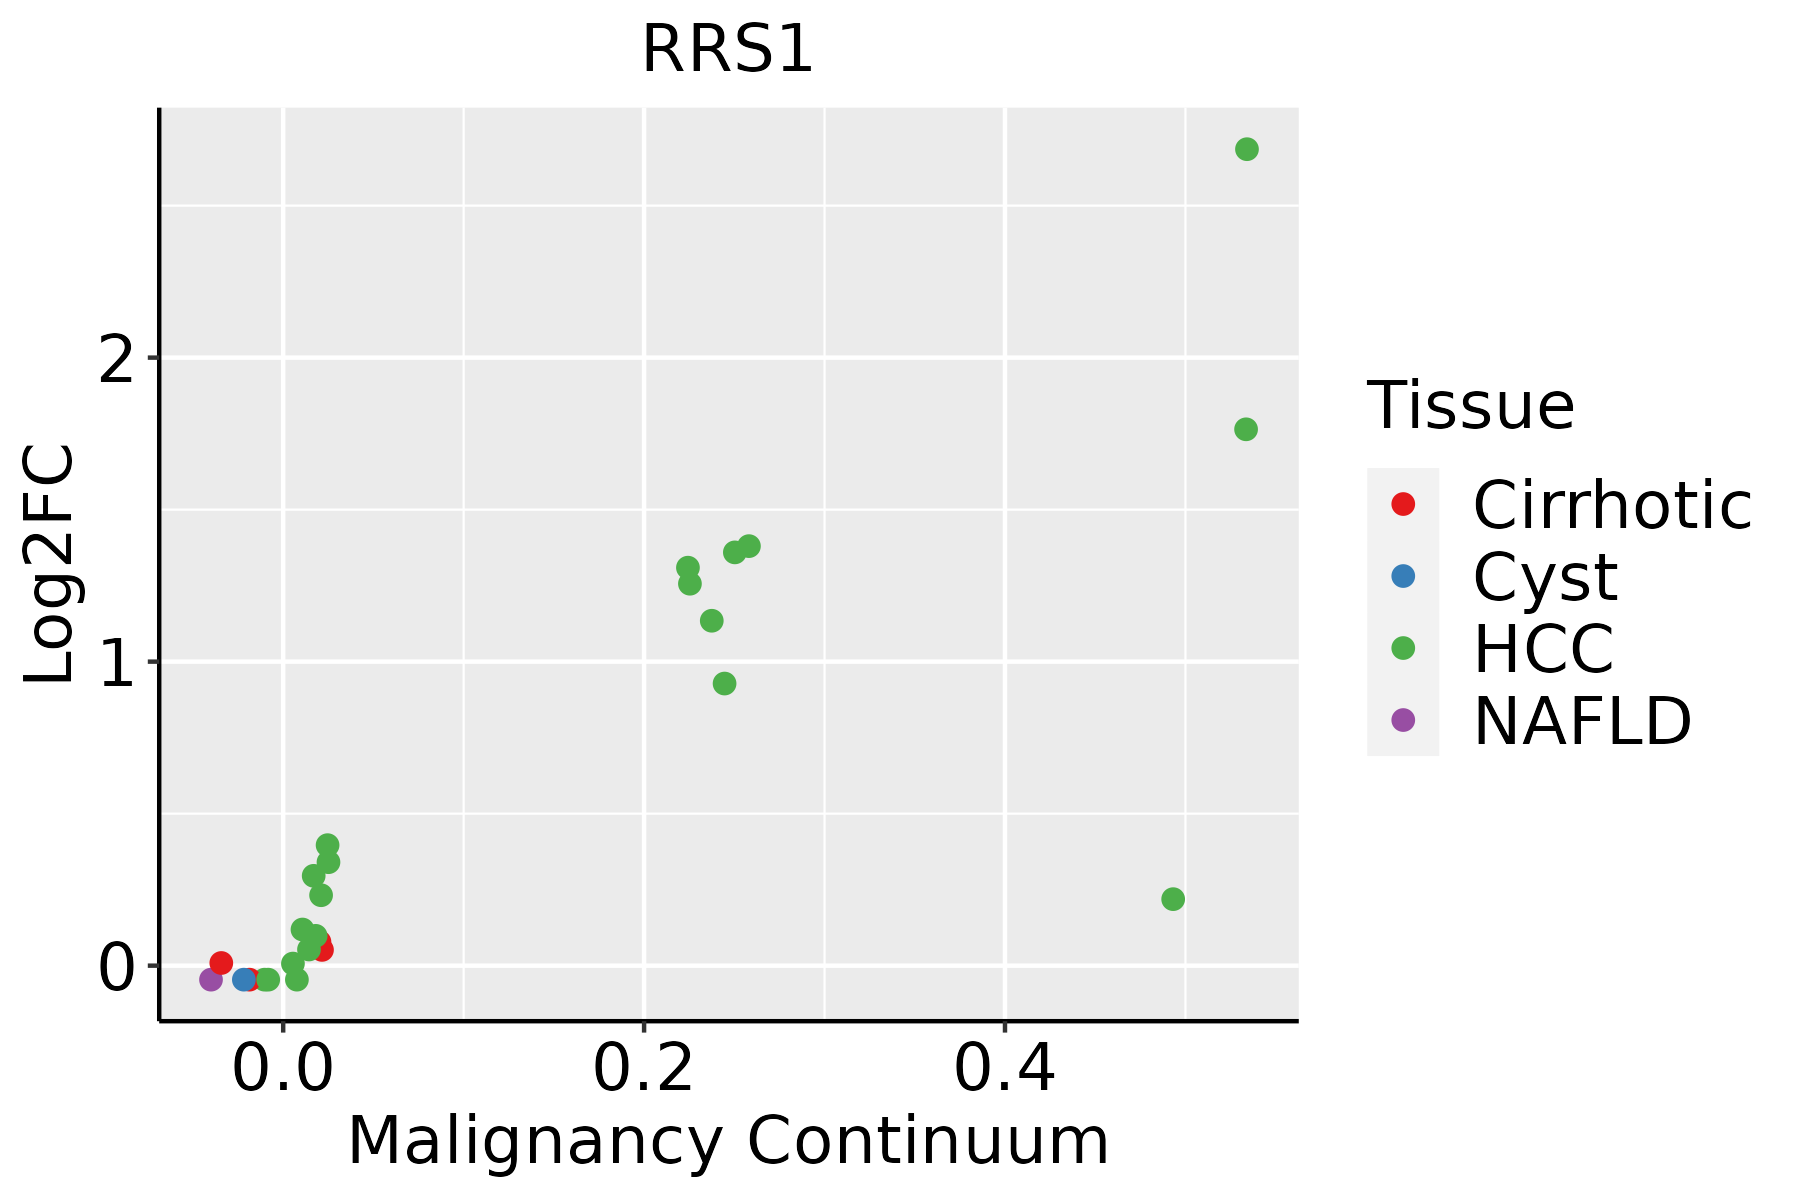 | HCC: Hepatocellular carcinoma |
| NAFLD: Non-alcoholic fatty liver disease | ||
| Oral Cavity | 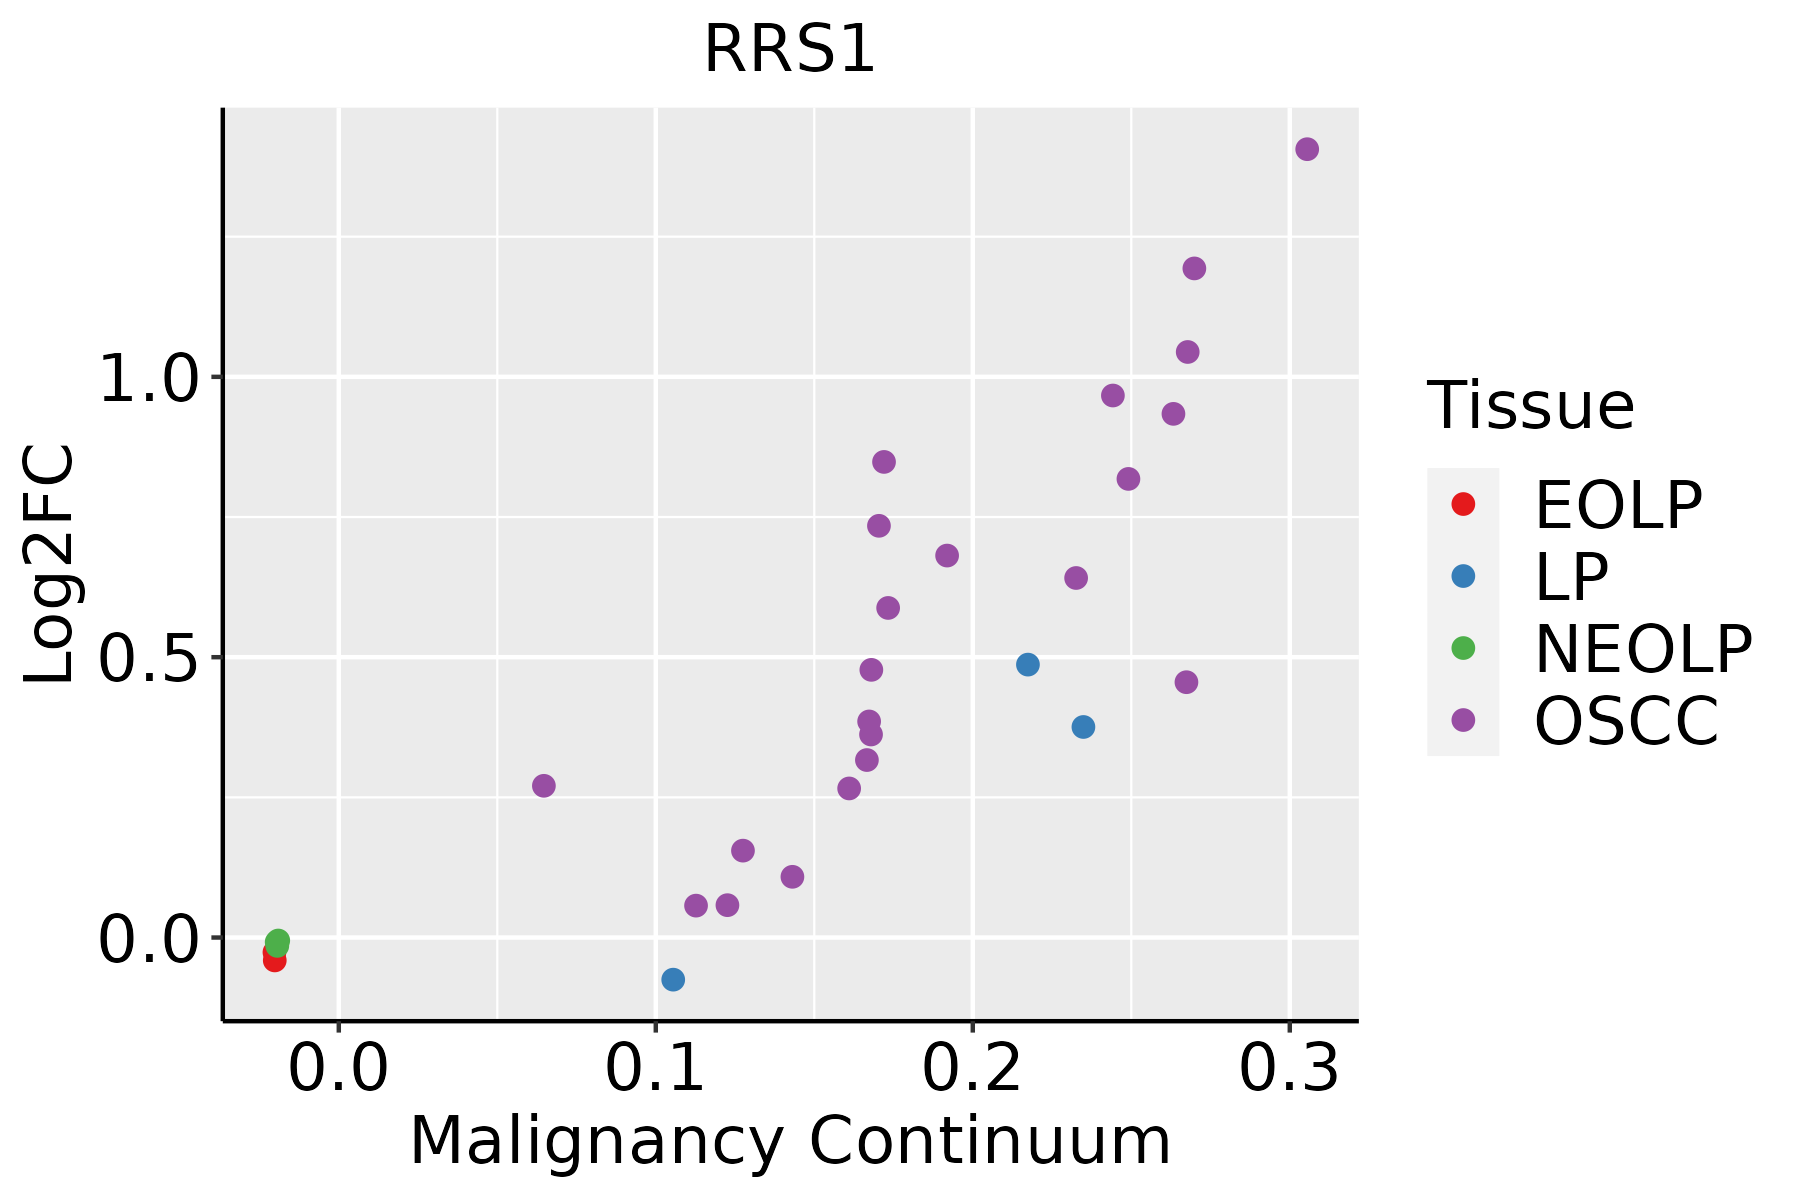 | EOLP: Erosive Oral lichen planus |
| LP: leukoplakia | ||
| NEOLP: Non-erosive oral lichen planus | ||
| OSCC: Oral squamous cell carcinoma | ||
| Skin |  | AK: Actinic keratosis |
| cSCC: Cutaneous squamous cell carcinoma | ||
| SCCIS:squamous cell carcinoma in situ | ||
| Thyroid |  | ATC: Anaplastic thyroid cancer |
| HT: Hashimoto's thyroiditis | ||
| PTC: Papillary thyroid cancer |
| ∗log2FC in expression of this searched gene in stem-like cells from each diseased tissue sample relative to stem-like cells in normal samples in each tissue plotted against the malignancy continuum. Samples are colored based on if they are from different disease stage. |
Top |
Malignant transformation related pathway analysis |
| Find out the enriched GO biological processes and KEGG pathways involved in transition from healthy to precancer to cancer |
| Tissue | Disease Stage | Enriched GO biological Processes |
| Colorectum | AD |  |
| Colorectum | SER |  |
| Colorectum | MSS |  |
| Colorectum | MSI-H |  |
| Colorectum | FAP |  |
| ∗Top 15 enriched GO BP terms are showed in the bar plot of each disease state in each tissue. Each row represents a significant GO biological process which is colored according to the -log10(p.adjust). |
| Page: 1 2 3 4 5 6 7 8 9 |
| GO ID | Tissue | Disease Stage | Description | Gene Ratio | Bg Ratio | pvalue | p.adjust | Count |
| GO:0048285 | Liver | HCC | organelle fission | 254/7958 | 488/18723 | 1.07e-05 | 1.23e-04 | 254 |
| GO:0007080 | Liver | HCC | mitotic metaphase plate congression | 36/7958 | 50/18723 | 2.28e-05 | 2.41e-04 | 36 |
| GO:0000469 | Liver | HCC | cleavage involved in rRNA processing | 22/7958 | 27/18723 | 3.97e-05 | 3.90e-04 | 22 |
| GO:0090502 | Liver | HCC | RNA phosphodiester bond hydrolysis, endonucleolytic | 52/7958 | 82/18723 | 1.06e-04 | 9.08e-04 | 52 |
| GO:000002722 | Liver | HCC | ribosomal large subunit assembly | 21/7958 | 27/18723 | 2.06e-04 | 1.59e-03 | 21 |
| GO:0051310 | Liver | HCC | metaphase plate congression | 42/7958 | 65/18723 | 2.63e-04 | 1.94e-03 | 42 |
| GO:0000466 | Liver | HCC | maturation of 5.8S rRNA from tricistronic rRNA transcript (SSU-rRNA, 5.8S rRNA, LSU-rRNA) | 19/7958 | 24/18723 | 2.80e-04 | 2.02e-03 | 19 |
| GO:0000478 | Liver | HCC | endonucleolytic cleavage involved in rRNA processing | 13/7958 | 15/18723 | 5.67e-04 | 3.61e-03 | 13 |
| GO:0000479 | Liver | HCC | endonucleolytic cleavage of tricistronic rRNA transcript (SSU-rRNA, 5.8S rRNA, LSU-rRNA) | 13/7958 | 15/18723 | 5.67e-04 | 3.61e-03 | 13 |
| GO:0000280 | Liver | HCC | nuclear division | 220/7958 | 439/18723 | 6.90e-04 | 4.25e-03 | 220 |
| GO:00000544 | Liver | HCC | ribosomal subunit export from nucleus | 12/7958 | 14/18723 | 1.17e-03 | 6.54e-03 | 12 |
| GO:00337504 | Liver | HCC | ribosome localization | 12/7958 | 14/18723 | 1.17e-03 | 6.54e-03 | 12 |
| GO:0050000 | Liver | HCC | chromosome localization | 49/7958 | 82/18723 | 1.20e-03 | 6.68e-03 | 49 |
| GO:19025701 | Liver | HCC | protein localization to nucleolus | 13/7958 | 16/18723 | 1.84e-03 | 9.42e-03 | 13 |
| GO:0051303 | Liver | HCC | establishment of chromosome localization | 47/7958 | 80/18723 | 2.45e-03 | 1.19e-02 | 47 |
| GO:00714282 | Liver | HCC | rRNA-containing ribonucleoprotein complex export from nucleus | 12/7958 | 15/18723 | 3.56e-03 | 1.59e-02 | 12 |
| GO:002261320 | Oral cavity | OSCC | ribonucleoprotein complex biogenesis | 333/7305 | 463/18723 | 8.28e-48 | 5.24e-44 | 333 |
| GO:004225420 | Oral cavity | OSCC | ribosome biogenesis | 230/7305 | 299/18723 | 3.22e-41 | 6.80e-38 | 230 |
| GO:000636410 | Oral cavity | OSCC | rRNA processing | 172/7305 | 225/18723 | 1.57e-30 | 1.24e-27 | 172 |
| GO:00344709 | Oral cavity | OSCC | ncRNA processing | 263/7305 | 395/18723 | 4.38e-29 | 2.78e-26 | 263 |
| Page: 1 2 3 4 5 6 7 8 9 10 11 12 13 14 15 16 17 |
| Pathway ID | Tissue | Disease Stage | Description | Gene Ratio | Bg Ratio | pvalue | p.adjust | qvalue | Count |
| Page: 1 |
Top |
Cell-cell communication analysis |
| Identification of potential cell-cell interactions between two cell types and their ligand-receptor pairs for different disease states |
| Ligand | Receptor | LRpair | Pathway | Tissue | Disease Stage |
| Page: 1 |
Top |
Single-cell gene regulatory network inference analysis |
| Find out the significant the regulons (TFs) and the target genes of each regulon across cell types for different disease states |
| TF | Cell Type | Tissue | Disease Stage | Target Gene | RSS | Regulon Activity |
| ∗The dot plots of a searched regulon are shown for all cell subpopulations in each disease state of each tissue based on the regulon specific score inferred using pySCENIC and by calculating the average expression. |
| Page: 1 |
Top |
Somatic mutation of malignant transformation related genes |
| Annotation of somatic variants for genes involved in malignant transformation |
| Hugo Symbol | Variant Class | Variant Classification | dbSNP RS | HGVSc | HGVSp | HGVSp Short | SWISSPROT | BIOTYPE | SIFT | PolyPhen | Tumor Sample Barcode | Tissue | Histology | Sex | Age | Stage | Therapy Types | Drugs | Outcome |
| RRS1 | SNV | Missense_Mutation | c.49N>A | p.Glu17Lys | p.E17K | Q15050 | protein_coding | tolerated(0.21) | benign(0.359) | TCGA-GM-A2D9-01 | Breast | breast invasive carcinoma | Female | >=65 | I/II | Hormone Therapy | arimidex | SD | |
| RRS1 | SNV | Missense_Mutation | c.854N>T | p.Thr285Ile | p.T285I | Q15050 | protein_coding | tolerated(0.08) | possibly_damaging(0.597) | TCGA-D5-6928-01 | Colorectum | colon adenocarcinoma | Male | >=65 | I/II | Unknown | Unknown | SD | |
| RRS1 | deletion | Frame_Shift_Del | c.140delC | p.Pro47ArgfsTer42 | p.P47Rfs*42 | Q15050 | protein_coding | TCGA-D5-6540-01 | Colorectum | colon adenocarcinoma | Male | >=65 | I/II | Unknown | Unknown | SD | |||
| RRS1 | deletion | Frame_Shift_Del | c.135delN | p.Pro47ArgfsTer42 | p.P47Rfs*42 | Q15050 | protein_coding | TCGA-G4-6588-01 | Colorectum | colon adenocarcinoma | Female | <65 | I/II | Unknown | Unknown | SD | |||
| RRS1 | deletion | Frame_Shift_Del | c.135delN | p.Pro47ArgfsTer42 | p.P47Rfs*42 | Q15050 | protein_coding | TCGA-WS-AB45-01 | Colorectum | colon adenocarcinoma | Female | <65 | I/II | Unknown | Unknown | SD | |||
| RRS1 | SNV | Missense_Mutation | novel | c.410N>A | p.Ser137Asn | p.S137N | Q15050 | protein_coding | tolerated(0.53) | benign(0.046) | TCGA-AJ-A3EK-01 | Endometrium | uterine corpus endometrioid carcinoma | Female | <65 | I/II | Chemotherapy | carboplatin | CR |
| RRS1 | SNV | Missense_Mutation | novel | c.1031C>T | p.Ser344Phe | p.S344F | Q15050 | protein_coding | deleterious_low_confidence(0.02) | benign(0.062) | TCGA-AP-A1DV-01 | Endometrium | uterine corpus endometrioid carcinoma | Female | <65 | I/II | Unknown | Unknown | SD |
| RRS1 | SNV | Missense_Mutation | novel | c.247N>T | p.Arg83Cys | p.R83C | Q15050 | protein_coding | deleterious(0) | possibly_damaging(0.825) | TCGA-AX-A3FS-01 | Endometrium | uterine corpus endometrioid carcinoma | Female | >=65 | I/II | Unknown | Unknown | SD |
| RRS1 | SNV | Missense_Mutation | novel | c.470T>G | p.Leu157Arg | p.L157R | Q15050 | protein_coding | deleterious(0) | probably_damaging(0.994) | TCGA-EO-A3B0-01 | Endometrium | uterine corpus endometrioid carcinoma | Female | <65 | III/IV | Unknown | Unknown | SD |
| RRS1 | SNV | Missense_Mutation | rs775749259 | c.1031C>A | p.Ser344Tyr | p.S344Y | Q15050 | protein_coding | deleterious_low_confidence(0.02) | benign(0.062) | TCGA-EO-A3B0-01 | Endometrium | uterine corpus endometrioid carcinoma | Female | <65 | III/IV | Unknown | Unknown | SD |
| Page: 1 2 |
Top |
Related drugs of malignant transformation related genes |
| Identification of chemicals and drugs interact with genes involved in malignant transfromation |
| (DGIdb 4.0) |
| Entrez ID | Symbol | Category | Interaction Types | Drug Claim Name | Drug Name | PMIDs |
| Page: 1 |

Copyright 2023-Present -The University of Texas Health Science Center at Houston |