
|
|||||
|
 | |
| |
| |
| |
| |
| |
|
Gene: RRP36 |
Gene summary for RRP36 |
| Gene information | Species | Human | Gene symbol | RRP36 | Gene ID | 88745 |
| Gene name | ribosomal RNA processing 36 | |
| Gene Alias | C6orf153 | |
| Cytomap | 6p21.1 | |
| Gene Type | protein-coding | GO ID | GO:0000462 | UniProtAcc | Q96EU6 |
Top |
Malignant transformation analysis |
| Identification of the aberrant gene expression in precancerous and cancerous lesions by comparing the gene expression of stem-like cells in diseased tissues with normal stem cells |
| Entrez ID | Symbol | Replicates | Species | Organ | Tissue | Adj P-value | Log2FC | Malignancy |
| 88745 | RRP36 | LZE2T | Human | Esophagus | ESCC | 1.65e-02 | 8.97e-01 | 0.082 |
| 88745 | RRP36 | LZE20T | Human | Esophagus | ESCC | 1.68e-07 | 1.61e-01 | 0.0662 |
| 88745 | RRP36 | LZE22T | Human | Esophagus | ESCC | 3.32e-02 | 2.12e-01 | 0.068 |
| 88745 | RRP36 | LZE24T | Human | Esophagus | ESCC | 1.34e-06 | 1.23e-01 | 0.0596 |
| 88745 | RRP36 | P1T-E | Human | Esophagus | ESCC | 8.64e-03 | 1.16e-01 | 0.0875 |
| 88745 | RRP36 | P2T-E | Human | Esophagus | ESCC | 5.42e-13 | 1.18e-01 | 0.1177 |
| 88745 | RRP36 | P4T-E | Human | Esophagus | ESCC | 7.65e-17 | 3.74e-01 | 0.1323 |
| 88745 | RRP36 | P5T-E | Human | Esophagus | ESCC | 3.68e-12 | 1.96e-01 | 0.1327 |
| 88745 | RRP36 | P8T-E | Human | Esophagus | ESCC | 2.75e-03 | 5.78e-02 | 0.0889 |
| 88745 | RRP36 | P9T-E | Human | Esophagus | ESCC | 3.88e-08 | 1.33e-01 | 0.1131 |
| 88745 | RRP36 | P10T-E | Human | Esophagus | ESCC | 2.40e-08 | 9.72e-02 | 0.116 |
| 88745 | RRP36 | P12T-E | Human | Esophagus | ESCC | 5.87e-10 | 9.18e-02 | 0.1122 |
| 88745 | RRP36 | P15T-E | Human | Esophagus | ESCC | 1.04e-04 | 7.77e-02 | 0.1149 |
| 88745 | RRP36 | P16T-E | Human | Esophagus | ESCC | 3.13e-04 | 3.15e-02 | 0.1153 |
| 88745 | RRP36 | P17T-E | Human | Esophagus | ESCC | 1.33e-05 | 1.85e-01 | 0.1278 |
| 88745 | RRP36 | P20T-E | Human | Esophagus | ESCC | 1.27e-08 | 9.67e-02 | 0.1124 |
| 88745 | RRP36 | P21T-E | Human | Esophagus | ESCC | 1.49e-13 | 2.10e-01 | 0.1617 |
| 88745 | RRP36 | P22T-E | Human | Esophagus | ESCC | 6.17e-14 | 2.00e-01 | 0.1236 |
| 88745 | RRP36 | P23T-E | Human | Esophagus | ESCC | 5.66e-12 | 3.07e-01 | 0.108 |
| 88745 | RRP36 | P24T-E | Human | Esophagus | ESCC | 3.12e-10 | 1.61e-01 | 0.1287 |
| Page: 1 2 3 4 5 6 |
| Tissue | Expression Dynamics | Abbreviation |
| Esophagus | 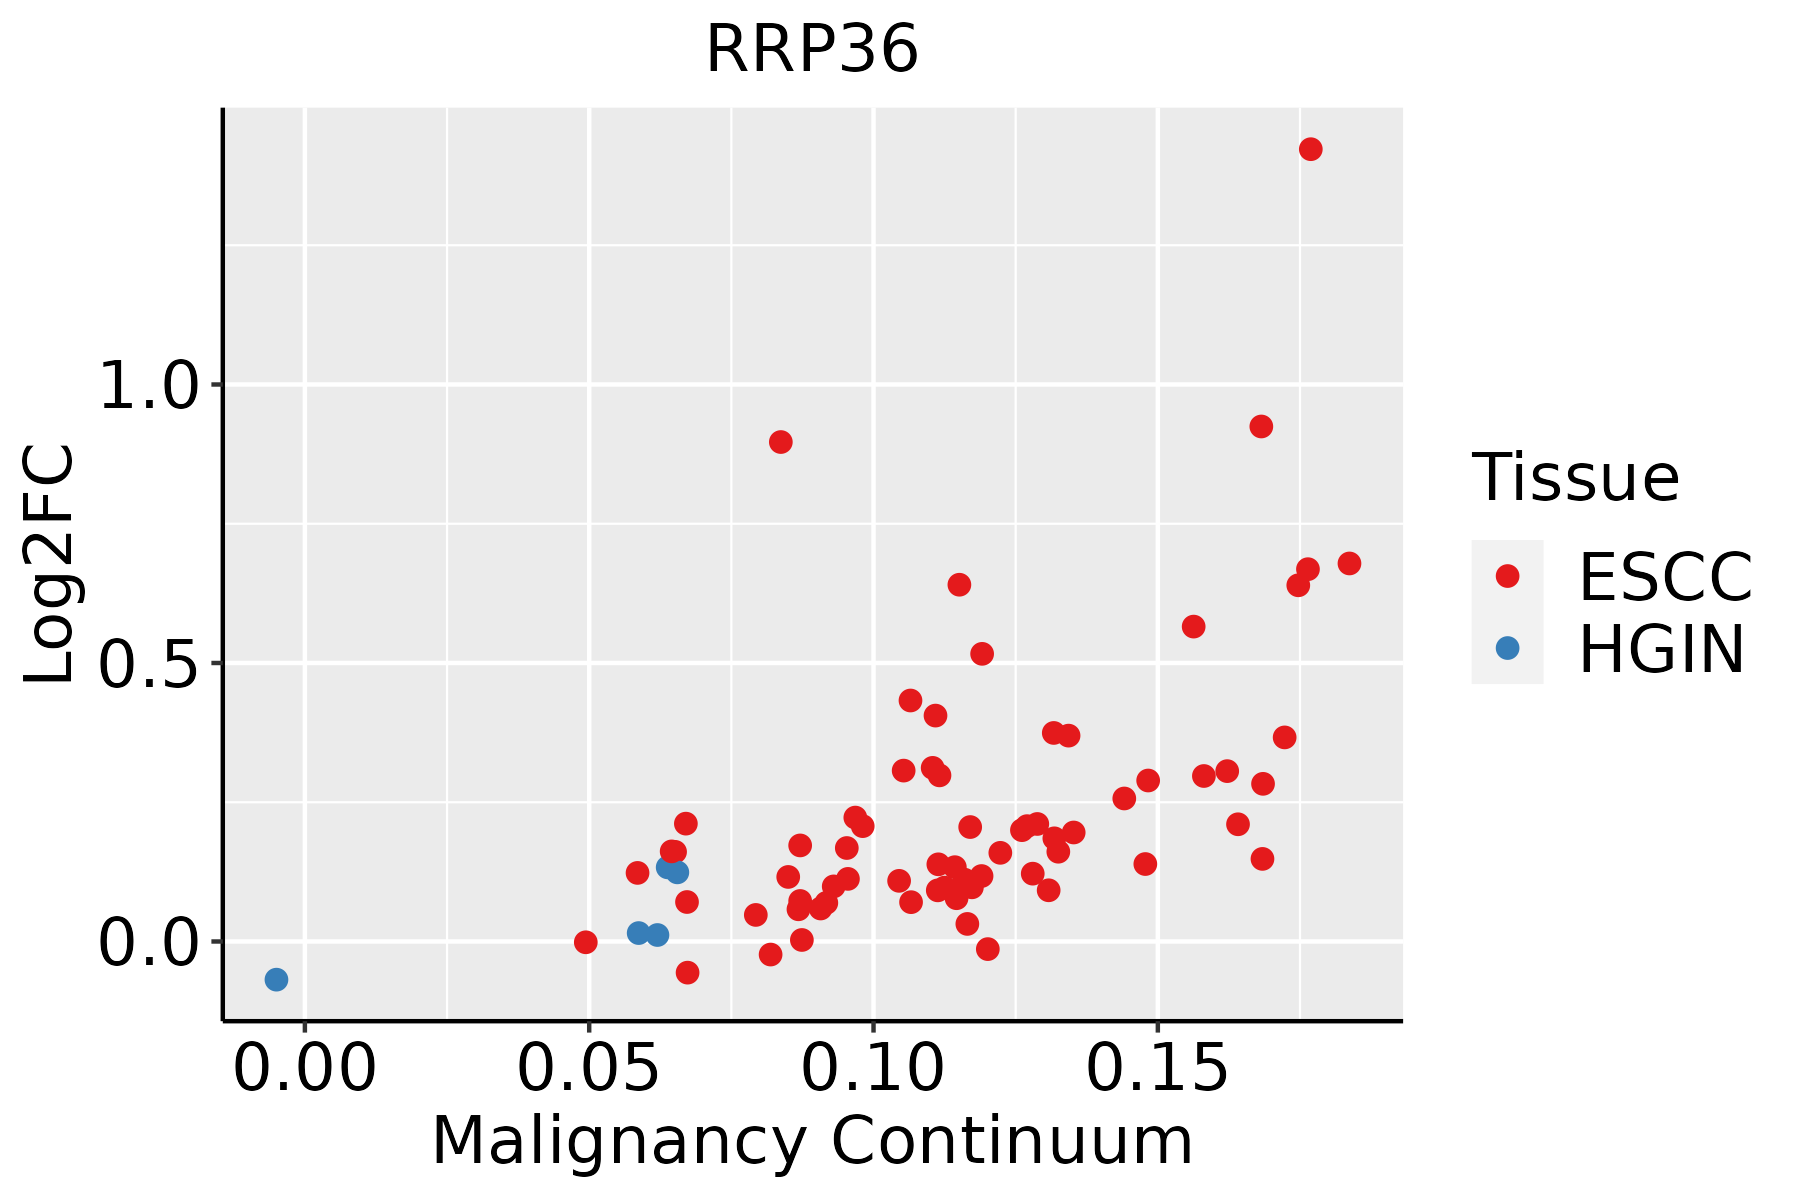 | ESCC: Esophageal squamous cell carcinoma |
| HGIN: High-grade intraepithelial neoplasias | ||
| LGIN: Low-grade intraepithelial neoplasias | ||
| Liver | 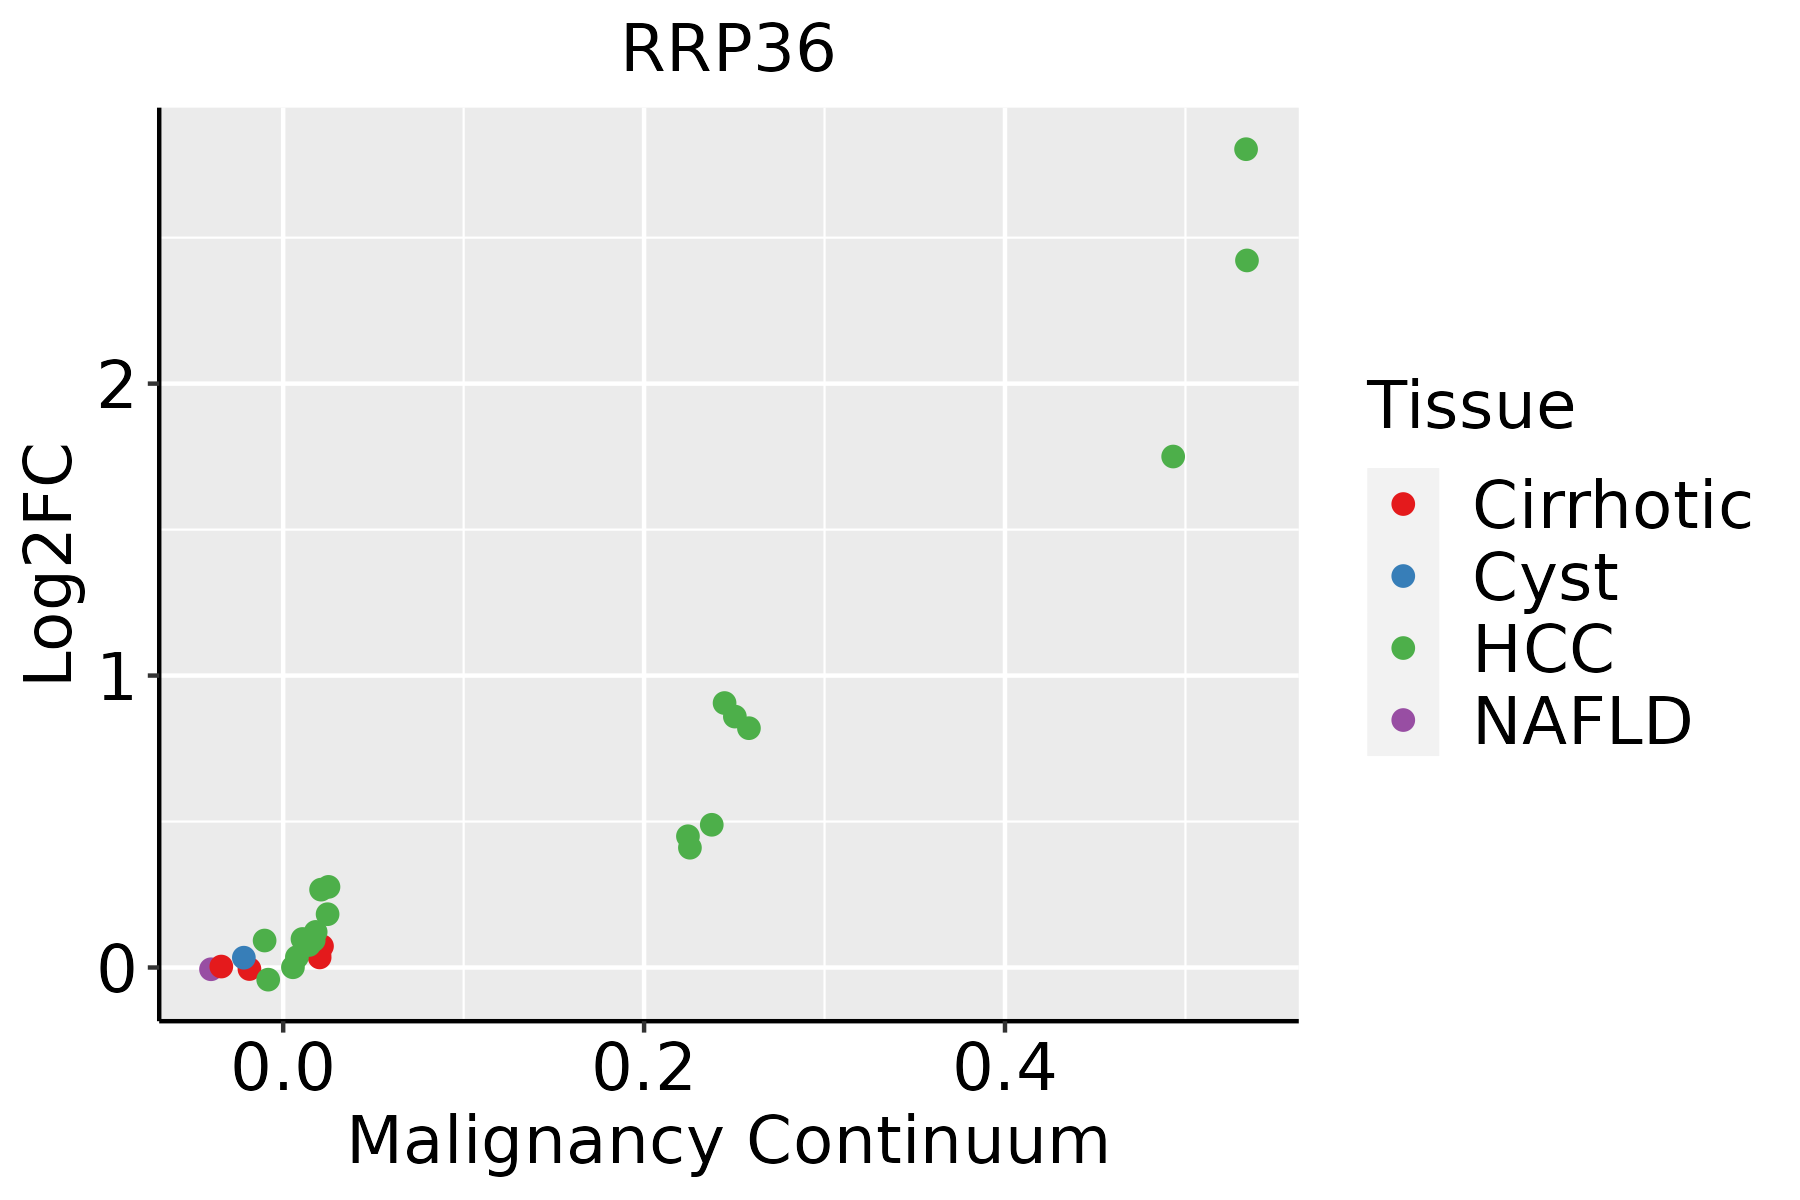 | HCC: Hepatocellular carcinoma |
| NAFLD: Non-alcoholic fatty liver disease | ||
| Oral Cavity |  | EOLP: Erosive Oral lichen planus |
| LP: leukoplakia | ||
| NEOLP: Non-erosive oral lichen planus | ||
| OSCC: Oral squamous cell carcinoma | ||
| Skin | 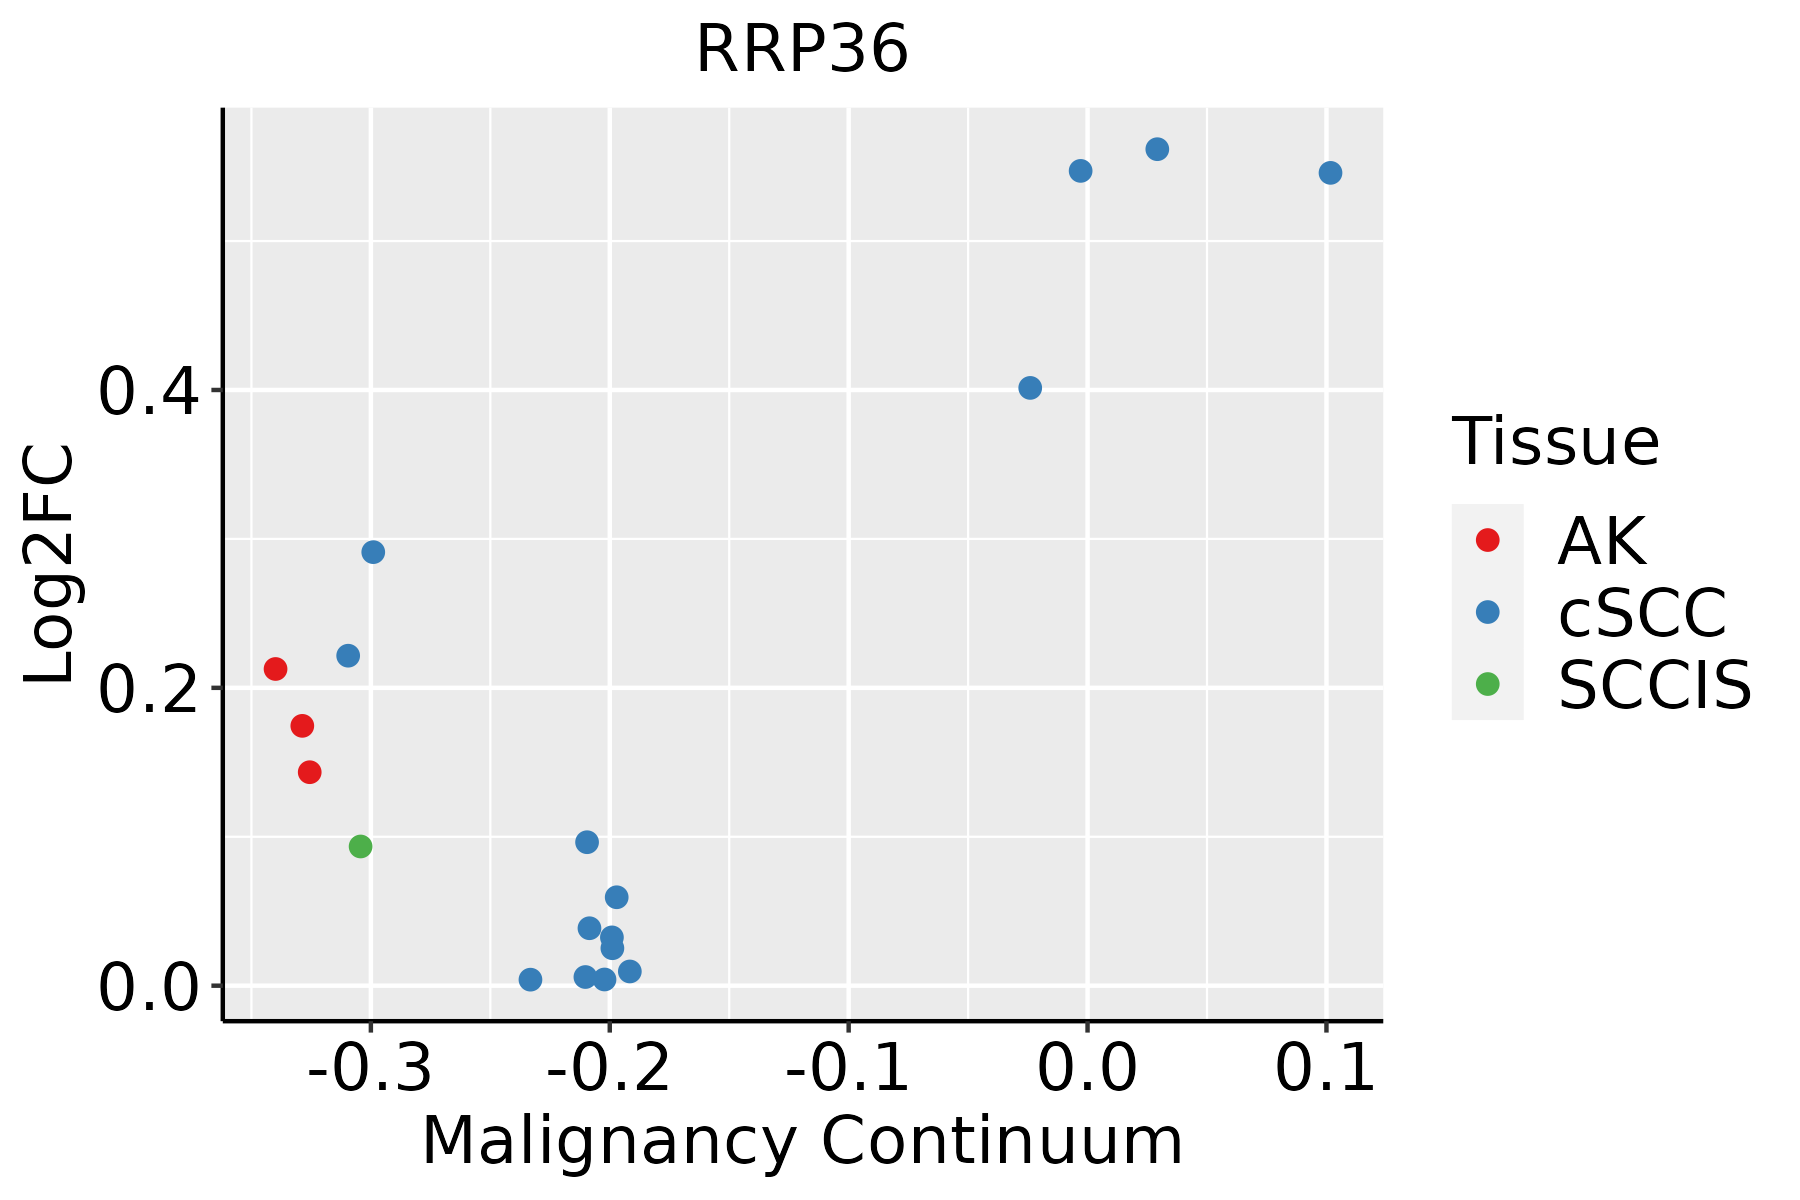 | AK: Actinic keratosis |
| cSCC: Cutaneous squamous cell carcinoma | ||
| SCCIS:squamous cell carcinoma in situ | ||
| Thyroid | 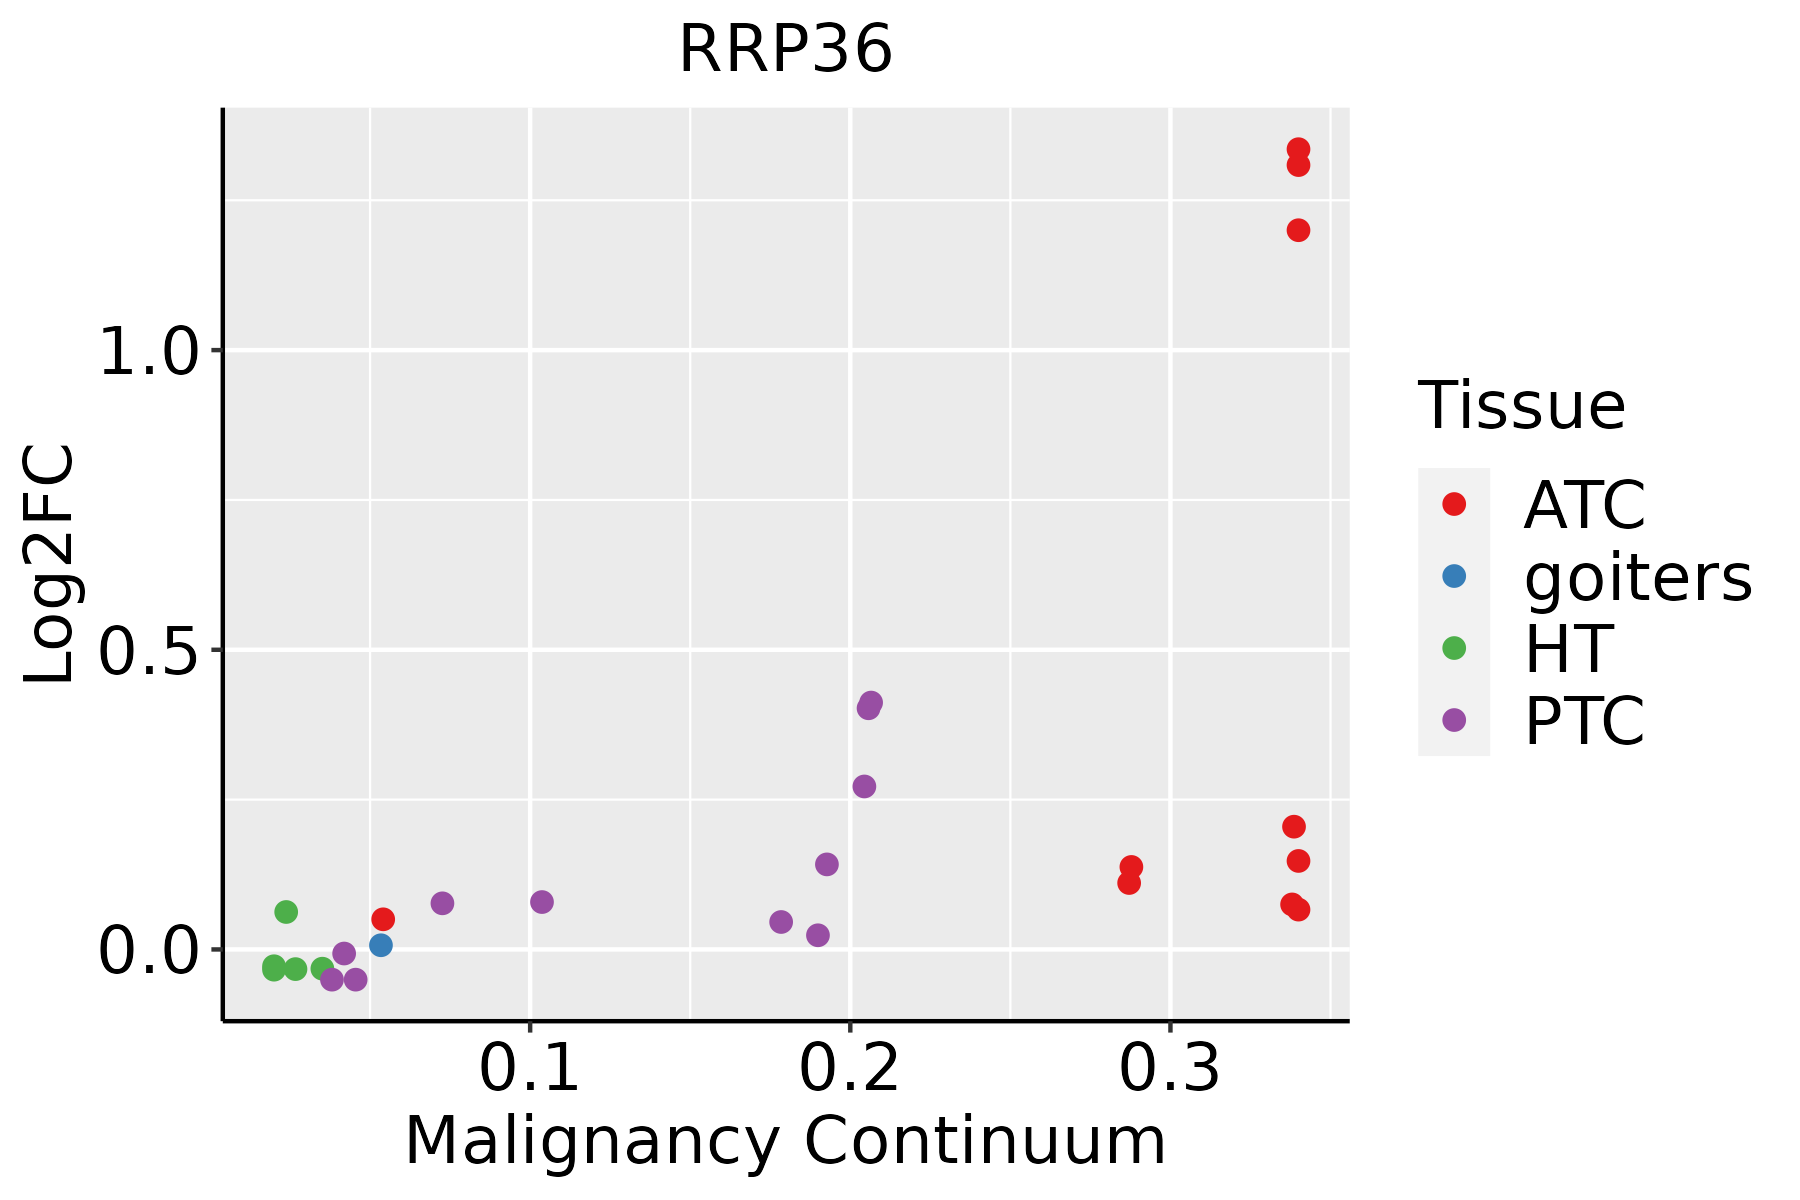 | ATC: Anaplastic thyroid cancer |
| HT: Hashimoto's thyroiditis | ||
| PTC: Papillary thyroid cancer |
| ∗log2FC in expression of this searched gene in stem-like cells from each diseased tissue sample relative to stem-like cells in normal samples in each tissue plotted against the malignancy continuum. Samples are colored based on if they are from different disease stage. |
Top |
Malignant transformation related pathway analysis |
| Find out the enriched GO biological processes and KEGG pathways involved in transition from healthy to precancer to cancer |
| Tissue | Disease Stage | Enriched GO biological Processes |
| Colorectum | AD |  |
| Colorectum | SER |  |
| Colorectum | MSS |  |
| Colorectum | MSI-H |  |
| Colorectum | FAP |  |
| ∗Top 15 enriched GO BP terms are showed in the bar plot of each disease state in each tissue. Each row represents a significant GO biological process which is colored according to the -log10(p.adjust). |
| Page: 1 2 3 4 5 6 7 8 9 |
| GO ID | Tissue | Disease Stage | Description | Gene Ratio | Bg Ratio | pvalue | p.adjust | Count |
| GO:00903055 | Thyroid | PTC | nucleic acid phosphodiester bond hydrolysis | 105/5968 | 261/18723 | 2.53e-03 | 1.31e-02 | 105 |
| GO:002261334 | Thyroid | ATC | ribonucleoprotein complex biogenesis | 292/6293 | 463/18723 | 3.05e-39 | 9.63e-36 | 292 |
| GO:004225434 | Thyroid | ATC | ribosome biogenesis | 203/6293 | 299/18723 | 3.63e-34 | 4.59e-31 | 203 |
| GO:000636432 | Thyroid | ATC | rRNA processing | 157/6293 | 225/18723 | 9.02e-29 | 5.70e-26 | 157 |
| GO:001607232 | Thyroid | ATC | rRNA metabolic process | 161/6293 | 236/18723 | 1.02e-27 | 5.89e-25 | 161 |
| GO:003447021 | Thyroid | ATC | ncRNA processing | 216/6293 | 395/18723 | 3.14e-18 | 3.98e-16 | 216 |
| GO:003466021 | Thyroid | ATC | ncRNA metabolic process | 240/6293 | 485/18723 | 2.03e-13 | 9.91e-12 | 240 |
| GO:004227435 | Thyroid | ATC | ribosomal small subunit biogenesis | 55/6293 | 73/18723 | 3.33e-13 | 1.55e-11 | 55 |
| GO:003049013 | Thyroid | ATC | maturation of SSU-rRNA | 35/6293 | 50/18723 | 1.56e-07 | 2.52e-06 | 35 |
| GO:000046911 | Thyroid | ATC | cleavage involved in rRNA processing | 21/6293 | 27/18723 | 3.28e-06 | 3.69e-05 | 21 |
| GO:009050112 | Thyroid | ATC | RNA phosphodiester bond hydrolysis | 76/6293 | 152/18723 | 2.07e-05 | 1.86e-04 | 76 |
| GO:000046213 | Thyroid | ATC | maturation of SSU-rRNA from tricistronic rRNA transcript (SSU-rRNA, 5.8S rRNA, LSU-rRNA) | 25/6293 | 37/18723 | 2.50e-05 | 2.16e-04 | 25 |
| GO:009030511 | Thyroid | ATC | nucleic acid phosphodiester bond hydrolysis | 107/6293 | 261/18723 | 7.21e-03 | 2.84e-02 | 107 |
| Page: 1 2 3 4 5 |
| Pathway ID | Tissue | Disease Stage | Description | Gene Ratio | Bg Ratio | pvalue | p.adjust | qvalue | Count |
| Page: 1 |
Top |
Cell-cell communication analysis |
| Identification of potential cell-cell interactions between two cell types and their ligand-receptor pairs for different disease states |
| Ligand | Receptor | LRpair | Pathway | Tissue | Disease Stage |
| Page: 1 |
Top |
Single-cell gene regulatory network inference analysis |
| Find out the significant the regulons (TFs) and the target genes of each regulon across cell types for different disease states |
| TF | Cell Type | Tissue | Disease Stage | Target Gene | RSS | Regulon Activity |
| ∗The dot plots of a searched regulon are shown for all cell subpopulations in each disease state of each tissue based on the regulon specific score inferred using pySCENIC and by calculating the average expression. |
| Page: 1 |
Top |
Somatic mutation of malignant transformation related genes |
| Annotation of somatic variants for genes involved in malignant transformation |
| Hugo Symbol | Variant Class | Variant Classification | dbSNP RS | HGVSc | HGVSp | HGVSp Short | SWISSPROT | BIOTYPE | SIFT | PolyPhen | Tumor Sample Barcode | Tissue | Histology | Sex | Age | Stage | Therapy Types | Drugs | Outcome |
| RRP36 | SNV | Missense_Mutation | novel | c.758N>G | p.His253Arg | p.H253R | Q96EU6 | protein_coding | tolerated(0.8) | benign(0.003) | TCGA-AA-A02J-01 | Colorectum | colon adenocarcinoma | Female | >=65 | III/IV | Unknown | Unknown | PD |
| RRP36 | SNV | Missense_Mutation | c.201N>C | p.Gln67His | p.Q67H | Q96EU6 | protein_coding | deleterious(0.04) | benign(0.359) | TCGA-AG-A002-01 | Colorectum | rectum adenocarcinoma | Male | <65 | I/II | Unknown | Unknown | SD | |
| RRP36 | SNV | Missense_Mutation | c.714N>A | p.Phe238Leu | p.F238L | Q96EU6 | protein_coding | deleterious(0) | possibly_damaging(0.9) | TCGA-AX-A0J0-01 | Endometrium | uterine corpus endometrioid carcinoma | Female | <65 | I/II | Unknown | Unknown | SD | |
| RRP36 | SNV | Missense_Mutation | novel | c.189G>T | p.Lys63Asn | p.K63N | Q96EU6 | protein_coding | deleterious(0.01) | benign(0.066) | TCGA-AX-A2HC-01 | Endometrium | uterine corpus endometrioid carcinoma | Female | <65 | III/IV | Chemotherapy | paclitaxel | PD |
| RRP36 | SNV | Missense_Mutation | rs763256930 | c.653G>A | p.Arg218His | p.R218H | Q96EU6 | protein_coding | deleterious(0.05) | probably_damaging(0.96) | TCGA-AX-A2HC-01 | Endometrium | uterine corpus endometrioid carcinoma | Female | <65 | III/IV | Chemotherapy | paclitaxel | PD |
| RRP36 | SNV | Missense_Mutation | rs763256930 | c.653N>A | p.Arg218His | p.R218H | Q96EU6 | protein_coding | deleterious(0.05) | probably_damaging(0.96) | TCGA-AX-A2HD-01 | Endometrium | uterine corpus endometrioid carcinoma | Female | >=65 | III/IV | Unknown | Unknown | SD |
| RRP36 | SNV | Missense_Mutation | rs760969484 | c.319N>T | p.Arg107Cys | p.R107C | Q96EU6 | protein_coding | deleterious(0.01) | probably_damaging(0.999) | TCGA-BG-A221-01 | Endometrium | uterine corpus endometrioid carcinoma | Female | >=65 | I/II | Unknown | Unknown | SD |
| RRP36 | SNV | Missense_Mutation | novel | c.628T>C | p.Tyr210His | p.Y210H | Q96EU6 | protein_coding | deleterious(0) | probably_damaging(0.972) | TCGA-BG-A222-01 | Endometrium | uterine corpus endometrioid carcinoma | Female | <65 | I/II | Unknown | Unknown | SD |
| RRP36 | SNV | Missense_Mutation | c.708N>T | p.Glu236Asp | p.E236D | Q96EU6 | protein_coding | tolerated(0.19) | benign(0.04) | TCGA-D1-A17Q-01 | Endometrium | uterine corpus endometrioid carcinoma | Female | <65 | I/II | Unknown | Unknown | SD | |
| RRP36 | SNV | Missense_Mutation | rs763977082 | c.420N>A | p.Phe140Leu | p.F140L | Q96EU6 | protein_coding | deleterious(0) | probably_damaging(0.999) | TCGA-EO-A22X-01 | Endometrium | uterine corpus endometrioid carcinoma | Female | <65 | III/IV | Unspecific | Carboplatin | Complete Response |
| Page: 1 2 |
Top |
Related drugs of malignant transformation related genes |
| Identification of chemicals and drugs interact with genes involved in malignant transfromation |
| (DGIdb 4.0) |
| Entrez ID | Symbol | Category | Interaction Types | Drug Claim Name | Drug Name | PMIDs |
| Page: 1 |

Copyright 2023-Present -The University of Texas Health Science Center at Houston |