
|
|||||
|
 | |
| |
| |
| |
| |
| |
|
Gene: RPA2 |
Gene summary for RPA2 |
| Gene information | Species | Human | Gene symbol | RPA2 | Gene ID | 6118 |
| Gene name | replication protein A2 | |
| Gene Alias | REPA2 | |
| Cytomap | 1p35.3 | |
| Gene Type | protein-coding | GO ID | GO:0000018 | UniProtAcc | B4DUL2 |
Top |
Malignant transformation analysis |
| Identification of the aberrant gene expression in precancerous and cancerous lesions by comparing the gene expression of stem-like cells in diseased tissues with normal stem cells |
| Entrez ID | Symbol | Replicates | Species | Organ | Tissue | Adj P-value | Log2FC | Malignancy |
| 6118 | RPA2 | LZE4T | Human | Esophagus | ESCC | 9.39e-08 | 2.63e-01 | 0.0811 |
| 6118 | RPA2 | LZE7T | Human | Esophagus | ESCC | 1.44e-08 | 4.07e-01 | 0.0667 |
| 6118 | RPA2 | LZE8T | Human | Esophagus | ESCC | 9.10e-04 | 1.01e-01 | 0.067 |
| 6118 | RPA2 | LZE20T | Human | Esophagus | ESCC | 6.68e-03 | 1.75e-01 | 0.0662 |
| 6118 | RPA2 | LZE22T | Human | Esophagus | ESCC | 4.67e-03 | 3.34e-01 | 0.068 |
| 6118 | RPA2 | LZE24T | Human | Esophagus | ESCC | 4.52e-15 | 3.66e-01 | 0.0596 |
| 6118 | RPA2 | LZE21T | Human | Esophagus | ESCC | 2.82e-04 | 2.45e-01 | 0.0655 |
| 6118 | RPA2 | LZE6T | Human | Esophagus | ESCC | 1.71e-04 | 2.41e-01 | 0.0845 |
| 6118 | RPA2 | P1T-E | Human | Esophagus | ESCC | 4.37e-04 | 4.40e-01 | 0.0875 |
| 6118 | RPA2 | P2T-E | Human | Esophagus | ESCC | 5.38e-34 | 6.11e-01 | 0.1177 |
| 6118 | RPA2 | P4T-E | Human | Esophagus | ESCC | 1.87e-20 | 5.30e-01 | 0.1323 |
| 6118 | RPA2 | P5T-E | Human | Esophagus | ESCC | 3.59e-22 | 4.58e-01 | 0.1327 |
| 6118 | RPA2 | P8T-E | Human | Esophagus | ESCC | 7.39e-25 | 5.06e-01 | 0.0889 |
| 6118 | RPA2 | P9T-E | Human | Esophagus | ESCC | 9.65e-06 | 2.05e-01 | 0.1131 |
| 6118 | RPA2 | P10T-E | Human | Esophagus | ESCC | 6.11e-55 | 1.08e+00 | 0.116 |
| 6118 | RPA2 | P11T-E | Human | Esophagus | ESCC | 3.35e-11 | 5.86e-01 | 0.1426 |
| 6118 | RPA2 | P12T-E | Human | Esophagus | ESCC | 4.96e-21 | 3.47e-01 | 0.1122 |
| 6118 | RPA2 | P15T-E | Human | Esophagus | ESCC | 2.77e-15 | 3.80e-01 | 0.1149 |
| 6118 | RPA2 | P16T-E | Human | Esophagus | ESCC | 1.42e-15 | 3.30e-01 | 0.1153 |
| 6118 | RPA2 | P17T-E | Human | Esophagus | ESCC | 1.26e-06 | 3.60e-01 | 0.1278 |
| Page: 1 2 3 4 5 6 |
| Tissue | Expression Dynamics | Abbreviation |
| Esophagus |  | ESCC: Esophageal squamous cell carcinoma |
| HGIN: High-grade intraepithelial neoplasias | ||
| LGIN: Low-grade intraepithelial neoplasias | ||
| Liver | 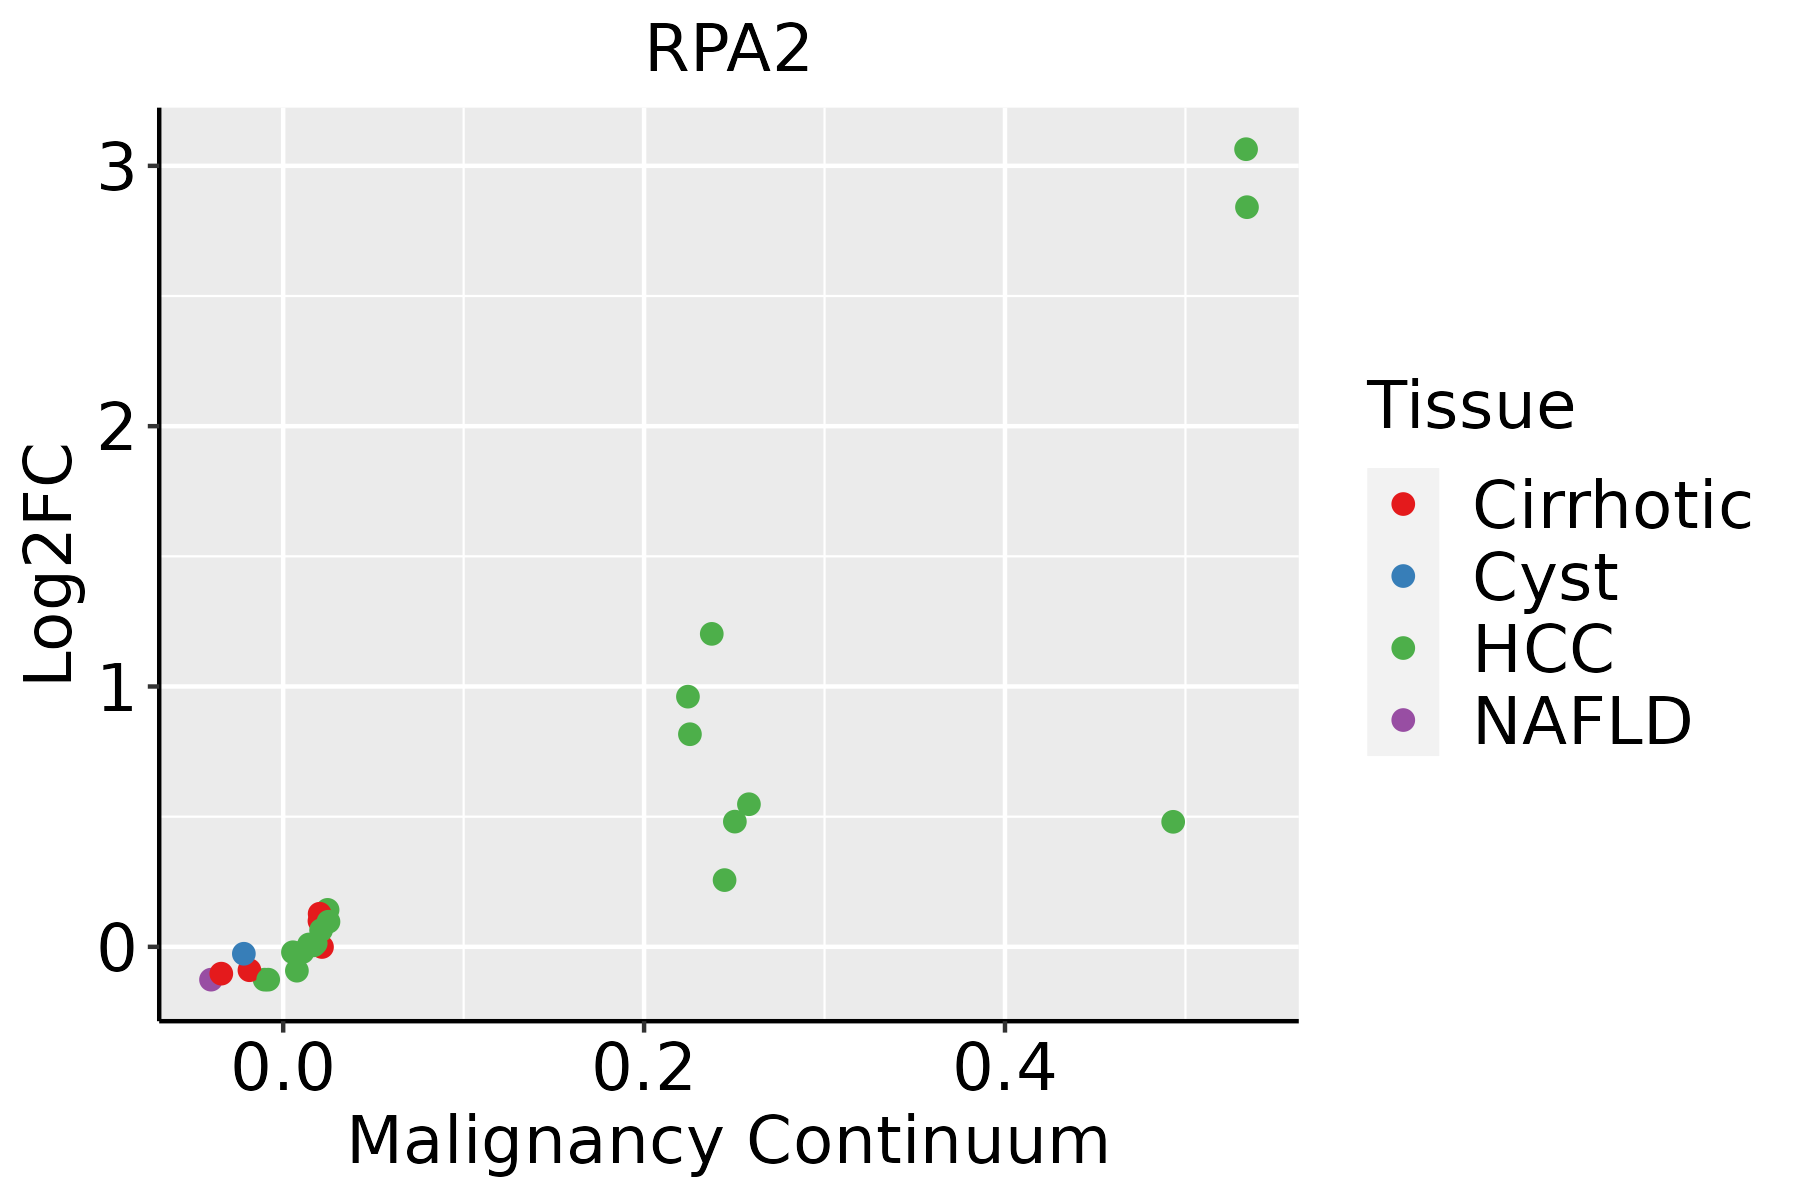 | HCC: Hepatocellular carcinoma |
| NAFLD: Non-alcoholic fatty liver disease | ||
| Oral Cavity | 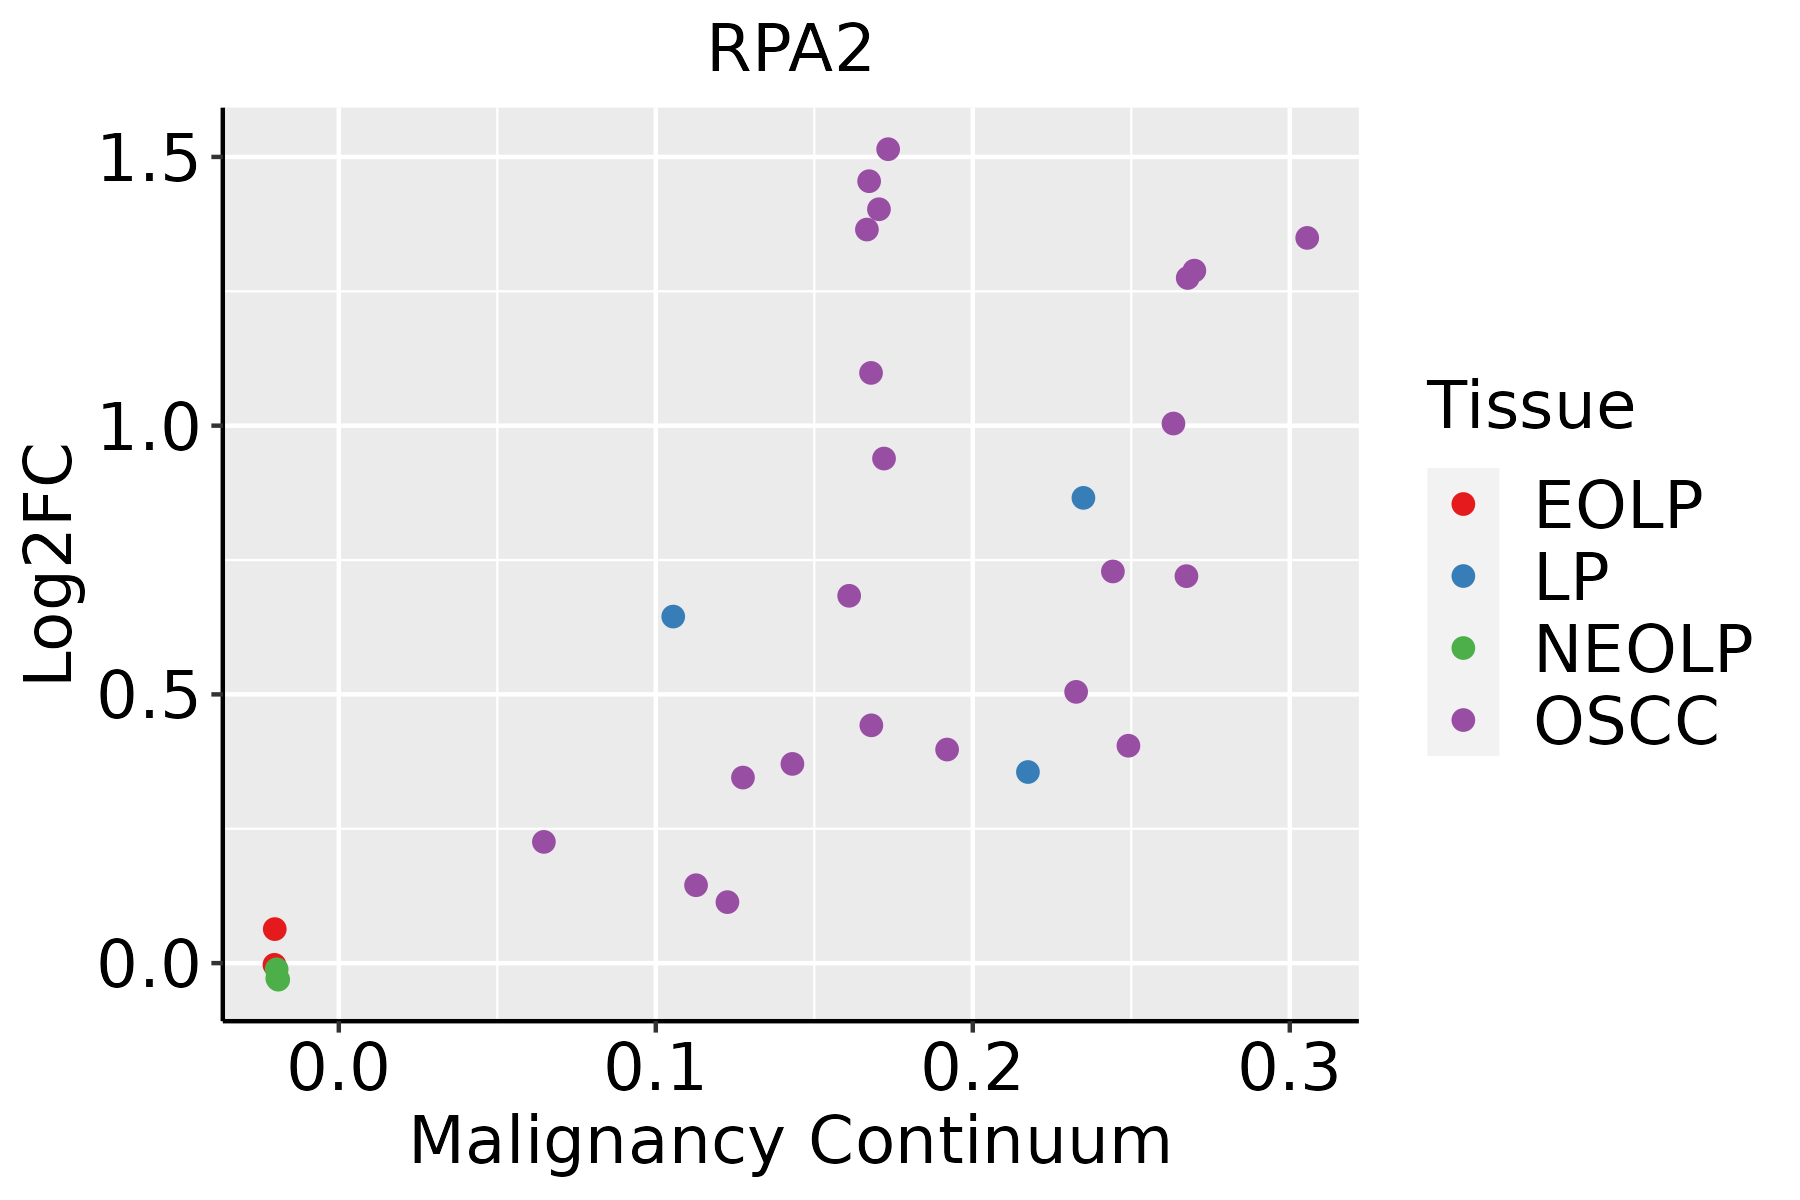 | EOLP: Erosive Oral lichen planus |
| LP: leukoplakia | ||
| NEOLP: Non-erosive oral lichen planus | ||
| OSCC: Oral squamous cell carcinoma | ||
| Skin | 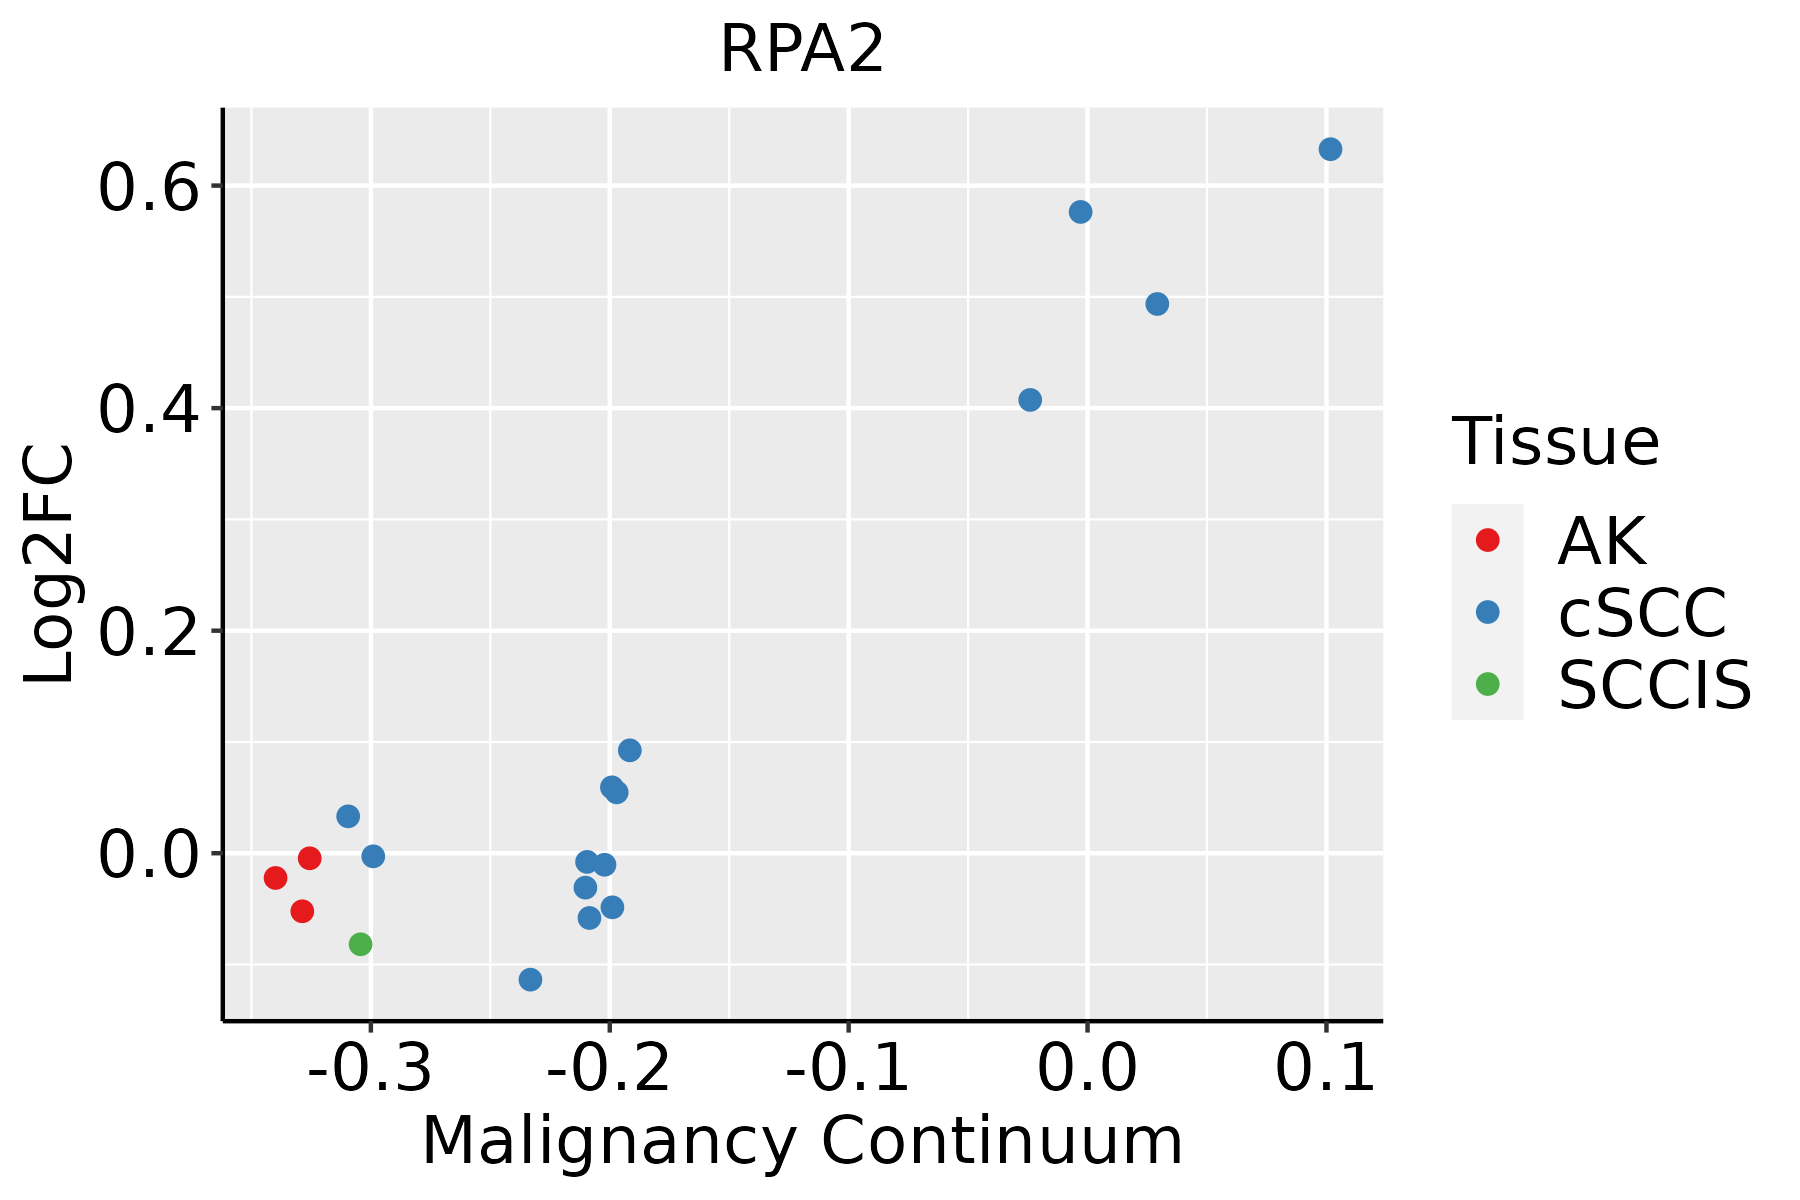 | AK: Actinic keratosis |
| cSCC: Cutaneous squamous cell carcinoma | ||
| SCCIS:squamous cell carcinoma in situ | ||
| Thyroid |  | ATC: Anaplastic thyroid cancer |
| HT: Hashimoto's thyroiditis | ||
| PTC: Papillary thyroid cancer |
| ∗log2FC in expression of this searched gene in stem-like cells from each diseased tissue sample relative to stem-like cells in normal samples in each tissue plotted against the malignancy continuum. Samples are colored based on if they are from different disease stage. |
Top |
Malignant transformation related pathway analysis |
| Find out the enriched GO biological processes and KEGG pathways involved in transition from healthy to precancer to cancer |
| Tissue | Disease Stage | Enriched GO biological Processes |
| Colorectum | AD |  |
| Colorectum | SER |  |
| Colorectum | MSS |  |
| Colorectum | MSI-H |  |
| Colorectum | FAP |  |
| ∗Top 15 enriched GO BP terms are showed in the bar plot of each disease state in each tissue. Each row represents a significant GO biological process which is colored according to the -log10(p.adjust). |
| Page: 1 2 3 4 5 6 7 8 9 |
| GO ID | Tissue | Disease Stage | Description | Gene Ratio | Bg Ratio | pvalue | p.adjust | Count |
| GO:0044774 | Liver | HCC | mitotic DNA integrity checkpoint | 49/7958 | 85/18723 | 3.44e-03 | 1.55e-02 | 49 |
| GO:00448191 | Liver | HCC | mitotic G1/S transition checkpoint | 21/7958 | 31/18723 | 4.01e-03 | 1.76e-02 | 21 |
| GO:0006284 | Liver | HCC | base-excision repair | 27/7958 | 43/18723 | 5.79e-03 | 2.40e-02 | 27 |
| GO:2000779 | Liver | HCC | regulation of double-strand break repair | 47/7958 | 85/18723 | 1.17e-02 | 4.28e-02 | 47 |
| GO:00447728 | Oral cavity | OSCC | mitotic cell cycle phase transition | 255/7305 | 424/18723 | 5.29e-19 | 6.98e-17 | 255 |
| GO:00073469 | Oral cavity | OSCC | regulation of mitotic cell cycle | 266/7305 | 457/18723 | 3.87e-17 | 3.41e-15 | 266 |
| GO:00062603 | Oral cavity | OSCC | DNA replication | 159/7305 | 260/18723 | 3.25e-13 | 1.59e-11 | 159 |
| GO:005105210 | Oral cavity | OSCC | regulation of DNA metabolic process | 207/7305 | 359/18723 | 4.45e-13 | 2.17e-11 | 207 |
| GO:19019905 | Oral cavity | OSCC | regulation of mitotic cell cycle phase transition | 173/7305 | 299/18723 | 2.49e-11 | 8.35e-10 | 173 |
| GO:200102017 | Oral cavity | OSCC | regulation of response to DNA damage stimulus | 131/7305 | 219/18723 | 3.21e-10 | 8.72e-09 | 131 |
| GO:000072316 | Oral cavity | OSCC | telomere maintenance | 85/7305 | 131/18723 | 1.72e-09 | 4.09e-08 | 85 |
| GO:19019875 | Oral cavity | OSCC | regulation of cell cycle phase transition | 209/7305 | 390/18723 | 2.79e-09 | 6.42e-08 | 209 |
| GO:00457864 | Oral cavity | OSCC | negative regulation of cell cycle | 206/7305 | 385/18723 | 4.28e-09 | 9.55e-08 | 206 |
| GO:00000753 | Oral cavity | OSCC | cell cycle checkpoint | 101/7305 | 169/18723 | 3.53e-08 | 6.68e-07 | 101 |
| GO:00070933 | Oral cavity | OSCC | mitotic cell cycle checkpoint | 81/7305 | 129/18723 | 3.75e-08 | 7.06e-07 | 81 |
| GO:00427707 | Oral cavity | OSCC | signal transduction in response to DNA damage | 102/7305 | 172/18723 | 5.27e-08 | 9.68e-07 | 102 |
| GO:00459304 | Oral cavity | OSCC | negative regulation of mitotic cell cycle | 132/7305 | 235/18723 | 6.51e-08 | 1.16e-06 | 132 |
| GO:19019914 | Oral cavity | OSCC | negative regulation of mitotic cell cycle phase transition | 104/7305 | 179/18723 | 1.67e-07 | 2.73e-06 | 104 |
| GO:00000826 | Oral cavity | OSCC | G1/S transition of mitotic cell cycle | 120/7305 | 214/18723 | 2.86e-07 | 4.40e-06 | 120 |
| GO:00345023 | Oral cavity | OSCC | protein localization to chromosome | 60/7305 | 92/18723 | 3.17e-07 | 4.79e-06 | 60 |
| Page: 1 2 3 4 5 6 7 8 9 10 11 12 |
| Pathway ID | Tissue | Disease Stage | Description | Gene Ratio | Bg Ratio | pvalue | p.adjust | qvalue | Count |
| hsa0342022 | Esophagus | ESCC | Nucleotide excision repair | 54/4205 | 63/8465 | 2.01e-09 | 2.17e-08 | 1.11e-08 | 54 |
| hsa030304 | Esophagus | ESCC | DNA replication | 32/4205 | 36/8465 | 7.71e-07 | 5.06e-06 | 2.59e-06 | 32 |
| hsa034304 | Esophagus | ESCC | Mismatch repair | 21/4205 | 23/8465 | 2.85e-05 | 1.35e-04 | 6.90e-05 | 21 |
| hsa0342032 | Esophagus | ESCC | Nucleotide excision repair | 54/4205 | 63/8465 | 2.01e-09 | 2.17e-08 | 1.11e-08 | 54 |
| hsa0303011 | Esophagus | ESCC | DNA replication | 32/4205 | 36/8465 | 7.71e-07 | 5.06e-06 | 2.59e-06 | 32 |
| hsa0343011 | Esophagus | ESCC | Mismatch repair | 21/4205 | 23/8465 | 2.85e-05 | 1.35e-04 | 6.90e-05 | 21 |
| hsa03420 | Liver | Cirrhotic | Nucleotide excision repair | 29/2530 | 63/8465 | 4.81e-03 | 1.74e-02 | 1.07e-02 | 29 |
| hsa034201 | Liver | Cirrhotic | Nucleotide excision repair | 29/2530 | 63/8465 | 4.81e-03 | 1.74e-02 | 1.07e-02 | 29 |
| hsa034202 | Liver | HCC | Nucleotide excision repair | 41/4020 | 63/8465 | 3.59e-03 | 1.12e-02 | 6.22e-03 | 41 |
| hsa034203 | Liver | HCC | Nucleotide excision repair | 41/4020 | 63/8465 | 3.59e-03 | 1.12e-02 | 6.22e-03 | 41 |
| hsa034204 | Oral cavity | OSCC | Nucleotide excision repair | 49/3704 | 63/8465 | 3.48e-08 | 2.91e-07 | 1.48e-07 | 49 |
| hsa03030 | Oral cavity | OSCC | DNA replication | 31/3704 | 36/8465 | 1.70e-07 | 1.19e-06 | 6.03e-07 | 31 |
| hsa03430 | Oral cavity | OSCC | Mismatch repair | 19/3704 | 23/8465 | 1.55e-04 | 5.34e-04 | 2.72e-04 | 19 |
| hsa0342011 | Oral cavity | OSCC | Nucleotide excision repair | 49/3704 | 63/8465 | 3.48e-08 | 2.91e-07 | 1.48e-07 | 49 |
| hsa030301 | Oral cavity | OSCC | DNA replication | 31/3704 | 36/8465 | 1.70e-07 | 1.19e-06 | 6.03e-07 | 31 |
| hsa034301 | Oral cavity | OSCC | Mismatch repair | 19/3704 | 23/8465 | 1.55e-04 | 5.34e-04 | 2.72e-04 | 19 |
| Page: 1 |
Top |
Cell-cell communication analysis |
| Identification of potential cell-cell interactions between two cell types and their ligand-receptor pairs for different disease states |
| Ligand | Receptor | LRpair | Pathway | Tissue | Disease Stage |
| Page: 1 |
Top |
Single-cell gene regulatory network inference analysis |
| Find out the significant the regulons (TFs) and the target genes of each regulon across cell types for different disease states |
| TF | Cell Type | Tissue | Disease Stage | Target Gene | RSS | Regulon Activity |
| ∗The dot plots of a searched regulon are shown for all cell subpopulations in each disease state of each tissue based on the regulon specific score inferred using pySCENIC and by calculating the average expression. |
| Page: 1 |
Top |
Somatic mutation of malignant transformation related genes |
| Annotation of somatic variants for genes involved in malignant transformation |
| Hugo Symbol | Variant Class | Variant Classification | dbSNP RS | HGVSc | HGVSp | HGVSp Short | SWISSPROT | BIOTYPE | SIFT | PolyPhen | Tumor Sample Barcode | Tissue | Histology | Sex | Age | Stage | Therapy Types | Drugs | Outcome |
| RPA2 | SNV | Missense_Mutation | c.279N>T | p.Lys93Asn | p.K93N | P15927 | protein_coding | deleterious(0.01) | benign(0.44) | TCGA-A2-A25B-01 | Breast | breast invasive carcinoma | Female | <65 | I/II | Chemotherapy | taxotere | PD | |
| RPA2 | SNV | Missense_Mutation | novel | c.215N>A | p.Phe72Tyr | p.F72Y | P15927 | protein_coding | deleterious(0.01) | possibly_damaging(0.906) | TCGA-Z7-A8R6-01 | Breast | breast invasive carcinoma | Female | <65 | I/II | Chemotherapy | taxol | CR |
| RPA2 | SNV | Missense_Mutation | rs755345876 | c.92N>T | p.Ser31Phe | p.S31F | P15927 | protein_coding | deleterious(0) | possibly_damaging(0.907) | TCGA-AA-3984-01 | Colorectum | colon adenocarcinoma | Female | <65 | I/II | Unknown | Unknown | SD |
| RPA2 | SNV | Missense_Mutation | c.331G>T | p.Asp111Tyr | p.D111Y | P15927 | protein_coding | deleterious(0) | probably_damaging(0.942) | TCGA-G4-6311-01 | Colorectum | colon adenocarcinoma | Male | >=65 | III/IV | Chemotherapy | oxaliplatin | SD | |
| RPA2 | SNV | Missense_Mutation | novel | c.307N>T | p.Asp103Tyr | p.D103Y | P15927 | protein_coding | deleterious(0.03) | probably_damaging(0.999) | TCGA-A5-A0G2-01 | Endometrium | uterine corpus endometrioid carcinoma | Female | <65 | III/IV | Unknown | Unknown | SD |
| RPA2 | SNV | Missense_Mutation | novel | c.758C>A | p.Ala253Asp | p.A253D | P15927 | protein_coding | deleterious(0) | benign(0.319) | TCGA-AJ-A3EK-01 | Endometrium | uterine corpus endometrioid carcinoma | Female | <65 | I/II | Chemotherapy | carboplatin | CR |
| RPA2 | SNV | Missense_Mutation | novel | c.139T>G | p.Ser47Ala | p.S47A | P15927 | protein_coding | tolerated(0.19) | benign(0.022) | TCGA-AP-A1E0-01 | Endometrium | uterine corpus endometrioid carcinoma | Female | <65 | III/IV | Chemotherapy | paclitaxel | SD |
| RPA2 | SNV | Missense_Mutation | novel | c.276G>T | p.Glu92Asp | p.E92D | P15927 | protein_coding | tolerated(0.17) | benign(0.003) | TCGA-AX-A2HC-01 | Endometrium | uterine corpus endometrioid carcinoma | Female | <65 | III/IV | Chemotherapy | paclitaxel | PD |
| RPA2 | SNV | Missense_Mutation | c.568N>T | p.Pro190Ser | p.P190S | P15927 | protein_coding | tolerated(0.37) | benign(0.007) | TCGA-B5-A0K6-01 | Endometrium | uterine corpus endometrioid carcinoma | Female | <65 | I/II | Unknown | Unknown | SD | |
| RPA2 | SNV | Missense_Mutation | c.624G>A | p.Met208Ile | p.M208I | P15927 | protein_coding | tolerated(0.48) | benign(0.001) | TCGA-B5-A11E-01 | Endometrium | uterine corpus endometrioid carcinoma | Female | <65 | I/II | Unknown | Unknown | SD |
| Page: 1 2 3 |
Top |
Related drugs of malignant transformation related genes |
| Identification of chemicals and drugs interact with genes involved in malignant transfromation |
| (DGIdb 4.0) |
| Entrez ID | Symbol | Category | Interaction Types | Drug Claim Name | Drug Name | PMIDs |
| Page: 1 |

Copyright 2023-Present -The University of Texas Health Science Center at Houston |