
|
|||||
|
 | |
| |
| |
| |
| |
| |
|
Gene: RNF26 |
Gene summary for RNF26 |
| Gene information | Species | Human | Gene symbol | RNF26 | Gene ID | 79102 |
| Gene name | ring finger protein 26 | |
| Gene Alias | RNF26 | |
| Cytomap | 11q23.3 | |
| Gene Type | protein-coding | GO ID | GO:0000209 | UniProtAcc | Q9BY78 |
Top |
Malignant transformation analysis |
| Identification of the aberrant gene expression in precancerous and cancerous lesions by comparing the gene expression of stem-like cells in diseased tissues with normal stem cells |
| Entrez ID | Symbol | Replicates | Species | Organ | Tissue | Adj P-value | Log2FC | Malignancy |
| 79102 | RNF26 | LZE4T | Human | Esophagus | ESCC | 4.10e-05 | 9.86e-02 | 0.0811 |
| 79102 | RNF26 | LZE8T | Human | Esophagus | ESCC | 1.35e-07 | 1.46e-01 | 0.067 |
| 79102 | RNF26 | LZE20T | Human | Esophagus | ESCC | 1.94e-02 | 1.86e-01 | 0.0662 |
| 79102 | RNF26 | LZE22D1 | Human | Esophagus | HGIN | 8.19e-03 | 1.68e-01 | 0.0595 |
| 79102 | RNF26 | LZE22T | Human | Esophagus | ESCC | 4.56e-13 | 1.23e+00 | 0.068 |
| 79102 | RNF26 | LZE24T | Human | Esophagus | ESCC | 9.63e-19 | 5.12e-01 | 0.0596 |
| 79102 | RNF26 | P1T-E | Human | Esophagus | ESCC | 1.43e-04 | 1.52e-01 | 0.0875 |
| 79102 | RNF26 | P2T-E | Human | Esophagus | ESCC | 4.77e-13 | 2.94e-01 | 0.1177 |
| 79102 | RNF26 | P4T-E | Human | Esophagus | ESCC | 2.40e-22 | 6.49e-01 | 0.1323 |
| 79102 | RNF26 | P5T-E | Human | Esophagus | ESCC | 7.98e-13 | 2.55e-01 | 0.1327 |
| 79102 | RNF26 | P9T-E | Human | Esophagus | ESCC | 7.20e-10 | 2.20e-01 | 0.1131 |
| 79102 | RNF26 | P10T-E | Human | Esophagus | ESCC | 6.56e-15 | 2.16e-01 | 0.116 |
| 79102 | RNF26 | P11T-E | Human | Esophagus | ESCC | 3.93e-15 | 4.94e-01 | 0.1426 |
| 79102 | RNF26 | P12T-E | Human | Esophagus | ESCC | 2.13e-27 | 4.47e-01 | 0.1122 |
| 79102 | RNF26 | P15T-E | Human | Esophagus | ESCC | 3.50e-08 | 2.62e-01 | 0.1149 |
| 79102 | RNF26 | P16T-E | Human | Esophagus | ESCC | 6.48e-20 | 3.18e-01 | 0.1153 |
| 79102 | RNF26 | P17T-E | Human | Esophagus | ESCC | 3.52e-05 | 3.11e-01 | 0.1278 |
| 79102 | RNF26 | P19T-E | Human | Esophagus | ESCC | 7.97e-05 | 4.30e-01 | 0.1662 |
| 79102 | RNF26 | P20T-E | Human | Esophagus | ESCC | 1.07e-18 | 1.51e-01 | 0.1124 |
| 79102 | RNF26 | P21T-E | Human | Esophagus | ESCC | 3.41e-36 | 6.76e-01 | 0.1617 |
| Page: 1 2 3 4 5 |
| Tissue | Expression Dynamics | Abbreviation |
| Esophagus | 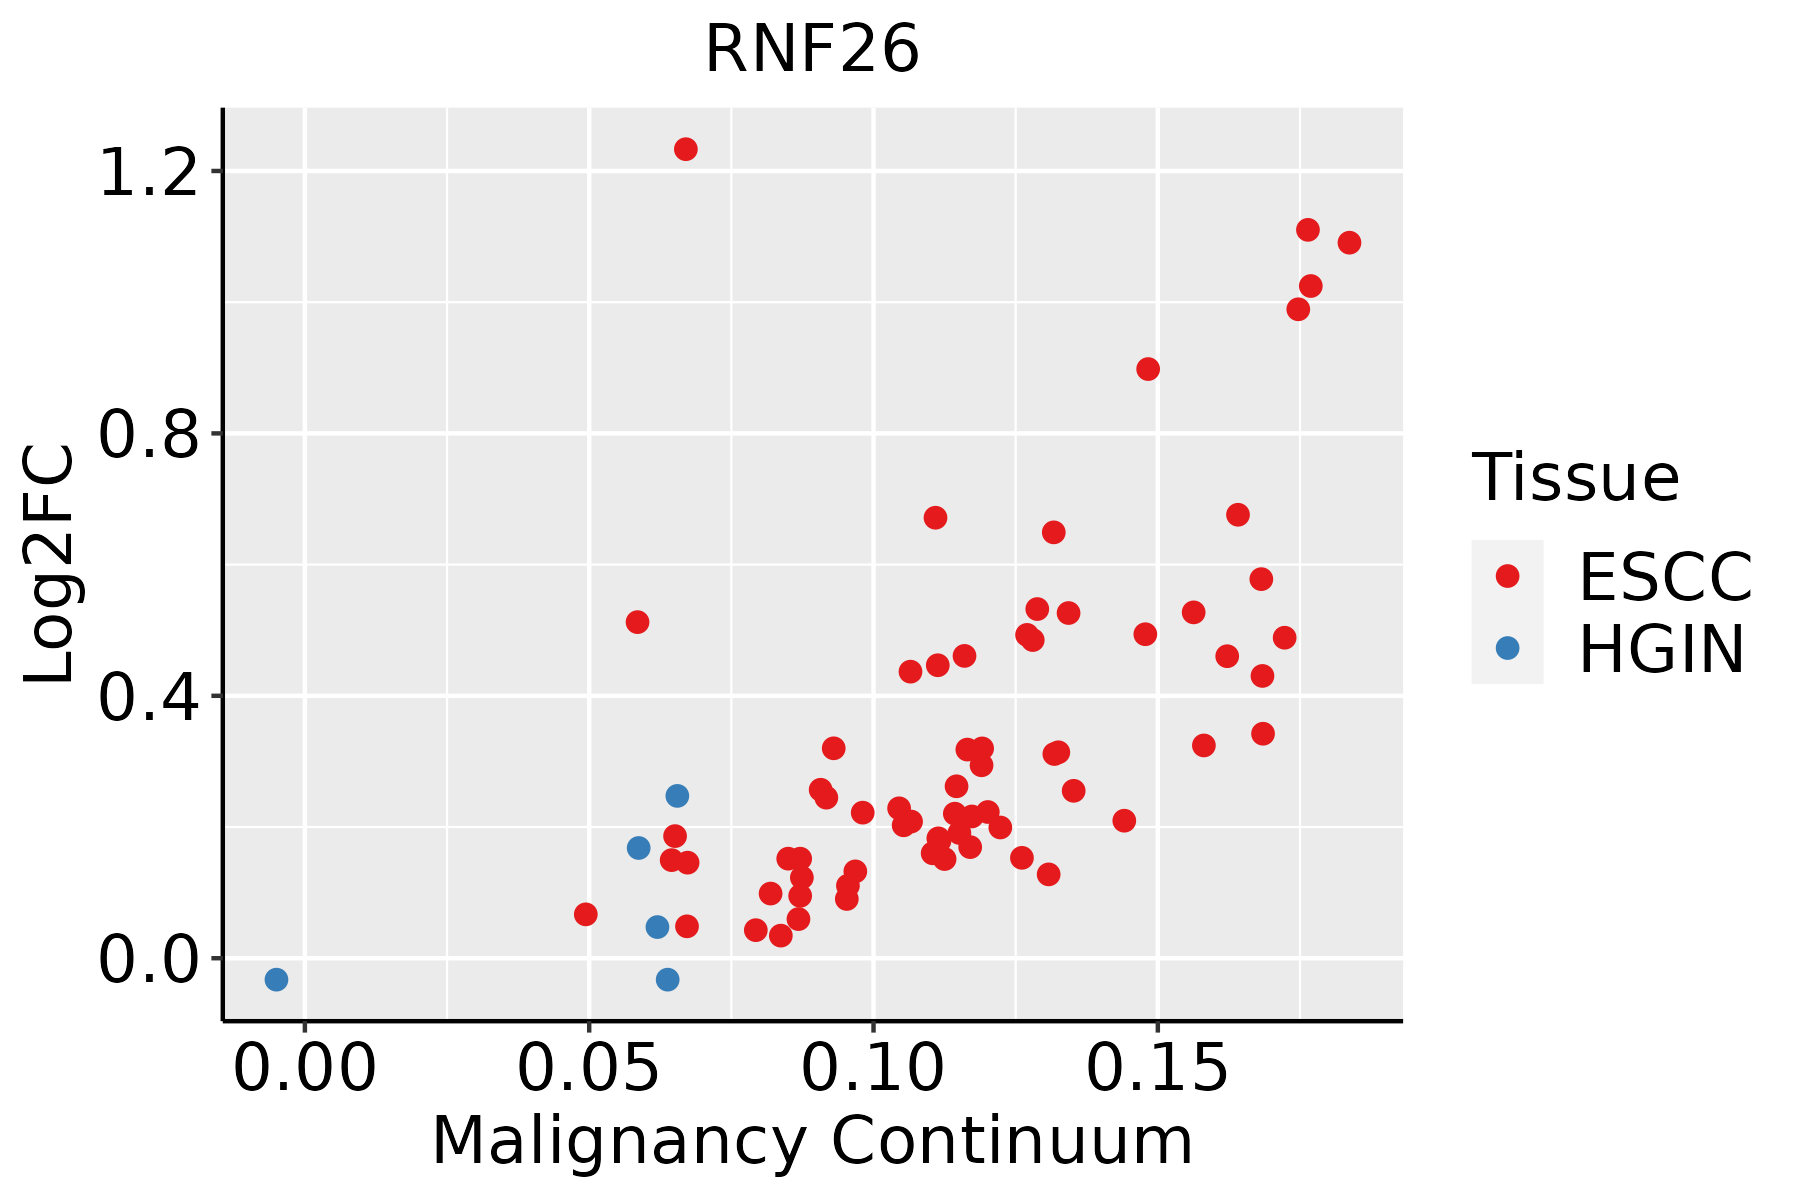 | ESCC: Esophageal squamous cell carcinoma |
| HGIN: High-grade intraepithelial neoplasias | ||
| LGIN: Low-grade intraepithelial neoplasias | ||
| Liver | 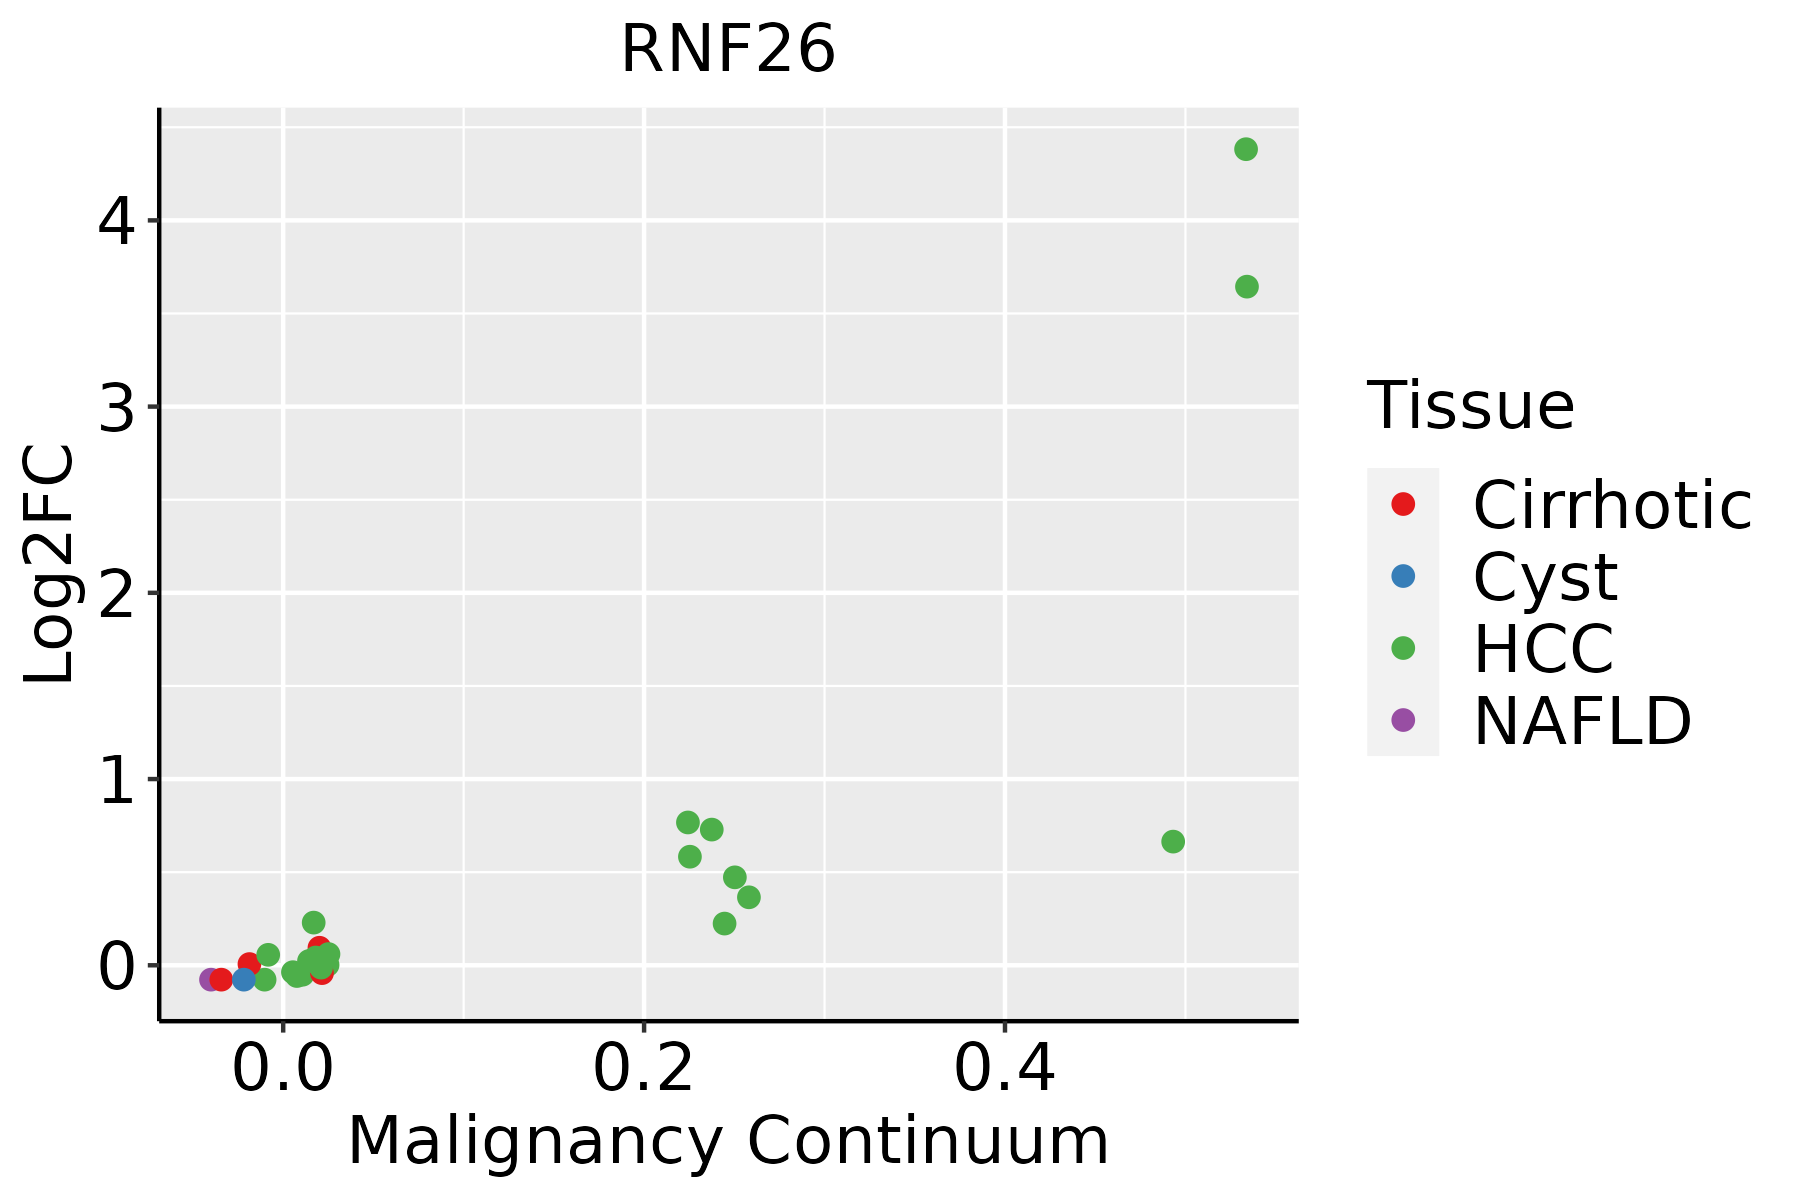 | HCC: Hepatocellular carcinoma |
| NAFLD: Non-alcoholic fatty liver disease | ||
| Oral Cavity | 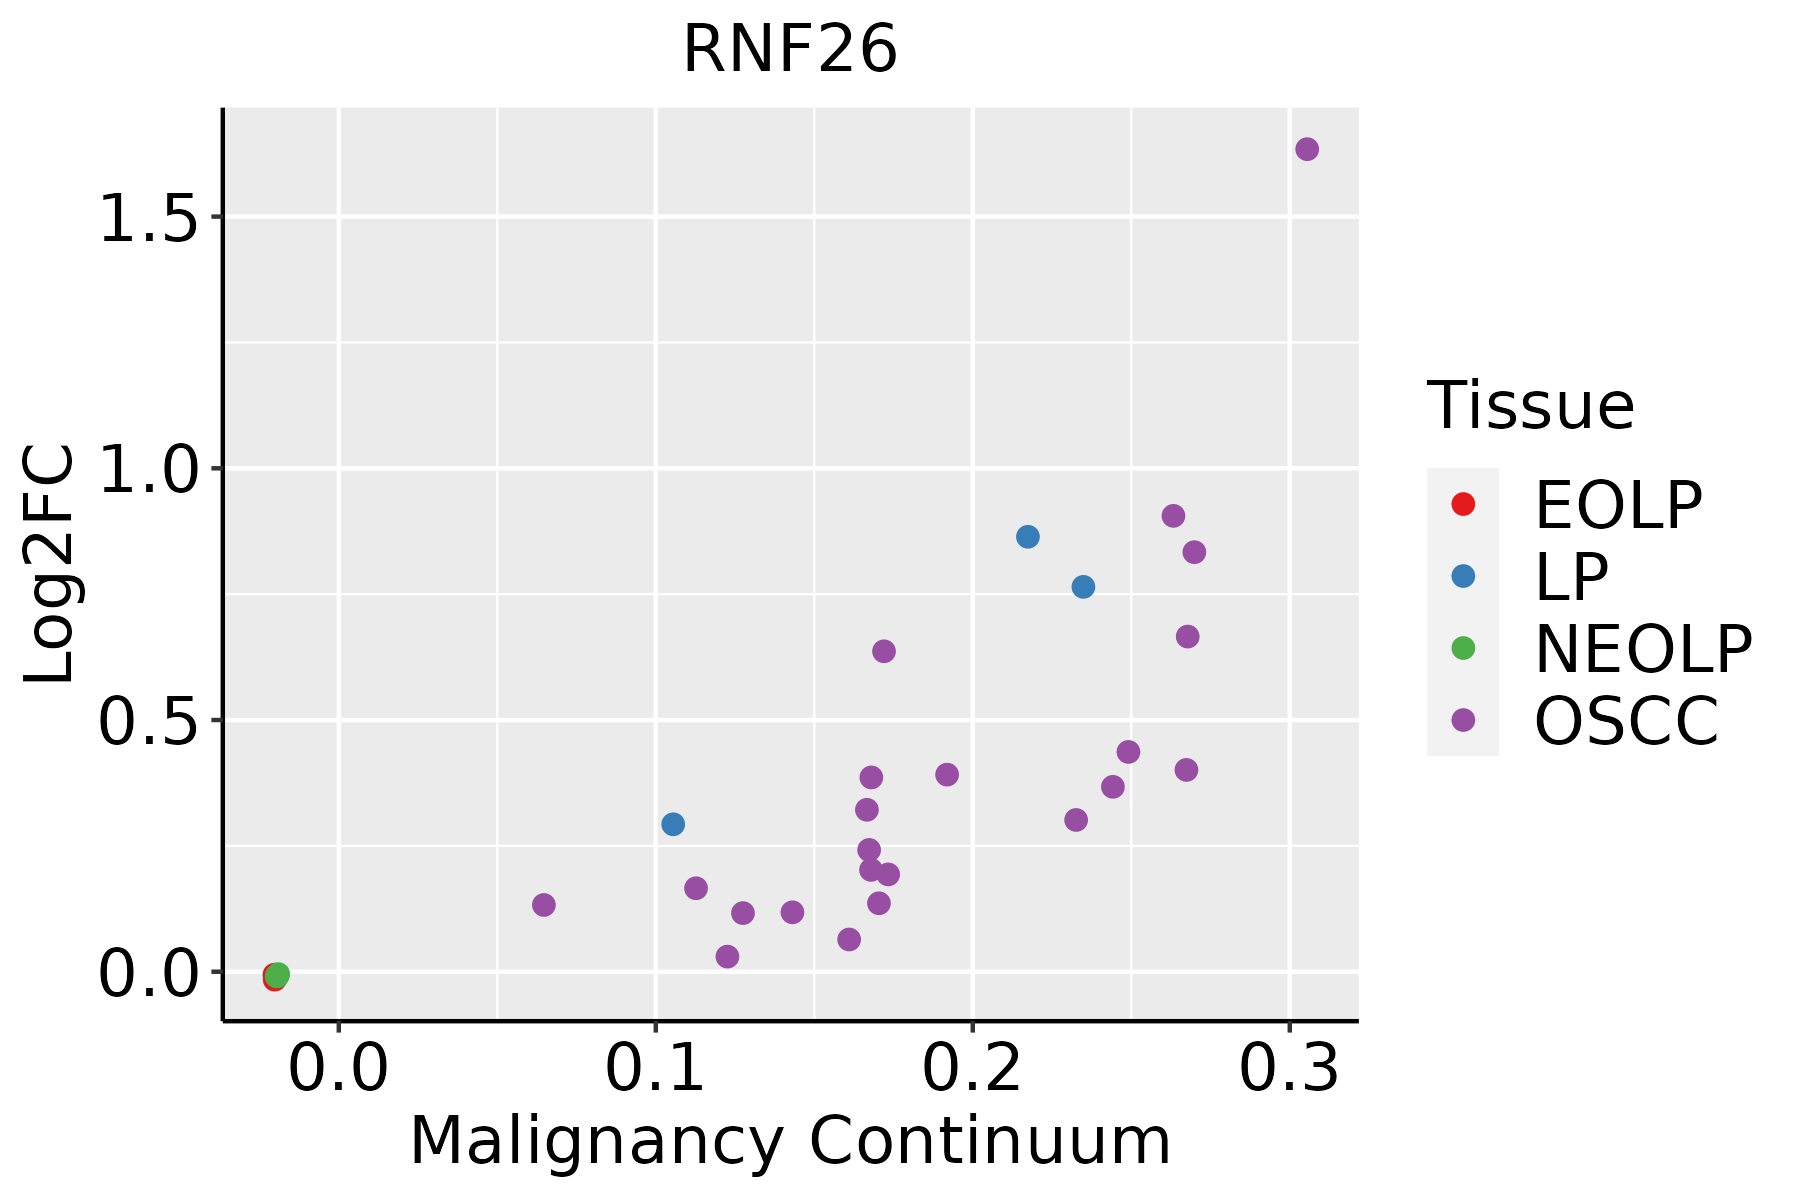 | EOLP: Erosive Oral lichen planus |
| LP: leukoplakia | ||
| NEOLP: Non-erosive oral lichen planus | ||
| OSCC: Oral squamous cell carcinoma | ||
| Skin |  | AK: Actinic keratosis |
| cSCC: Cutaneous squamous cell carcinoma | ||
| SCCIS:squamous cell carcinoma in situ |
| ∗log2FC in expression of this searched gene in stem-like cells from each diseased tissue sample relative to stem-like cells in normal samples in each tissue plotted against the malignancy continuum. Samples are colored based on if they are from different disease stage. |
Top |
Malignant transformation related pathway analysis |
| Find out the enriched GO biological processes and KEGG pathways involved in transition from healthy to precancer to cancer |
| Tissue | Disease Stage | Enriched GO biological Processes |
| Colorectum | AD |  |
| Colorectum | SER |  |
| Colorectum | MSS |  |
| Colorectum | MSI-H |  |
| Colorectum | FAP |  |
| ∗Top 15 enriched GO BP terms are showed in the bar plot of each disease state in each tissue. Each row represents a significant GO biological process which is colored according to the -log10(p.adjust). |
| Page: 1 2 3 4 5 6 7 8 9 |
| GO ID | Tissue | Disease Stage | Description | Gene Ratio | Bg Ratio | pvalue | p.adjust | Count |
| GO:00028326 | Skin | cSCC | negative regulation of response to biotic stimulus | 43/4864 | 108/18723 | 1.12e-03 | 7.36e-03 | 43 |
| GO:00324795 | Skin | cSCC | regulation of type I interferon production | 36/4864 | 95/18723 | 6.99e-03 | 3.38e-02 | 36 |
| GO:00326065 | Skin | cSCC | type I interferon production | 36/4864 | 95/18723 | 6.99e-03 | 3.38e-02 | 36 |
| Page: 1 2 3 4 5 |
| Pathway ID | Tissue | Disease Stage | Description | Gene Ratio | Bg Ratio | pvalue | p.adjust | qvalue | Count |
| Page: 1 |
Top |
Cell-cell communication analysis |
| Identification of potential cell-cell interactions between two cell types and their ligand-receptor pairs for different disease states |
| Ligand | Receptor | LRpair | Pathway | Tissue | Disease Stage |
| Page: 1 |
Top |
Single-cell gene regulatory network inference analysis |
| Find out the significant the regulons (TFs) and the target genes of each regulon across cell types for different disease states |
| TF | Cell Type | Tissue | Disease Stage | Target Gene | RSS | Regulon Activity |
| ∗The dot plots of a searched regulon are shown for all cell subpopulations in each disease state of each tissue based on the regulon specific score inferred using pySCENIC and by calculating the average expression. |
| Page: 1 |
Top |
Somatic mutation of malignant transformation related genes |
| Annotation of somatic variants for genes involved in malignant transformation |
| Hugo Symbol | Variant Class | Variant Classification | dbSNP RS | HGVSc | HGVSp | HGVSp Short | SWISSPROT | BIOTYPE | SIFT | PolyPhen | Tumor Sample Barcode | Tissue | Histology | Sex | Age | Stage | Therapy Types | Drugs | Outcome |
| RNF26 | insertion | In_Frame_Ins | novel | c.207_208insACTACATCTTCCATTAGAAAATACTGCAAGGATAGG | p.Ile69_Glu70insThrThrSerSerIleArgLysTyrCysLysAspArg | p.I69_E70insTTSSIRKYCKDR | Q9BY78 | protein_coding | TCGA-AN-A0FN-01 | Breast | breast invasive carcinoma | Female | <65 | I/II | Unknown | Unknown | SD | ||
| RNF26 | insertion | In_Frame_Ins | novel | c.836_837insGCCCCTGACAGGTGT | p.Arg279_Leu280insProLeuThrGlyVal | p.R279_L280insPLTGV | Q9BY78 | protein_coding | TCGA-BH-A0E1-01 | Breast | breast invasive carcinoma | Female | <65 | I/II | Chemotherapy | cytoxan | SD | ||
| RNF26 | SNV | Missense_Mutation | c.982N>T | p.Leu328Phe | p.L328F | Q9BY78 | protein_coding | tolerated(0.45) | benign(0.355) | TCGA-EA-A44S-01 | Cervix | cervical & endocervical cancer | Female | <65 | III/IV | Chemotherapy | carboplatin | SD | |
| RNF26 | SNV | Missense_Mutation | c.1289N>C | p.Asn430Thr | p.N430T | Q9BY78 | protein_coding | deleterious(0) | possibly_damaging(0.867) | TCGA-FU-A3HZ-01 | Cervix | cervical & endocervical cancer | Female | <65 | I/II | Chemotherapy | cisplatin | CR | |
| RNF26 | SNV | Missense_Mutation | rs752881562 | c.391N>T | p.Arg131Cys | p.R131C | Q9BY78 | protein_coding | deleterious(0) | possibly_damaging(0.886) | TCGA-AD-5900-01 | Colorectum | colon adenocarcinoma | Male | >=65 | I/II | Unknown | Unknown | SD |
| RNF26 | SNV | Missense_Mutation | rs867631795 | c.217N>A | p.Val73Ile | p.V73I | Q9BY78 | protein_coding | tolerated(0.26) | benign(0) | TCGA-AD-6895-01 | Colorectum | colon adenocarcinoma | Male | >=65 | III/IV | Unknown | Unknown | SD |
| RNF26 | SNV | Missense_Mutation | c.175C>T | p.Arg59Cys | p.R59C | Q9BY78 | protein_coding | deleterious(0.03) | possibly_damaging(0.854) | TCGA-QG-A5Z1-01 | Colorectum | colon adenocarcinoma | Male | >=65 | III/IV | Unspecific | Complete Response | ||
| RNF26 | SNV | Missense_Mutation | rs771435796 | c.652N>T | p.Arg218Cys | p.R218C | Q9BY78 | protein_coding | deleterious(0.04) | possibly_damaging(0.549) | TCGA-WS-AB45-01 | Colorectum | colon adenocarcinoma | Female | <65 | I/II | Unknown | Unknown | SD |
| RNF26 | SNV | Missense_Mutation | rs775259101 | c.310G>A | p.Ala104Thr | p.A104T | Q9BY78 | protein_coding | tolerated(0.23) | benign(0.145) | TCGA-EI-6917-01 | Colorectum | rectum adenocarcinoma | Male | <65 | III/IV | Chemotherapy | 5fluorouracil+oxaciplatina+l-folinian | SD |
| RNF26 | SNV | Missense_Mutation | rs201098751 | c.472G>A | p.Gly158Ser | p.G158S | Q9BY78 | protein_coding | tolerated(0.07) | benign(0.069) | TCGA-A5-A0G1-01 | Endometrium | uterine corpus endometrioid carcinoma | Female | >=65 | I/II | Unknown | Unknown | SD |
| Page: 1 2 3 4 |
Top |
Related drugs of malignant transformation related genes |
| Identification of chemicals and drugs interact with genes involved in malignant transfromation |
| (DGIdb 4.0) |
| Entrez ID | Symbol | Category | Interaction Types | Drug Claim Name | Drug Name | PMIDs |
| Page: 1 |

Copyright 2023-Present -The University of Texas Health Science Center at Houston |