| Tissue | Expression Dynamics | Abbreviation |
| Esophagus | 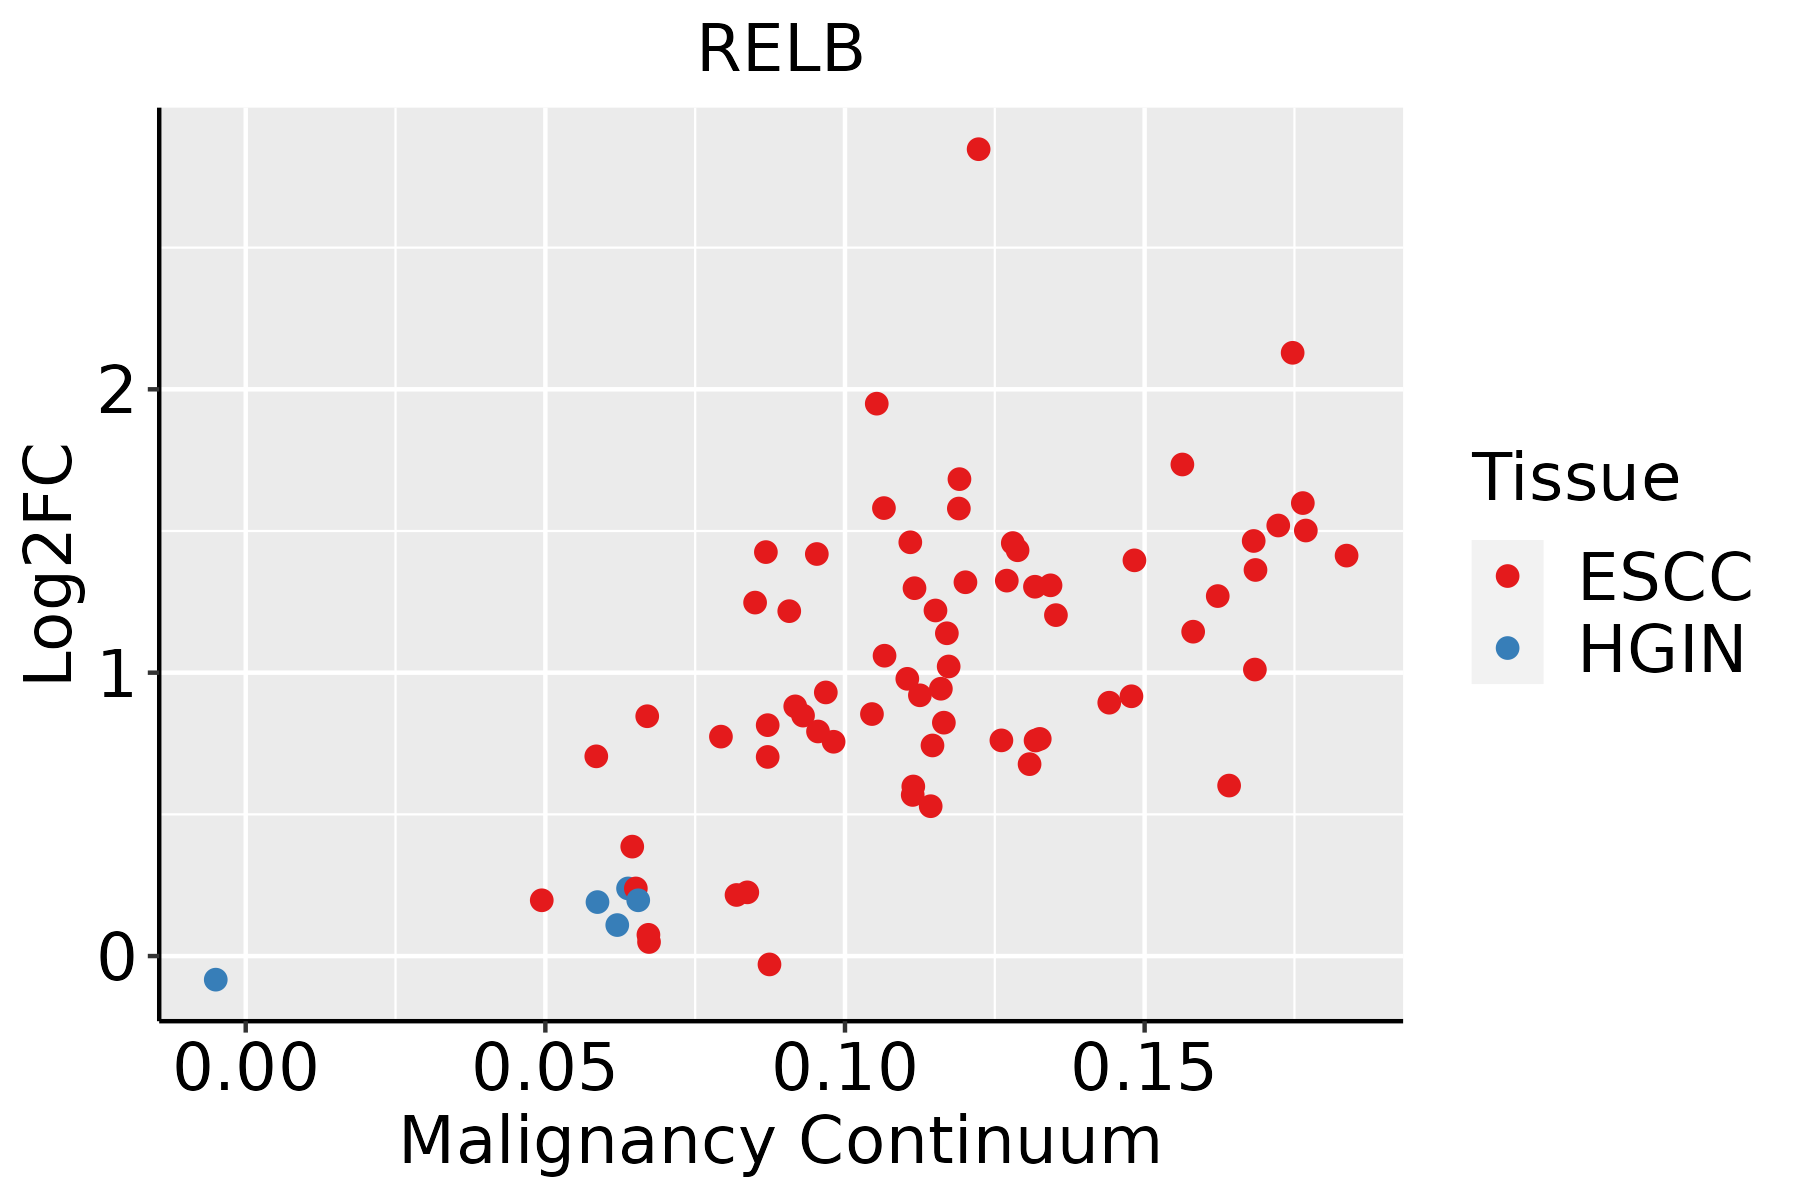 | ESCC: Esophageal squamous cell carcinoma |
| HGIN: High-grade intraepithelial neoplasias |
| LGIN: Low-grade intraepithelial neoplasias |
| Liver |  | HCC: Hepatocellular carcinoma |
| NAFLD: Non-alcoholic fatty liver disease |
| Lung | 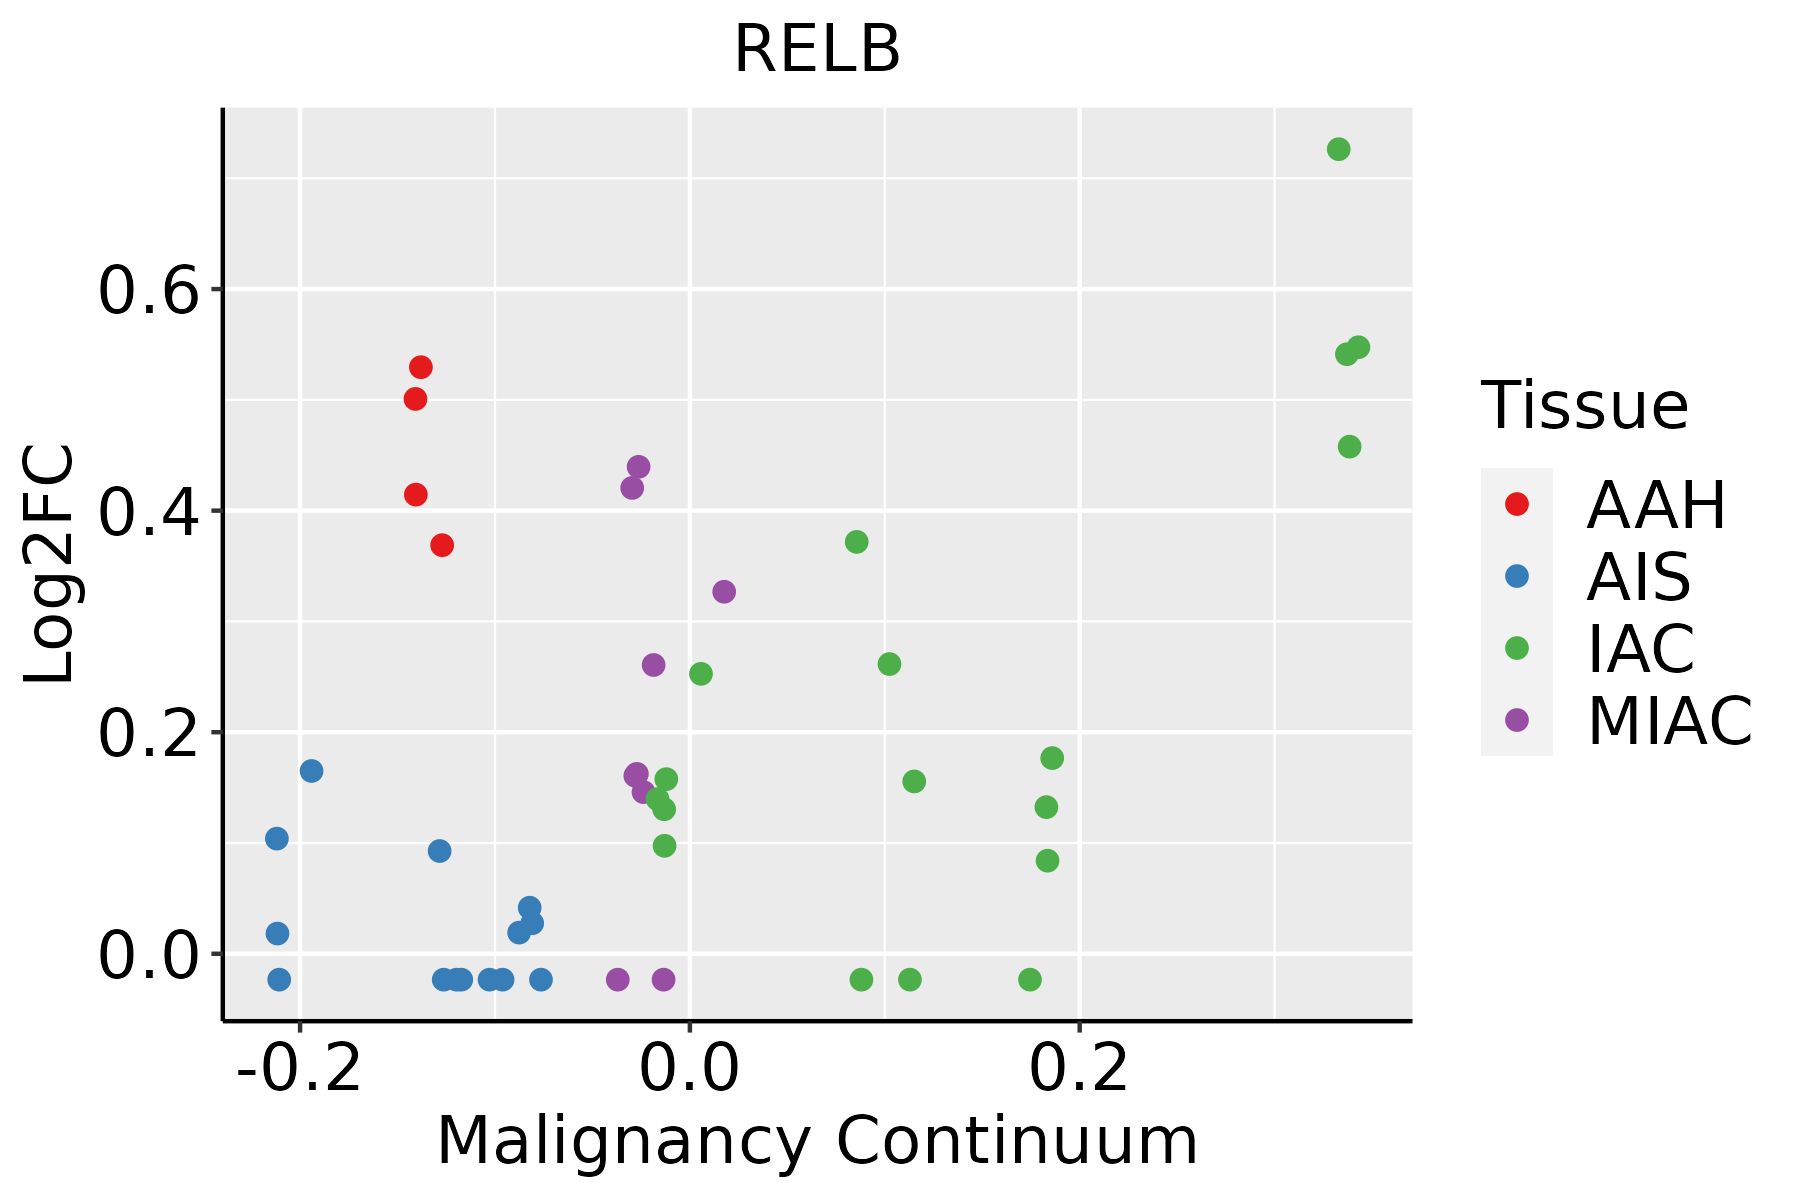 | AAH: Atypical adenomatous hyperplasia |
| AIS: Adenocarcinoma in situ |
| IAC: Invasive lung adenocarcinoma |
| MIA: Minimally invasive adenocarcinoma |
| Oral Cavity |  | EOLP: Erosive Oral lichen planus |
| LP: leukoplakia |
| NEOLP: Non-erosive oral lichen planus |
| OSCC: Oral squamous cell carcinoma |
| Thyroid | 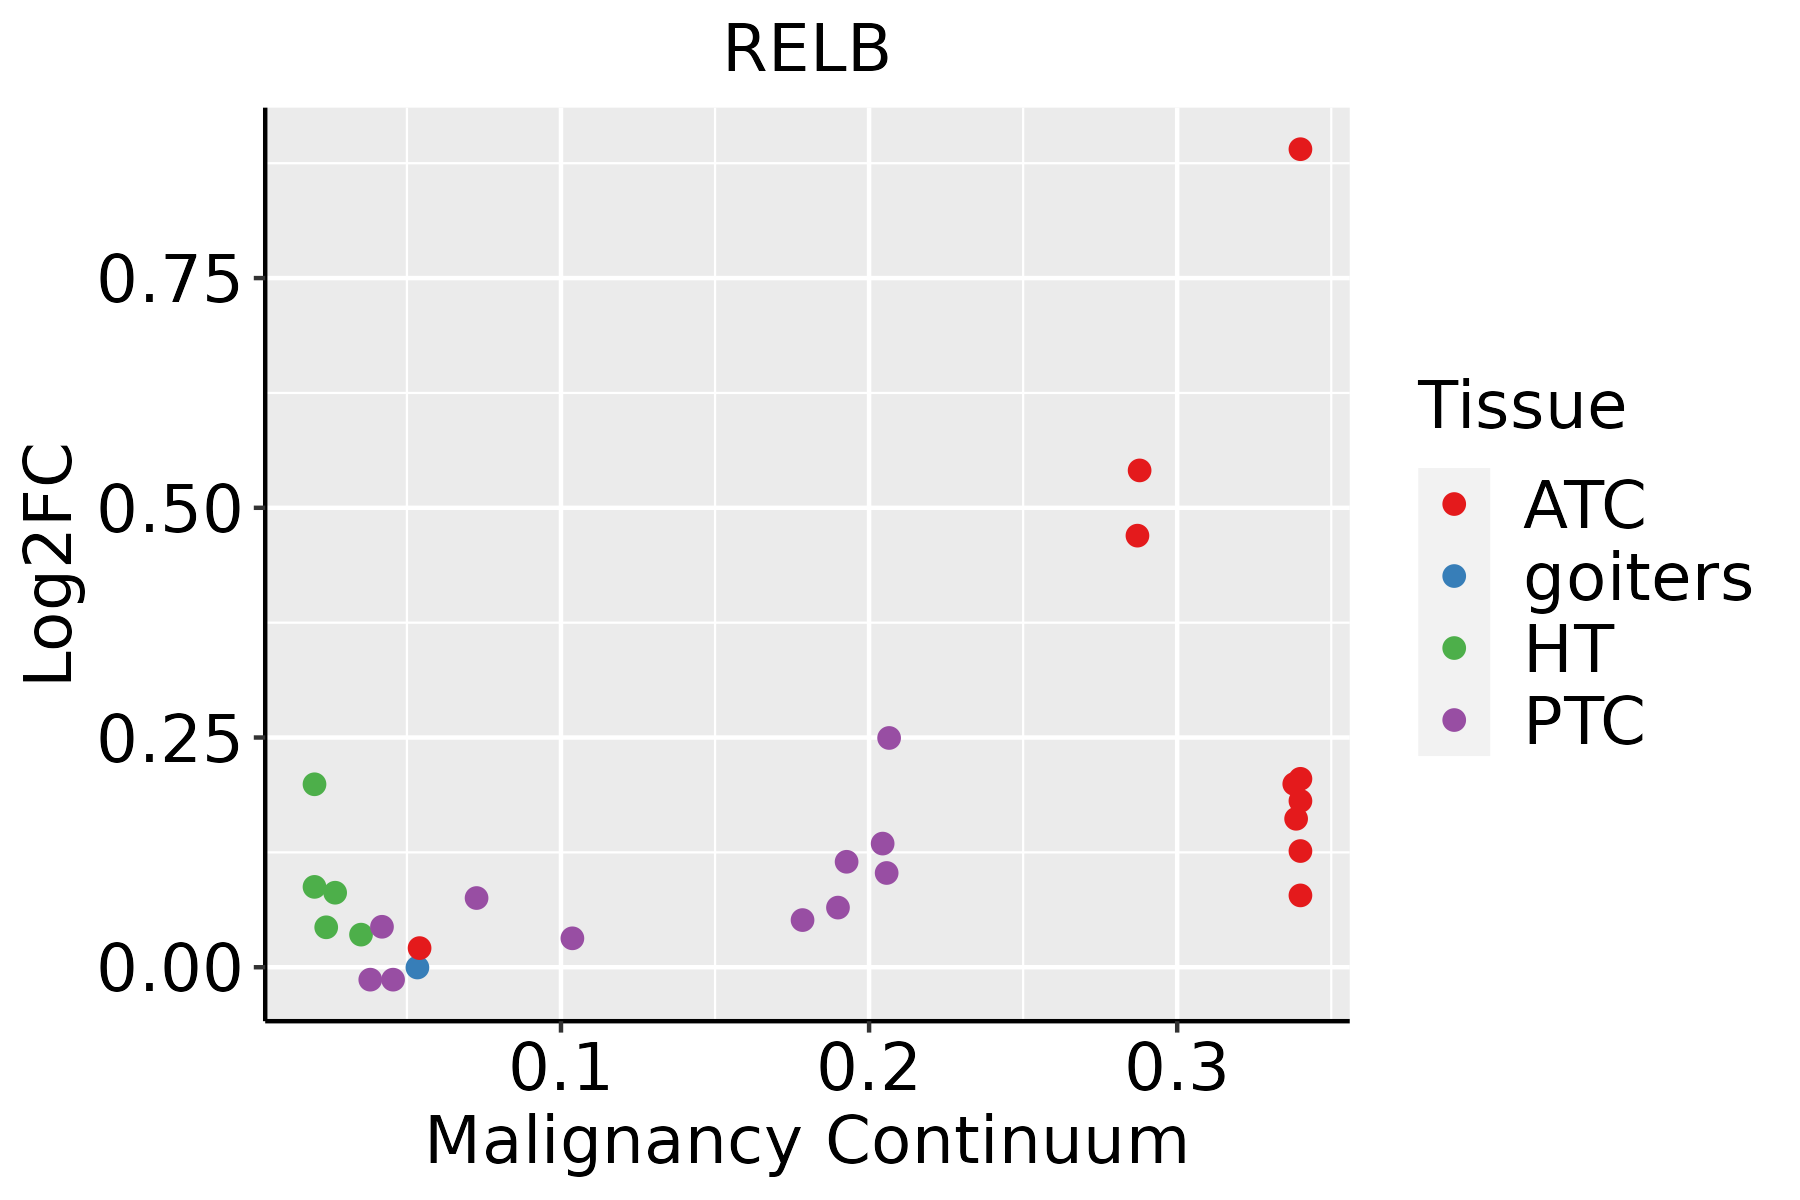 | ATC: Anaplastic thyroid cancer |
| HT: Hashimoto's thyroiditis |
| PTC: Papillary thyroid cancer |
| GO ID | Tissue | Disease Stage | Description | Gene Ratio | Bg Ratio | pvalue | p.adjust | Count |
| GO:00069706 | Oral cavity | OSCC | response to osmotic stress | 50/7305 | 84/18723 | 1.11e-04 | 8.15e-04 | 50 |
| GO:00380614 | Oral cavity | OSCC | NIK/NF-kappaB signaling | 78/7305 | 143/18723 | 1.14e-04 | 8.35e-04 | 78 |
| GO:00300983 | Oral cavity | OSCC | lymphocyte differentiation | 179/7305 | 374/18723 | 2.74e-04 | 1.74e-03 | 179 |
| GO:00324793 | Oral cavity | OSCC | regulation of type I interferon production | 54/7305 | 95/18723 | 3.17e-04 | 1.97e-03 | 54 |
| GO:00326063 | Oral cavity | OSCC | type I interferon production | 54/7305 | 95/18723 | 3.17e-04 | 1.97e-03 | 54 |
| GO:00302175 | Oral cavity | OSCC | T cell differentiation | 126/7305 | 257/18723 | 6.51e-04 | 3.66e-03 | 126 |
| GO:00329229 | Oral cavity | OSCC | circadian regulation of gene expression | 40/7305 | 68/18723 | 7.28e-04 | 3.98e-03 | 40 |
| GO:00714706 | Oral cavity | OSCC | cellular response to osmotic stress | 26/7305 | 41/18723 | 1.34e-03 | 6.62e-03 | 26 |
| GO:004211023 | Oral cavity | EOLP | T cell activation | 111/2218 | 487/18723 | 4.67e-12 | 8.17e-10 | 111 |
| GO:003009926 | Oral cavity | EOLP | myeloid cell differentiation | 91/2218 | 381/18723 | 2.87e-11 | 4.15e-09 | 91 |
| GO:001988224 | Oral cavity | EOLP | antigen processing and presentation | 36/2218 | 106/18723 | 1.96e-09 | 1.26e-07 | 36 |
| GO:004851117 | Oral cavity | EOLP | rhythmic process | 69/2218 | 298/18723 | 2.68e-08 | 1.11e-06 | 69 |
| GO:190313114 | Oral cavity | EOLP | mononuclear cell differentiation | 88/2218 | 426/18723 | 1.07e-07 | 3.61e-06 | 88 |
| GO:00466314 | Oral cavity | EOLP | alpha-beta T cell activation | 41/2218 | 156/18723 | 5.51e-07 | 1.47e-05 | 41 |
| GO:000724924 | Oral cavity | EOLP | I-kappaB kinase/NF-kappaB signaling | 62/2218 | 281/18723 | 8.00e-07 | 2.02e-05 | 62 |
| GO:003009812 | Oral cavity | EOLP | lymphocyte differentiation | 76/2218 | 374/18723 | 1.50e-06 | 3.55e-05 | 76 |
| GO:000257323 | Oral cavity | EOLP | myeloid leukocyte differentiation | 48/2218 | 208/18723 | 3.71e-06 | 7.88e-05 | 48 |
| GO:00466321 | Oral cavity | EOLP | alpha-beta T cell differentiation | 31/2218 | 112/18723 | 4.02e-06 | 8.49e-05 | 31 |
| GO:00357101 | Oral cavity | EOLP | CD4-positive, alpha-beta T cell activation | 29/2218 | 102/18723 | 4.56e-06 | 9.43e-05 | 29 |
| GO:003021712 | Oral cavity | EOLP | T cell differentiation | 55/2218 | 257/18723 | 8.55e-06 | 1.62e-04 | 55 |
| Pathway ID | Tissue | Disease Stage | Description | Gene Ratio | Bg Ratio | pvalue | p.adjust | qvalue | Count |
| hsa05166211 | Esophagus | ESCC | Human T-cell leukemia virus 1 infection | 164/4205 | 222/8465 | 8.13e-14 | 2.09e-12 | 1.07e-12 | 164 |
| hsa05169210 | Esophagus | ESCC | Epstein-Barr virus infection | 151/4205 | 202/8465 | 1.55e-13 | 3.45e-12 | 1.77e-12 | 151 |
| hsa046259 | Esophagus | ESCC | C-type lectin receptor signaling pathway | 73/4205 | 104/8465 | 1.57e-05 | 7.98e-05 | 4.09e-05 | 73 |
| hsa040645 | Esophagus | ESCC | NF-kappa B signaling pathway | 67/4205 | 104/8465 | 1.62e-03 | 4.89e-03 | 2.50e-03 | 67 |
| hsa05166310 | Esophagus | ESCC | Human T-cell leukemia virus 1 infection | 164/4205 | 222/8465 | 8.13e-14 | 2.09e-12 | 1.07e-12 | 164 |
| hsa0516937 | Esophagus | ESCC | Epstein-Barr virus infection | 151/4205 | 202/8465 | 1.55e-13 | 3.45e-12 | 1.77e-12 | 151 |
| hsa0462513 | Esophagus | ESCC | C-type lectin receptor signaling pathway | 73/4205 | 104/8465 | 1.57e-05 | 7.98e-05 | 4.09e-05 | 73 |
| hsa0406412 | Esophagus | ESCC | NF-kappa B signaling pathway | 67/4205 | 104/8465 | 1.62e-03 | 4.89e-03 | 2.50e-03 | 67 |
| hsa0516614 | Liver | Cirrhotic | Human T-cell leukemia virus 1 infection | 87/2530 | 222/8465 | 1.69e-03 | 8.01e-03 | 4.94e-03 | 87 |
| hsa0516914 | Liver | Cirrhotic | Epstein-Barr virus infection | 80/2530 | 202/8465 | 1.80e-03 | 8.33e-03 | 5.13e-03 | 80 |
| hsa0516615 | Liver | Cirrhotic | Human T-cell leukemia virus 1 infection | 87/2530 | 222/8465 | 1.69e-03 | 8.01e-03 | 4.94e-03 | 87 |
| hsa0516915 | Liver | Cirrhotic | Epstein-Barr virus infection | 80/2530 | 202/8465 | 1.80e-03 | 8.33e-03 | 5.13e-03 | 80 |
| hsa0516921 | Liver | HCC | Epstein-Barr virus infection | 128/4020 | 202/8465 | 3.17e-06 | 2.79e-05 | 1.55e-05 | 128 |
| hsa0516622 | Liver | HCC | Human T-cell leukemia virus 1 infection | 139/4020 | 222/8465 | 3.17e-06 | 2.79e-05 | 1.55e-05 | 139 |
| hsa0516931 | Liver | HCC | Epstein-Barr virus infection | 128/4020 | 202/8465 | 3.17e-06 | 2.79e-05 | 1.55e-05 | 128 |
| hsa0516632 | Liver | HCC | Human T-cell leukemia virus 1 infection | 139/4020 | 222/8465 | 3.17e-06 | 2.79e-05 | 1.55e-05 | 139 |
| hsa0516616 | Lung | IAC | Human T-cell leukemia virus 1 infection | 49/1053 | 222/8465 | 3.44e-05 | 6.38e-04 | 4.24e-04 | 49 |
| hsa040108 | Lung | IAC | MAPK signaling pathway | 62/1053 | 302/8465 | 3.54e-05 | 6.38e-04 | 4.24e-04 | 62 |
| hsa04625 | Lung | IAC | C-type lectin receptor signaling pathway | 26/1053 | 104/8465 | 3.15e-04 | 3.11e-03 | 2.06e-03 | 26 |
| hsa0516916 | Lung | IAC | Epstein-Barr virus infection | 40/1053 | 202/8465 | 1.72e-03 | 9.66e-03 | 6.41e-03 | 40 |
| Hugo Symbol | Variant Class | Variant Classification | dbSNP RS | HGVSc | HGVSp | HGVSp Short | SWISSPROT | BIOTYPE | SIFT | PolyPhen | Tumor Sample Barcode | Tissue | Histology | Sex | Age | Stage | Therapy Types | Drugs | Outcome |
| RELB | SNV | Missense_Mutation | | c.866N>T | p.Ser289Phe | p.S289F | Q01201 | protein_coding | deleterious(0) | probably_damaging(1) | TCGA-EW-A1J5-01 | Breast | breast invasive carcinoma | Female | <65 | I/II | Chemotherapy | adriamycin | SD |
| RELB | insertion | In_Frame_Ins | novel | c.1660_1661insCAAGAGCACGTCATT | p.Gly554delinsAlaArgAlaArgHisCys | p.G554delinsARARHC | Q01201 | protein_coding | | | TCGA-BH-A0AY-01 | Breast | breast invasive carcinoma | Female | <65 | I/II | Chemotherapy | | SD |
| RELB | SNV | Missense_Mutation | novel | c.561N>T | p.Lys187Asn | p.K187N | Q01201 | protein_coding | tolerated(0.05) | probably_damaging(0.996) | TCGA-2W-A8YY-01 | Cervix | cervical & endocervical cancer | Female | <65 | I/II | Chemotherapy | cisplatin | CR |
| RELB | SNV | Missense_Mutation | rs372431384 | c.638N>A | p.Arg213Gln | p.R213Q | Q01201 | protein_coding | tolerated(0.22) | benign(0.093) | TCGA-C5-A1MH-01 | Cervix | cervical & endocervical cancer | Female | >=65 | III/IV | Chemotherapy | cisplatin | PD |
| RELB | SNV | Missense_Mutation | novel | c.122N>G | p.Ser41Cys | p.S41C | Q01201 | protein_coding | deleterious_low_confidence(0) | benign(0.237) | TCGA-MY-A5BD-01 | Cervix | cervical & endocervical cancer | Female | <65 | I/II | Chemotherapy | cisplatin | CR |
| RELB | SNV | Missense_Mutation | | c.1459G>A | p.Asp487Asn | p.D487N | Q01201 | protein_coding | deleterious_low_confidence(0.05) | benign(0) | TCGA-AA-3864-01 | Colorectum | colon adenocarcinoma | Male | >=65 | I/II | Unknown | Unknown | SD |
| RELB | SNV | Missense_Mutation | novel | c.920N>A | p.Arg307Gln | p.R307Q | Q01201 | protein_coding | deleterious(0.01) | possibly_damaging(0.796) | TCGA-AA-3950-01 | Colorectum | colon adenocarcinoma | Female | >=65 | I/II | Unknown | Unknown | SD |
| RELB | SNV | Missense_Mutation | rs747326911 | c.823N>T | p.Arg275Trp | p.R275W | Q01201 | protein_coding | deleterious(0.02) | probably_damaging(0.979) | TCGA-AZ-6598-01 | Colorectum | colon adenocarcinoma | Female | >=65 | I/II | Unknown | Unknown | SD |
| RELB | SNV | Missense_Mutation | rs376021184 | c.199N>A | p.Gly67Ser | p.G67S | Q01201 | protein_coding | deleterious_low_confidence(0.01) | benign(0.04) | TCGA-NH-A5IV-01 | Colorectum | colon adenocarcinoma | Female | >=65 | I/II | Unknown | Unknown | SD |
| RELB | SNV | Missense_Mutation | novel | c.715N>G | p.Ile239Val | p.I239V | Q01201 | protein_coding | tolerated(0.09) | benign(0.081) | TCGA-A5-A1OF-01 | Endometrium | uterine corpus endometrioid carcinoma | Female | <65 | I/II | Unknown | Unknown | SD |


