
|
|||||
|
 | |
| |
| |
| |
| |
| |
|
Gene: RDH10 |
Gene summary for RDH10 |
| Gene information | Species | Human | Gene symbol | RDH10 | Gene ID | 157506 |
| Gene name | retinol dehydrogenase 10 | |
| Gene Alias | SDR16C4 | |
| Cytomap | 8q21.11 | |
| Gene Type | protein-coding | GO ID | GO:0000003 | UniProtAcc | A0A024R7X6 |
Top |
Malignant transformation analysis |
| Identification of the aberrant gene expression in precancerous and cancerous lesions by comparing the gene expression of stem-like cells in diseased tissues with normal stem cells |
| Entrez ID | Symbol | Replicates | Species | Organ | Tissue | Adj P-value | Log2FC | Malignancy |
| 157506 | RDH10 | CA_HPV_1 | Human | Cervix | CC | 1.89e-03 | -1.78e-01 | 0.0264 |
| 157506 | RDH10 | CCI_2 | Human | Cervix | CC | 7.55e-05 | 9.15e-01 | 0.5249 |
| 157506 | RDH10 | H2 | Human | Cervix | HSIL_HPV | 1.17e-18 | 6.29e-01 | 0.0632 |
| 157506 | RDH10 | L1 | Human | Cervix | CC | 4.65e-08 | 5.69e-01 | 0.0802 |
| 157506 | RDH10 | AEH-subject1 | Human | Endometrium | AEH | 1.58e-20 | 5.80e-01 | -0.3059 |
| 157506 | RDH10 | AEH-subject2 | Human | Endometrium | AEH | 1.27e-04 | 3.46e-01 | -0.2525 |
| 157506 | RDH10 | AEH-subject3 | Human | Endometrium | AEH | 2.65e-29 | 7.72e-01 | -0.2576 |
| 157506 | RDH10 | AEH-subject4 | Human | Endometrium | AEH | 2.23e-07 | 4.46e-01 | -0.2657 |
| 157506 | RDH10 | AEH-subject5 | Human | Endometrium | AEH | 4.23e-03 | 3.21e-01 | -0.2953 |
| 157506 | RDH10 | EEC-subject1 | Human | Endometrium | EEC | 1.20e-07 | 3.36e-01 | -0.2682 |
| 157506 | RDH10 | EEC-subject2 | Human | Endometrium | EEC | 1.36e-11 | 4.51e-01 | -0.2607 |
| 157506 | RDH10 | EEC-subject3 | Human | Endometrium | EEC | 1.89e-02 | 2.04e-01 | -0.2525 |
| 157506 | RDH10 | GSM6177620_NYU_UCEC1_lib1_lib1 | Human | Endometrium | EEC | 6.54e-07 | 2.91e-01 | -0.1869 |
| 157506 | RDH10 | GSM6177620_NYU_UCEC1_lib2_lib2 | Human | Endometrium | EEC | 8.61e-08 | 3.33e-01 | -0.1875 |
| 157506 | RDH10 | GSM6177620_NYU_UCEC1_lib3_lib3 | Human | Endometrium | EEC | 5.61e-12 | 3.97e-01 | -0.1883 |
| 157506 | RDH10 | GSM6177621_NYU_UCEC2_lib1_lib1 | Human | Endometrium | EEC | 3.84e-06 | 2.96e-01 | -0.1934 |
| 157506 | RDH10 | GSM6177622_NYU_UCEC3_lib1_lib1 | Human | Endometrium | EEC | 5.91e-10 | 1.73e-01 | -0.1917 |
| 157506 | RDH10 | GSM6177622_NYU_UCEC3_lib2_lib2 | Human | Endometrium | EEC | 2.93e-07 | 2.29e-01 | -0.1916 |
| 157506 | RDH10 | GSM6177623_NYU_UCEC3_Vis | Human | Endometrium | EEC | 3.41e-13 | 4.48e-01 | -0.1269 |
| 157506 | RDH10 | LZE5T | Human | Esophagus | ESCC | 4.35e-05 | 1.09e+00 | 0.0514 |
| Page: 1 2 3 4 5 |
| Tissue | Expression Dynamics | Abbreviation |
| Cervix |  | CC: Cervix cancer |
| HSIL_HPV: HPV-infected high-grade squamous intraepithelial lesions | ||
| N_HPV: HPV-infected normal cervix | ||
| Endometrium | 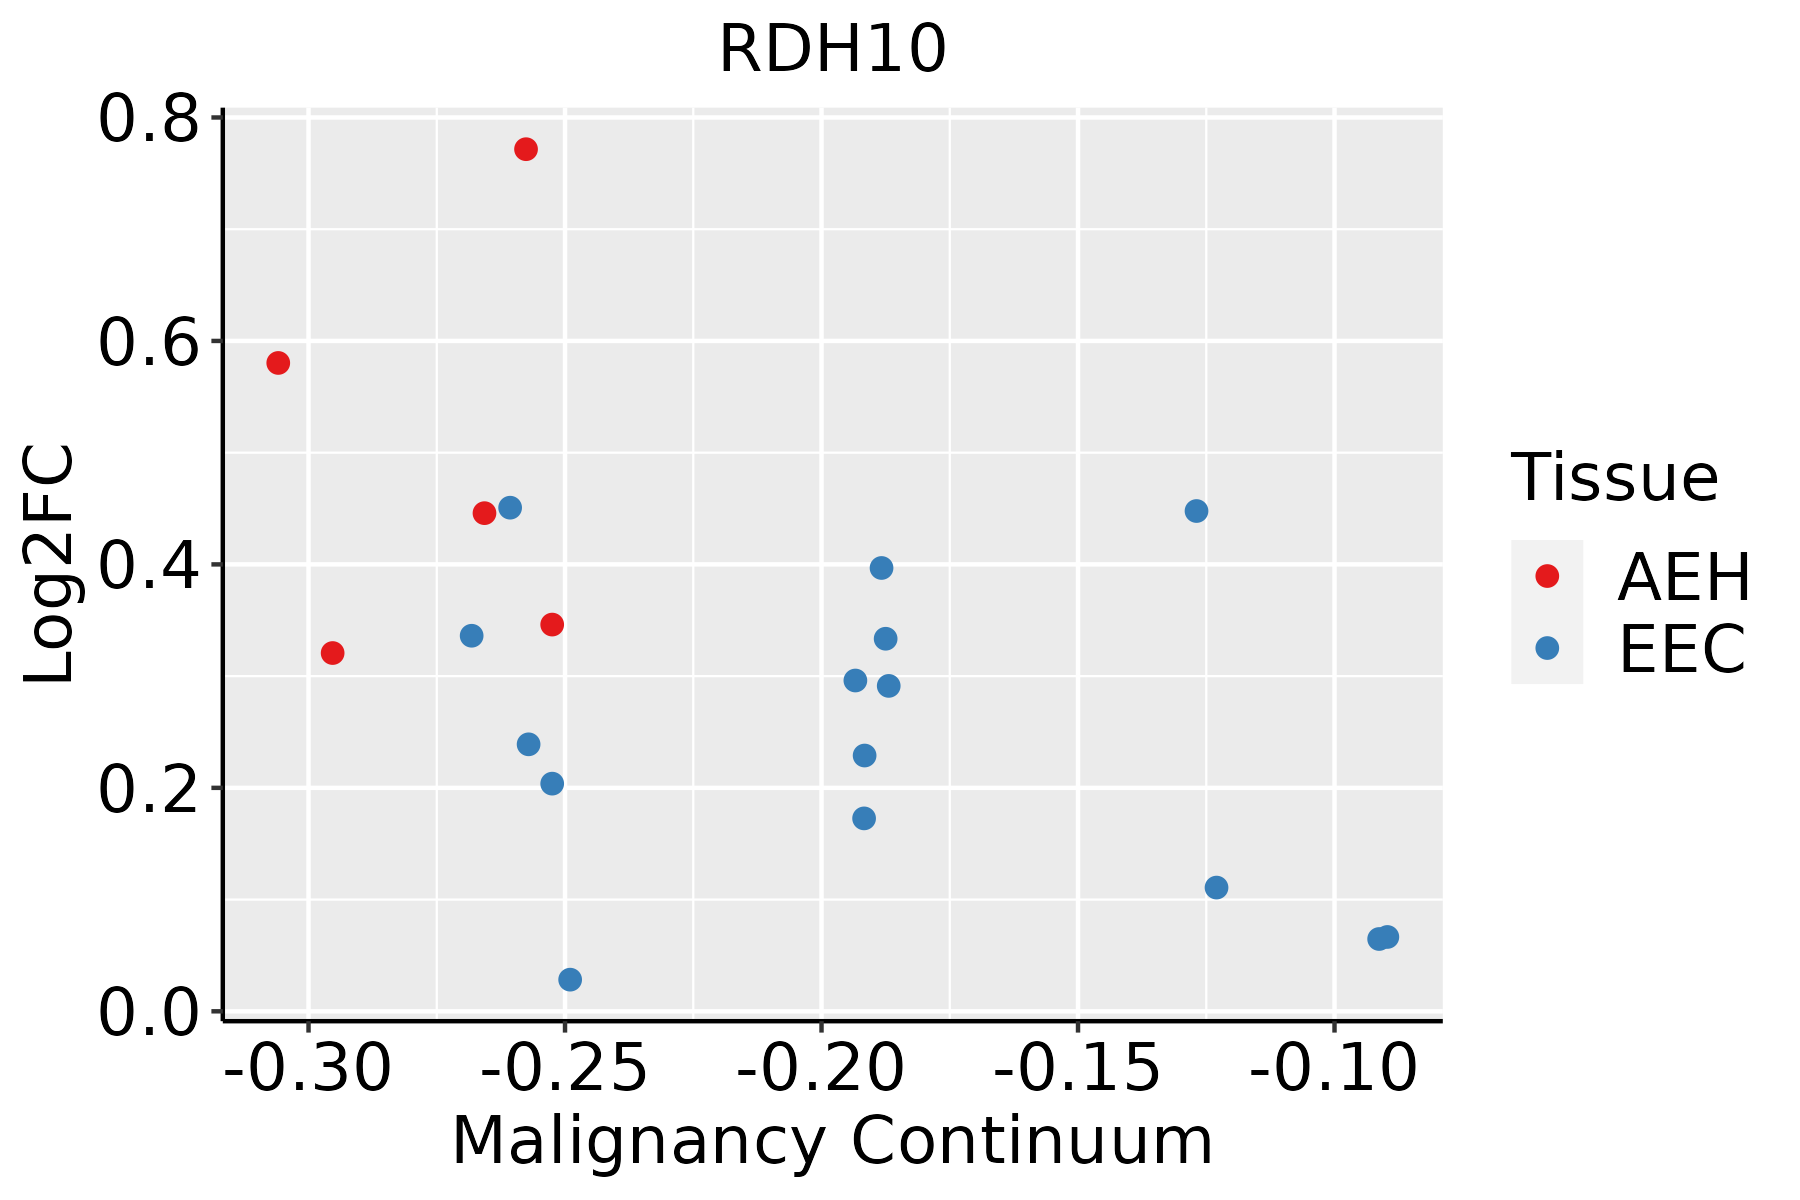 | AEH: Atypical endometrial hyperplasia |
| EEC: Endometrioid Cancer | ||
| Esophagus | 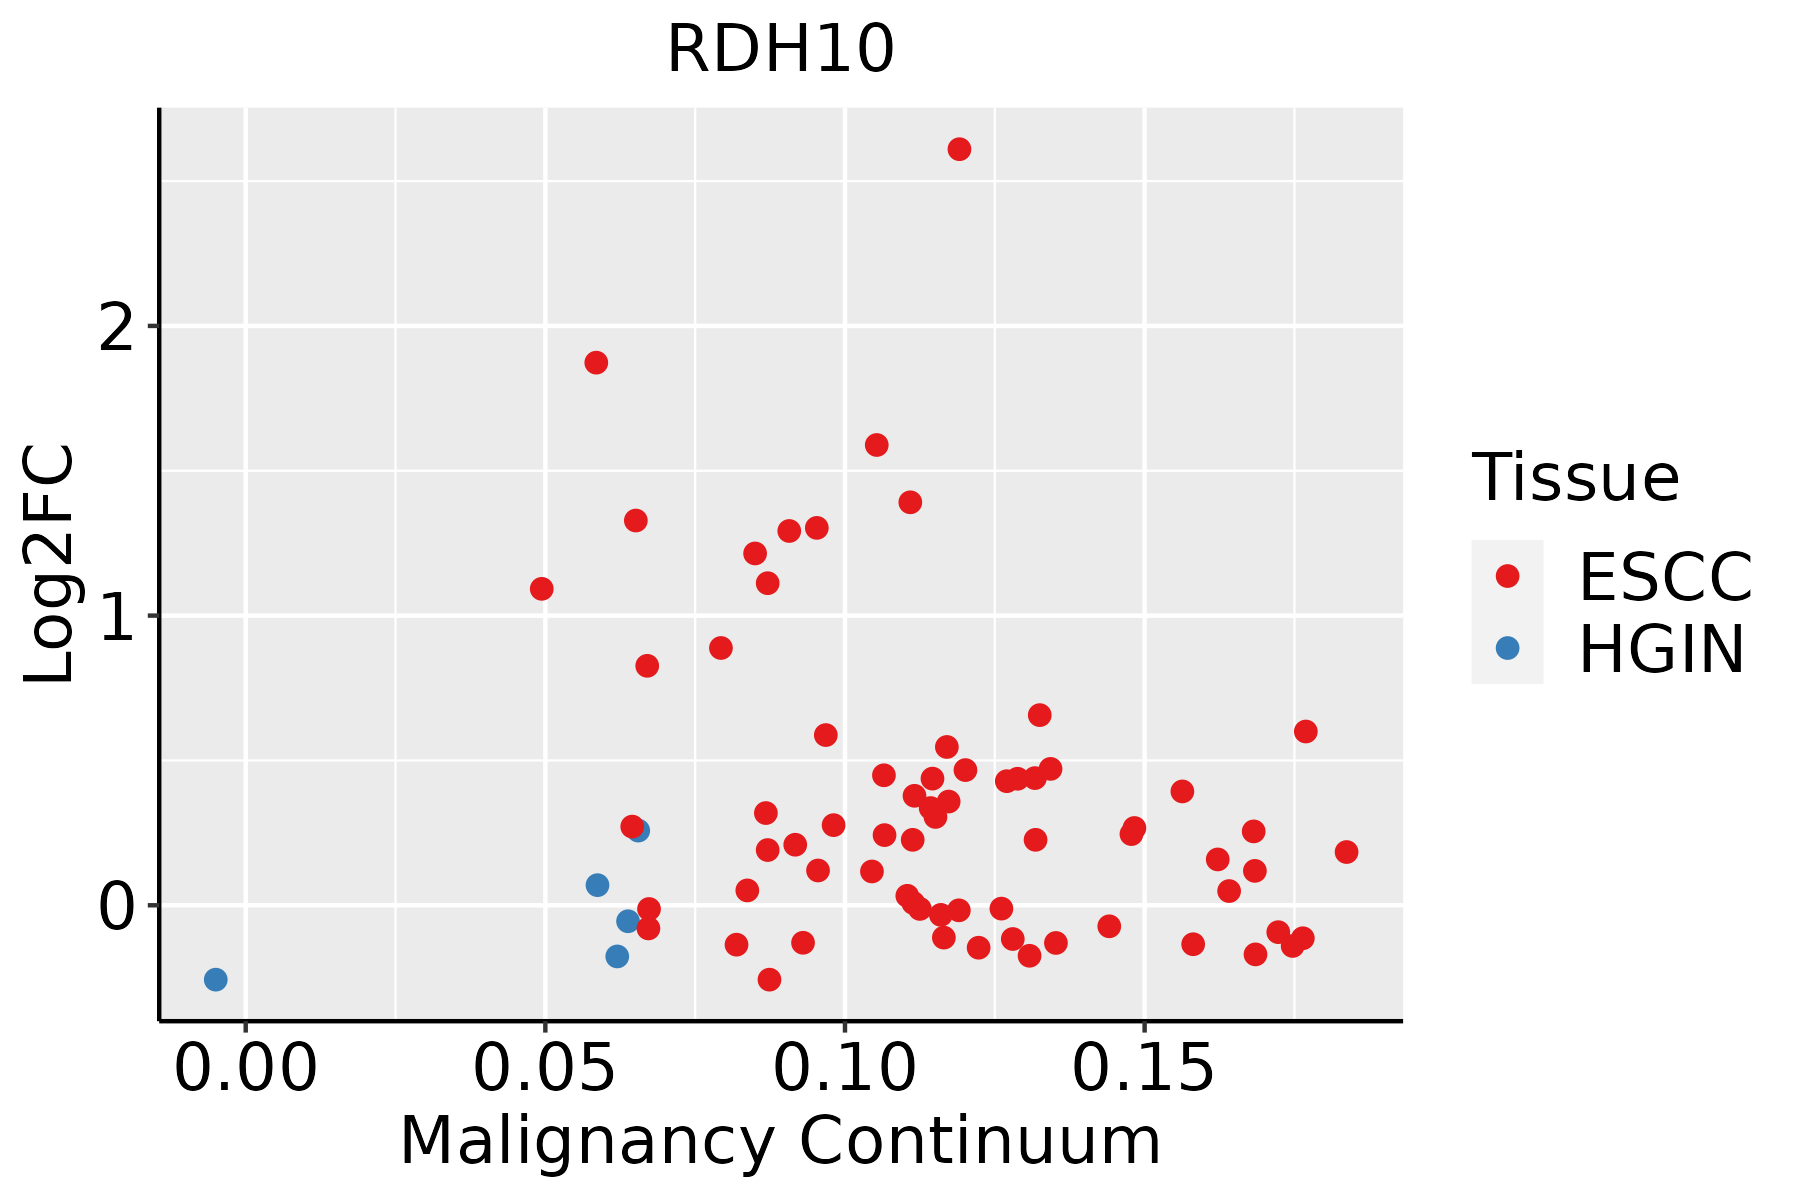 | ESCC: Esophageal squamous cell carcinoma |
| HGIN: High-grade intraepithelial neoplasias | ||
| LGIN: Low-grade intraepithelial neoplasias | ||
| Liver | 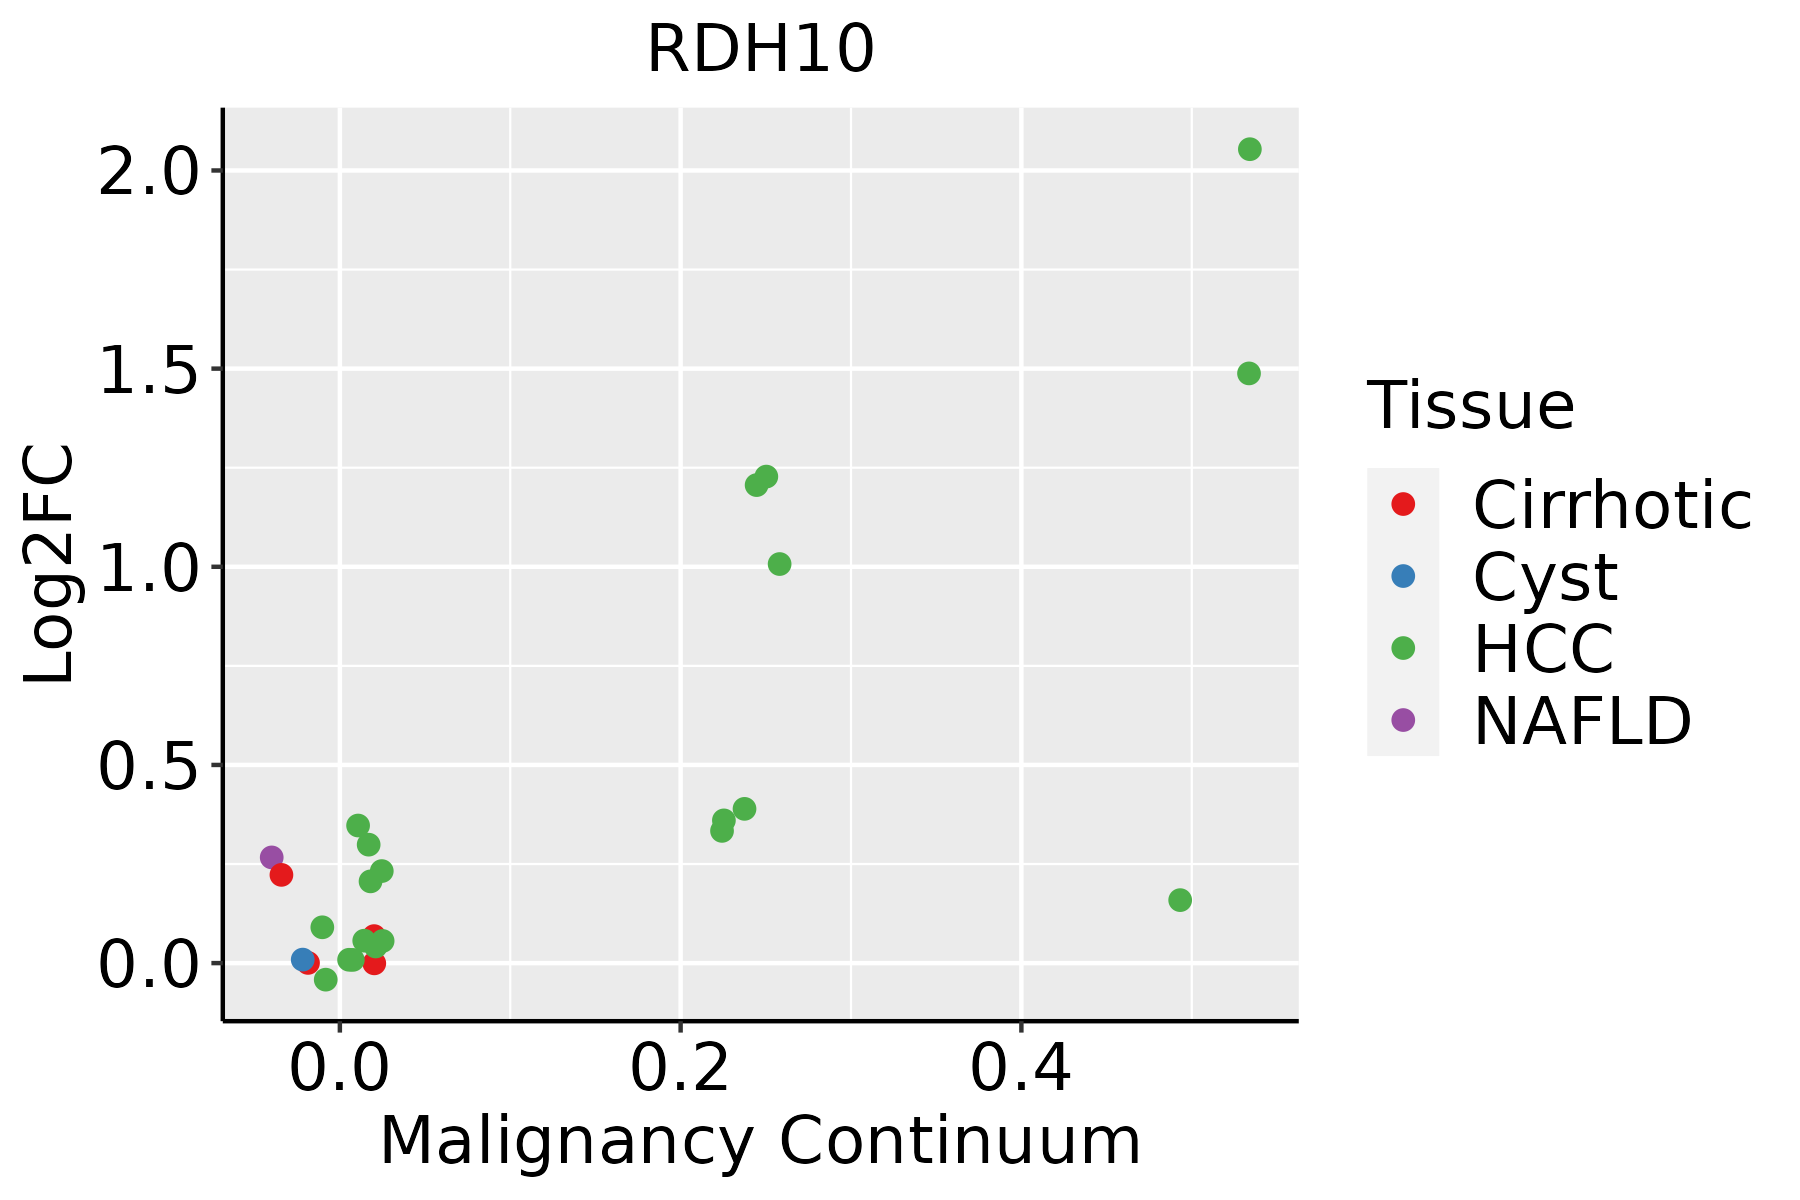 | HCC: Hepatocellular carcinoma |
| NAFLD: Non-alcoholic fatty liver disease | ||
| Oral Cavity | 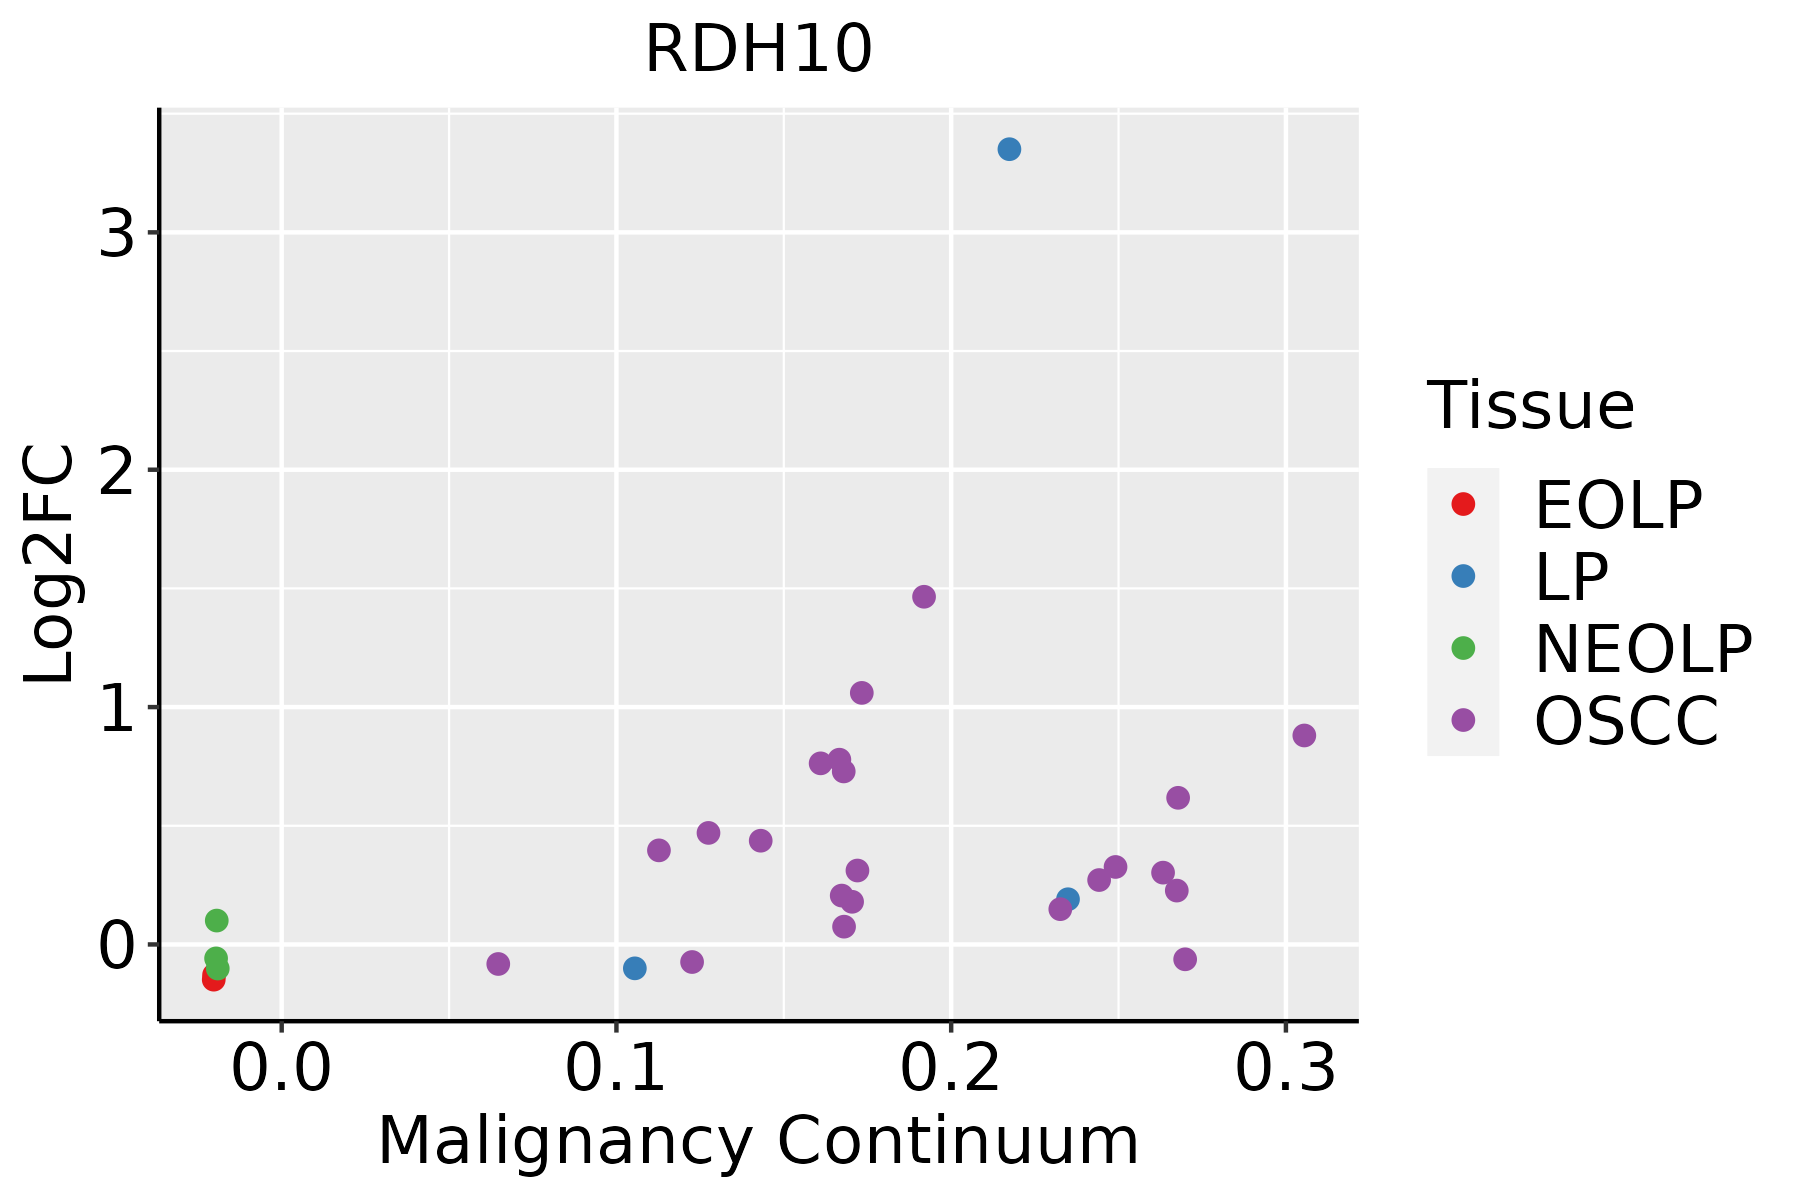 | EOLP: Erosive Oral lichen planus |
| LP: leukoplakia | ||
| NEOLP: Non-erosive oral lichen planus | ||
| OSCC: Oral squamous cell carcinoma |
| ∗log2FC in expression of this searched gene in stem-like cells from each diseased tissue sample relative to stem-like cells in normal samples in each tissue plotted against the malignancy continuum. Samples are colored based on if they are from different disease stage. |
Top |
Malignant transformation related pathway analysis |
| Find out the enriched GO biological processes and KEGG pathways involved in transition from healthy to precancer to cancer |
| Tissue | Disease Stage | Enriched GO biological Processes |
| Colorectum | AD |  |
| Colorectum | SER |  |
| Colorectum | MSS |  |
| Colorectum | MSI-H |  |
| Colorectum | FAP |  |
| ∗Top 15 enriched GO BP terms are showed in the bar plot of each disease state in each tissue. Each row represents a significant GO biological process which is colored according to the -log10(p.adjust). |
| Page: 1 2 3 4 5 6 7 8 9 |
| GO ID | Tissue | Disease Stage | Description | Gene Ratio | Bg Ratio | pvalue | p.adjust | Count |
| GO:00351151 | Endometrium | EEC | embryonic forelimb morphogenesis | 9/2168 | 31/18723 | 6.90e-03 | 3.98e-02 | 9 |
| GO:003032414 | Endometrium | EEC | lung development | 32/2168 | 177/18723 | 6.93e-03 | 3.98e-02 | 32 |
| GO:000170119 | Esophagus | ESCC | in utero embryonic development | 243/8552 | 367/18723 | 1.00e-15 | 6.86e-14 | 243 |
| GO:00163316 | Esophagus | ESCC | morphogenesis of embryonic epithelium | 98/8552 | 147/18723 | 2.12e-07 | 3.27e-06 | 98 |
| GO:0061458110 | Esophagus | ESCC | reproductive system development | 247/8552 | 427/18723 | 2.24e-07 | 3.42e-06 | 247 |
| GO:004860818 | Esophagus | ESCC | reproductive structure development | 245/8552 | 424/18723 | 2.82e-07 | 4.14e-06 | 245 |
| GO:00060668 | Esophagus | ESCC | alcohol metabolic process | 202/8552 | 353/18723 | 7.32e-06 | 7.26e-05 | 202 |
| GO:00303239 | Esophagus | ESCC | respiratory tube development | 112/8552 | 181/18723 | 7.82e-06 | 7.69e-05 | 112 |
| GO:006056210 | Esophagus | ESCC | epithelial tube morphogenesis | 187/8552 | 325/18723 | 9.95e-06 | 9.44e-05 | 187 |
| GO:00605417 | Esophagus | ESCC | respiratory system development | 123/8552 | 203/18723 | 1.26e-05 | 1.15e-04 | 123 |
| GO:00303249 | Esophagus | ESCC | lung development | 109/8552 | 177/18723 | 1.40e-05 | 1.27e-04 | 109 |
| GO:00604257 | Esophagus | ESCC | lung morphogenesis | 37/8552 | 50/18723 | 4.42e-05 | 3.51e-04 | 37 |
| GO:00488638 | Esophagus | ESCC | stem cell differentiation | 122/8552 | 206/18723 | 5.95e-05 | 4.59e-04 | 122 |
| GO:00463948 | Esophagus | ESCC | carboxylic acid biosynthetic process | 175/8552 | 314/18723 | 1.98e-04 | 1.26e-03 | 175 |
| GO:00067661 | Esophagus | ESCC | vitamin metabolic process | 67/8552 | 106/18723 | 2.03e-04 | 1.28e-03 | 67 |
| GO:00160538 | Esophagus | ESCC | organic acid biosynthetic process | 175/8552 | 316/18723 | 3.04e-04 | 1.82e-03 | 175 |
| GO:00620129 | Esophagus | ESCC | regulation of small molecule metabolic process | 184/8552 | 334/18723 | 3.11e-04 | 1.85e-03 | 184 |
| GO:00487628 | Esophagus | ESCC | mesenchymal cell differentiation | 133/8552 | 236/18723 | 5.94e-04 | 3.22e-03 | 133 |
| GO:00421805 | Esophagus | ESCC | cellular ketone metabolic process | 120/8552 | 211/18723 | 6.70e-04 | 3.55e-03 | 120 |
| GO:00485687 | Esophagus | ESCC | embryonic organ development | 228/8552 | 427/18723 | 7.28e-04 | 3.79e-03 | 228 |
| Page: 1 2 3 4 5 6 7 8 9 |
| Pathway ID | Tissue | Disease Stage | Description | Gene Ratio | Bg Ratio | pvalue | p.adjust | qvalue | Count |
| Page: 1 |
Top |
Cell-cell communication analysis |
| Identification of potential cell-cell interactions between two cell types and their ligand-receptor pairs for different disease states |
| Ligand | Receptor | LRpair | Pathway | Tissue | Disease Stage |
| Page: 1 |
Top |
Single-cell gene regulatory network inference analysis |
| Find out the significant the regulons (TFs) and the target genes of each regulon across cell types for different disease states |
| TF | Cell Type | Tissue | Disease Stage | Target Gene | RSS | Regulon Activity |
| ∗The dot plots of a searched regulon are shown for all cell subpopulations in each disease state of each tissue based on the regulon specific score inferred using pySCENIC and by calculating the average expression. |
| Page: 1 |
Top |
Somatic mutation of malignant transformation related genes |
| Annotation of somatic variants for genes involved in malignant transformation |
| Hugo Symbol | Variant Class | Variant Classification | dbSNP RS | HGVSc | HGVSp | HGVSp Short | SWISSPROT | BIOTYPE | SIFT | PolyPhen | Tumor Sample Barcode | Tissue | Histology | Sex | Age | Stage | Therapy Types | Drugs | Outcome |
| RDH10 | SNV | Missense_Mutation | novel | c.983N>T | p.Arg328Ile | p.R328I | Q8IZV5 | protein_coding | tolerated(0.11) | benign(0.01) | TCGA-AN-A046-01 | Breast | breast invasive carcinoma | Female | >=65 | I/II | Unknown | Unknown | SD |
| RDH10 | SNV | Missense_Mutation | c.616N>A | p.Gly206Arg | p.G206R | Q8IZV5 | protein_coding | tolerated(0.41) | benign(0.142) | TCGA-AO-A0J8-01 | Breast | breast invasive carcinoma | Female | <65 | I/II | Chemotherapy | cyclophosphamide | SD | |
| RDH10 | SNV | Missense_Mutation | c.861C>G | p.Ile287Met | p.I287M | Q8IZV5 | protein_coding | deleterious(0.01) | possibly_damaging(0.854) | TCGA-Q1-A73O-01 | Cervix | cervical & endocervical cancer | Female | <65 | I/II | Chemotherapy | cisplatin | CR | |
| RDH10 | SNV | Missense_Mutation | c.955N>G | p.Lys319Glu | p.K319E | Q8IZV5 | protein_coding | tolerated(0.13) | benign(0.056) | TCGA-AA-3672-01 | Colorectum | colon adenocarcinoma | Female | >=65 | III/IV | Unknown | Unknown | SD | |
| RDH10 | SNV | Missense_Mutation | c.607N>G | p.Ser203Gly | p.S203G | Q8IZV5 | protein_coding | tolerated(1) | benign(0.01) | TCGA-AA-3811-01 | Colorectum | colon adenocarcinoma | Female | >=65 | III/IV | Unknown | Unknown | PD | |
| RDH10 | SNV | Missense_Mutation | novel | c.769N>G | p.Arg257Gly | p.R257G | Q8IZV5 | protein_coding | deleterious(0.02) | benign(0.251) | TCGA-AA-3939-01 | Colorectum | colon adenocarcinoma | Male | >=65 | I/II | Unknown | Unknown | SD |
| RDH10 | SNV | Missense_Mutation | c.707T>A | p.Ile236Asn | p.I236N | Q8IZV5 | protein_coding | deleterious(0) | probably_damaging(0.956) | TCGA-NH-A5IV-01 | Colorectum | colon adenocarcinoma | Female | >=65 | I/II | Unknown | Unknown | SD | |
| RDH10 | SNV | Missense_Mutation | c.686N>G | p.Lys229Arg | p.K229R | Q8IZV5 | protein_coding | tolerated(0.37) | benign(0.025) | TCGA-AG-A036-01 | Colorectum | rectum adenocarcinoma | Male | >=65 | III/IV | Chemotherapy | 5-fluorouracil | CR | |
| RDH10 | SNV | Missense_Mutation | novel | c.692C>T | p.Ala231Val | p.A231V | Q8IZV5 | protein_coding | tolerated(0.28) | benign(0.014) | TCGA-A5-A0G2-01 | Endometrium | uterine corpus endometrioid carcinoma | Female | <65 | III/IV | Unknown | Unknown | SD |
| RDH10 | SNV | Missense_Mutation | novel | c.841C>A | p.Leu281Ile | p.L281I | Q8IZV5 | protein_coding | deleterious(0.01) | probably_damaging(0.994) | TCGA-A5-A0G2-01 | Endometrium | uterine corpus endometrioid carcinoma | Female | <65 | III/IV | Unknown | Unknown | SD |
| Page: 1 2 3 |
Top |
Related drugs of malignant transformation related genes |
| Identification of chemicals and drugs interact with genes involved in malignant transfromation |
| (DGIdb 4.0) |
| Entrez ID | Symbol | Category | Interaction Types | Drug Claim Name | Drug Name | PMIDs |
| Page: 1 |

Copyright 2023-Present -The University of Texas Health Science Center at Houston |