
|
|||||
|
 | |
| |
| |
| |
| |
| |
|
Gene: RBM6 |
Gene summary for RBM6 |
| Gene information | Species | Human | Gene symbol | RBM6 | Gene ID | 10180 |
| Gene name | RNA binding motif protein 6 | |
| Gene Alias | 3G2 | |
| Cytomap | 3p21.31 | |
| Gene Type | protein-coding | GO ID | GO:0000375 | UniProtAcc | A8K6Q4 |
Top |
Malignant transformation analysis |
| Identification of the aberrant gene expression in precancerous and cancerous lesions by comparing the gene expression of stem-like cells in diseased tissues with normal stem cells |
| Entrez ID | Symbol | Replicates | Species | Organ | Tissue | Adj P-value | Log2FC | Malignancy |
| 10180 | RBM6 | HTA11_3410_2000001011 | Human | Colorectum | AD | 2.23e-09 | -3.73e-01 | 0.0155 |
| 10180 | RBM6 | HTA11_1938_2000001011 | Human | Colorectum | AD | 1.23e-04 | 4.89e-01 | -0.0811 |
| 10180 | RBM6 | HTA11_347_2000001011 | Human | Colorectum | AD | 2.31e-14 | 6.78e-01 | -0.1954 |
| 10180 | RBM6 | HTA11_866_2000001011 | Human | Colorectum | AD | 1.14e-03 | 4.16e-01 | -0.1001 |
| 10180 | RBM6 | HTA11_1391_2000001011 | Human | Colorectum | AD | 3.15e-04 | 4.92e-01 | -0.059 |
| 10180 | RBM6 | HTA11_99999965062_69753 | Human | Colorectum | MSI-H | 1.69e-03 | 6.37e-01 | 0.3487 |
| 10180 | RBM6 | HTA11_99999965104_69814 | Human | Colorectum | MSS | 1.13e-14 | 8.27e-01 | 0.281 |
| 10180 | RBM6 | F007 | Human | Colorectum | FAP | 1.09e-02 | -1.49e-01 | 0.1176 |
| 10180 | RBM6 | A001-C-207 | Human | Colorectum | FAP | 3.13e-03 | -5.62e-02 | 0.1278 |
| 10180 | RBM6 | A015-C-203 | Human | Colorectum | FAP | 2.13e-28 | -1.33e-01 | -0.1294 |
| 10180 | RBM6 | A015-C-204 | Human | Colorectum | FAP | 3.63e-08 | -2.91e-01 | -0.0228 |
| 10180 | RBM6 | A014-C-040 | Human | Colorectum | FAP | 1.68e-02 | -7.46e-02 | -0.1184 |
| 10180 | RBM6 | A002-C-201 | Human | Colorectum | FAP | 3.26e-16 | 7.99e-02 | 0.0324 |
| 10180 | RBM6 | A001-C-119 | Human | Colorectum | FAP | 1.76e-10 | 1.24e-01 | -0.1557 |
| 10180 | RBM6 | A001-C-108 | Human | Colorectum | FAP | 2.76e-16 | -2.98e-02 | -0.0272 |
| 10180 | RBM6 | A002-C-205 | Human | Colorectum | FAP | 1.31e-30 | 1.42e-01 | -0.1236 |
| 10180 | RBM6 | A015-C-005 | Human | Colorectum | FAP | 3.30e-04 | -2.41e-01 | -0.0336 |
| 10180 | RBM6 | A015-C-006 | Human | Colorectum | FAP | 7.02e-21 | -1.66e-01 | -0.0994 |
| 10180 | RBM6 | A015-C-106 | Human | Colorectum | FAP | 8.51e-11 | -1.70e-01 | -0.0511 |
| 10180 | RBM6 | A002-C-114 | Human | Colorectum | FAP | 8.41e-26 | -1.22e-01 | -0.1561 |
| Page: 1 2 3 4 5 6 7 8 9 10 11 |
| Tissue | Expression Dynamics | Abbreviation |
| Colorectum (GSE201348) | 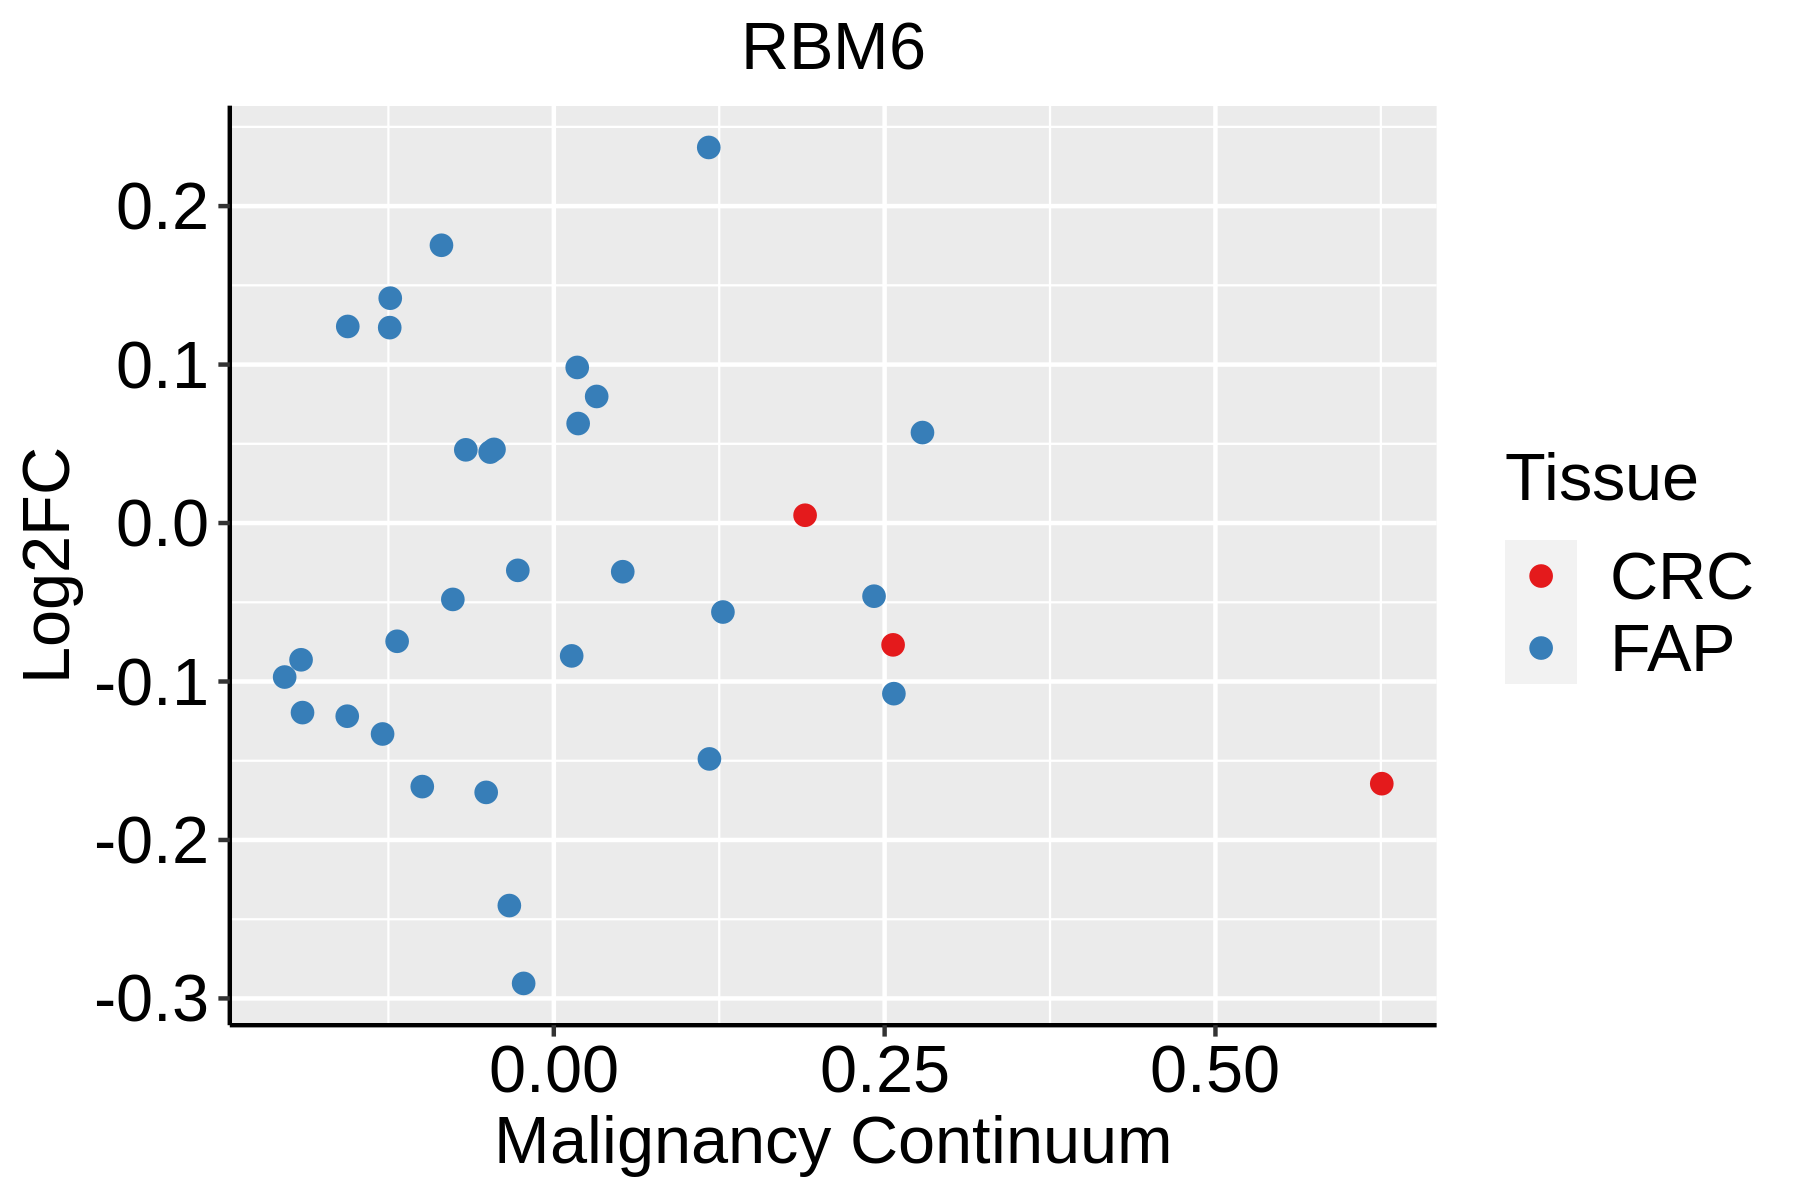 | FAP: Familial adenomatous polyposis |
| CRC: Colorectal cancer | ||
| Colorectum (HTA11) | 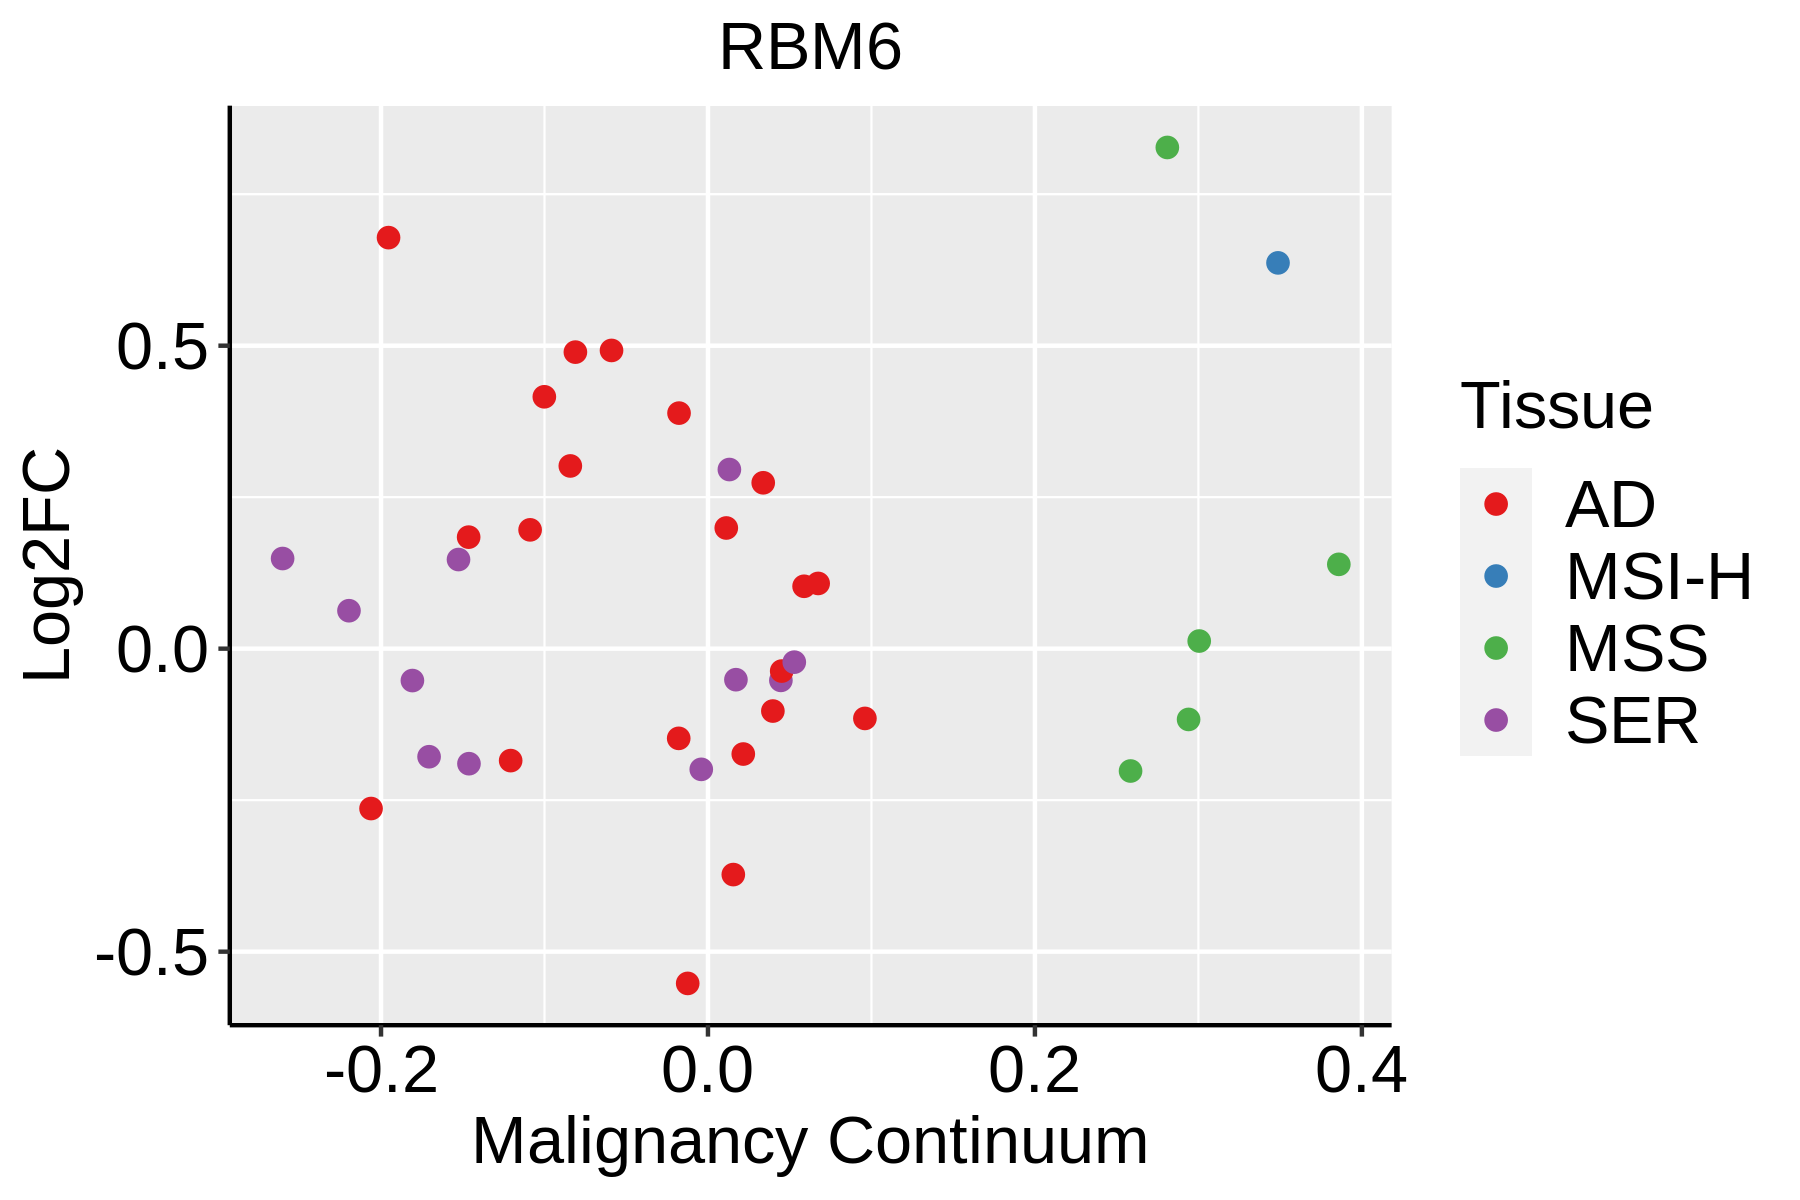 | AD: Adenomas |
| SER: Sessile serrated lesions | ||
| MSI-H: Microsatellite-high colorectal cancer | ||
| MSS: Microsatellite stable colorectal cancer | ||
| Endometrium |  | AEH: Atypical endometrial hyperplasia |
| EEC: Endometrioid Cancer | ||
| Esophagus | 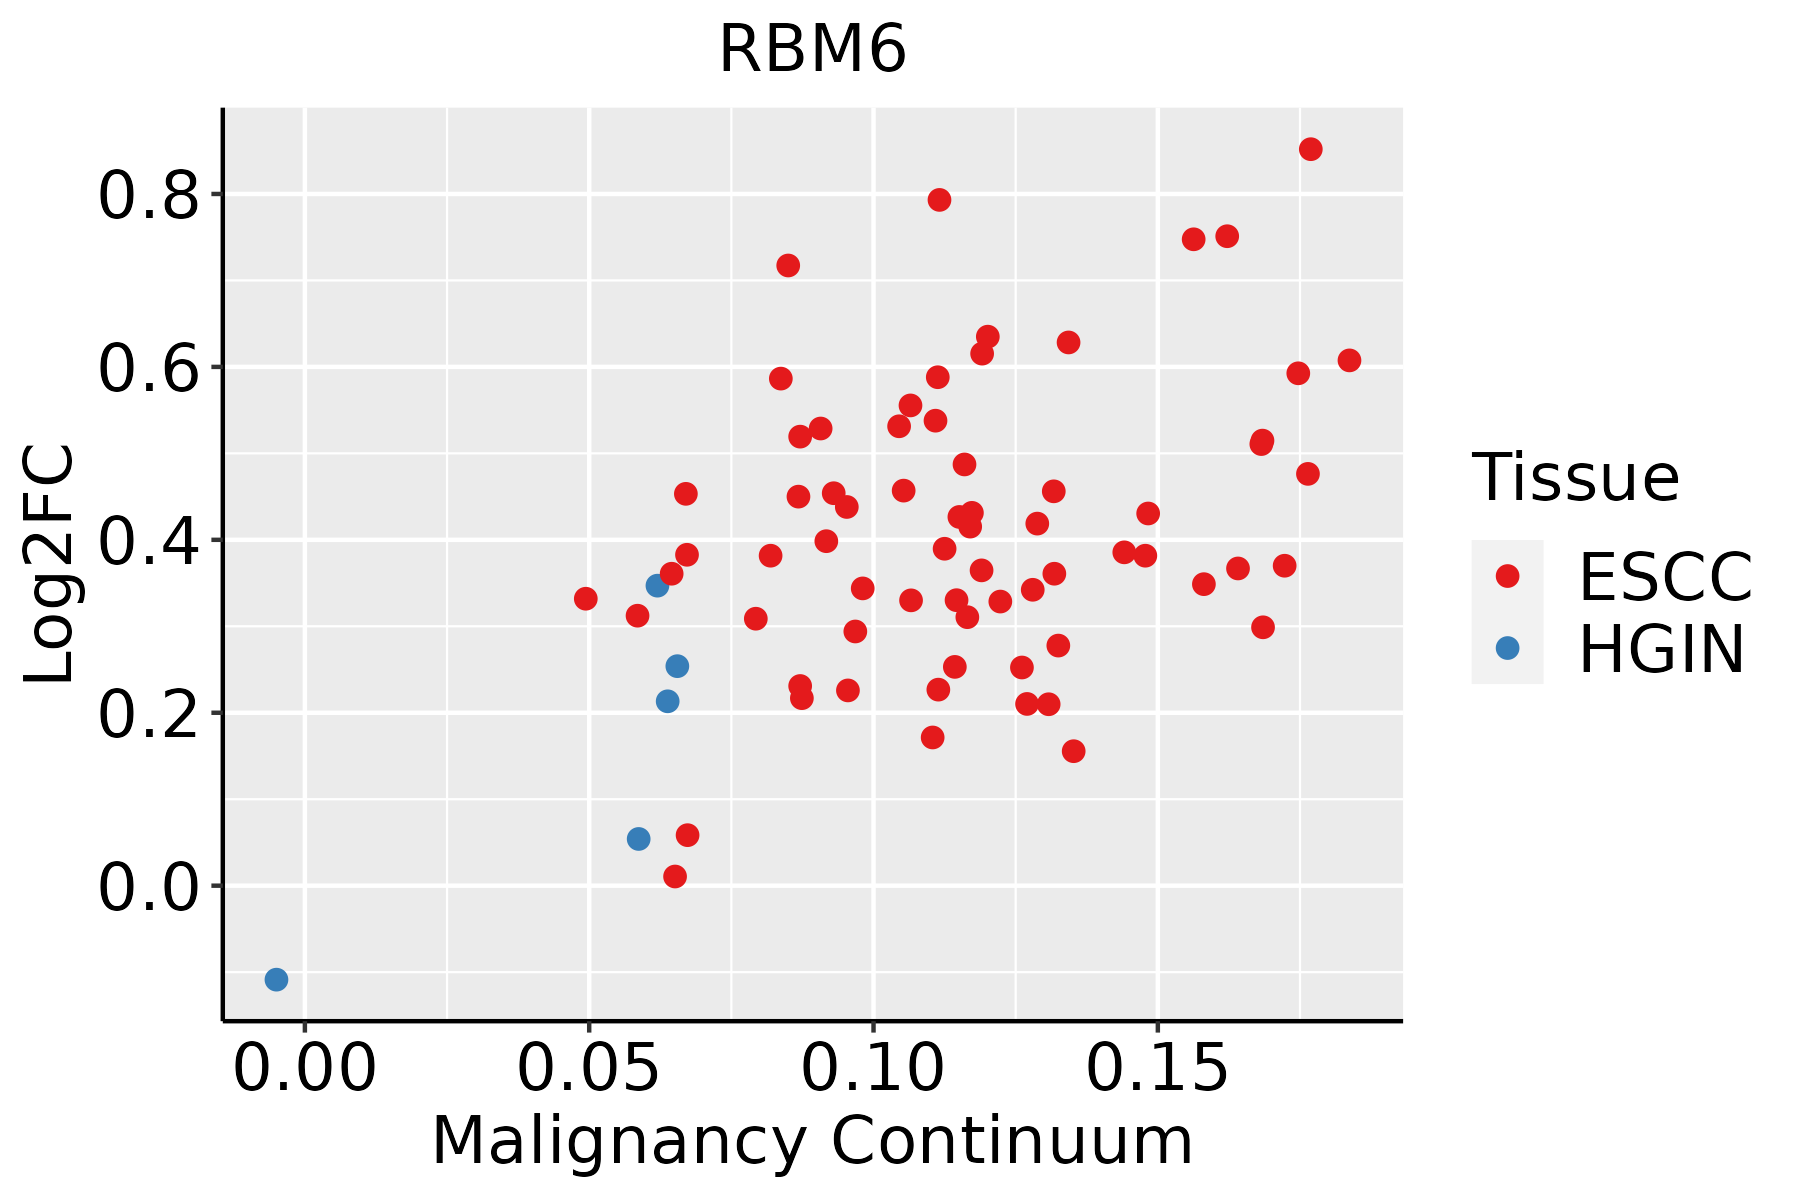 | ESCC: Esophageal squamous cell carcinoma |
| HGIN: High-grade intraepithelial neoplasias | ||
| LGIN: Low-grade intraepithelial neoplasias | ||
| Liver |  | HCC: Hepatocellular carcinoma |
| NAFLD: Non-alcoholic fatty liver disease | ||
| Lung | 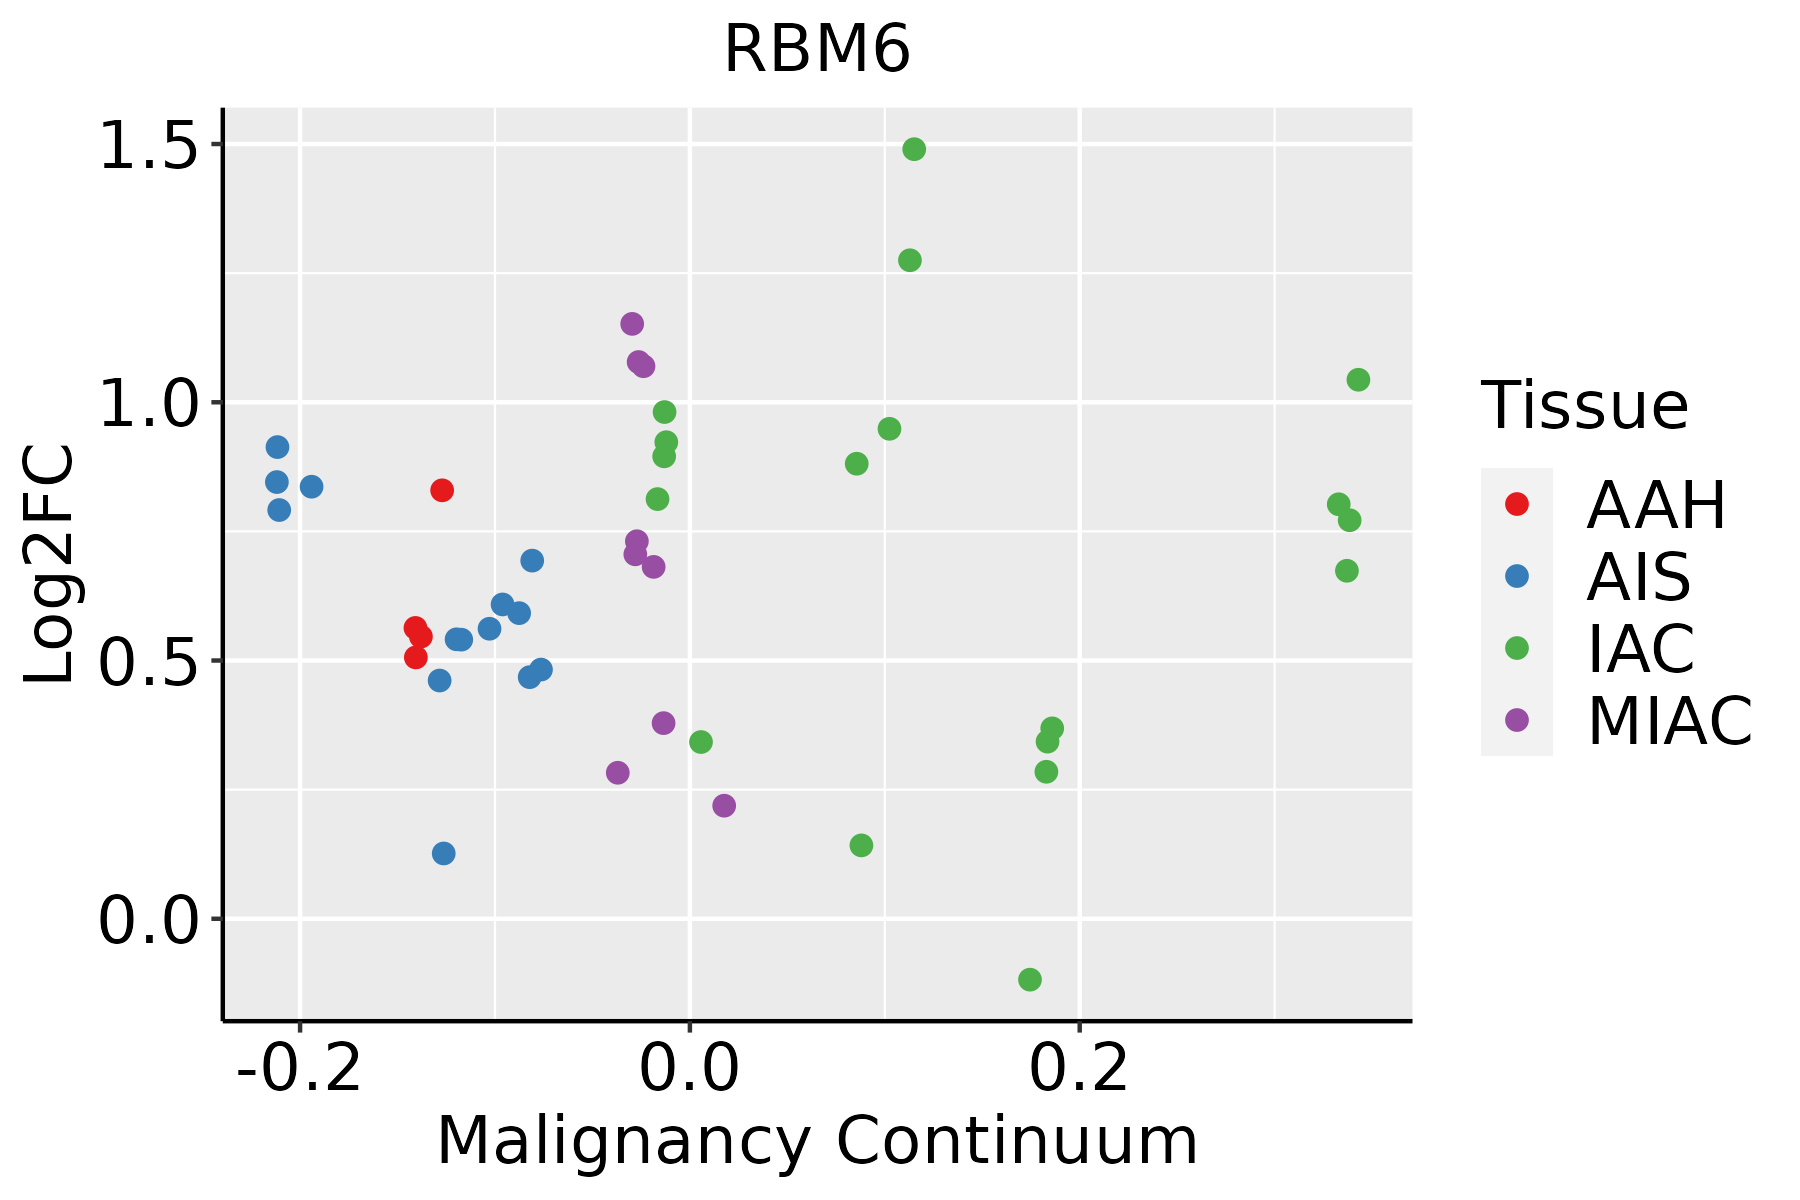 | AAH: Atypical adenomatous hyperplasia |
| AIS: Adenocarcinoma in situ | ||
| IAC: Invasive lung adenocarcinoma | ||
| MIA: Minimally invasive adenocarcinoma | ||
| Oral Cavity | 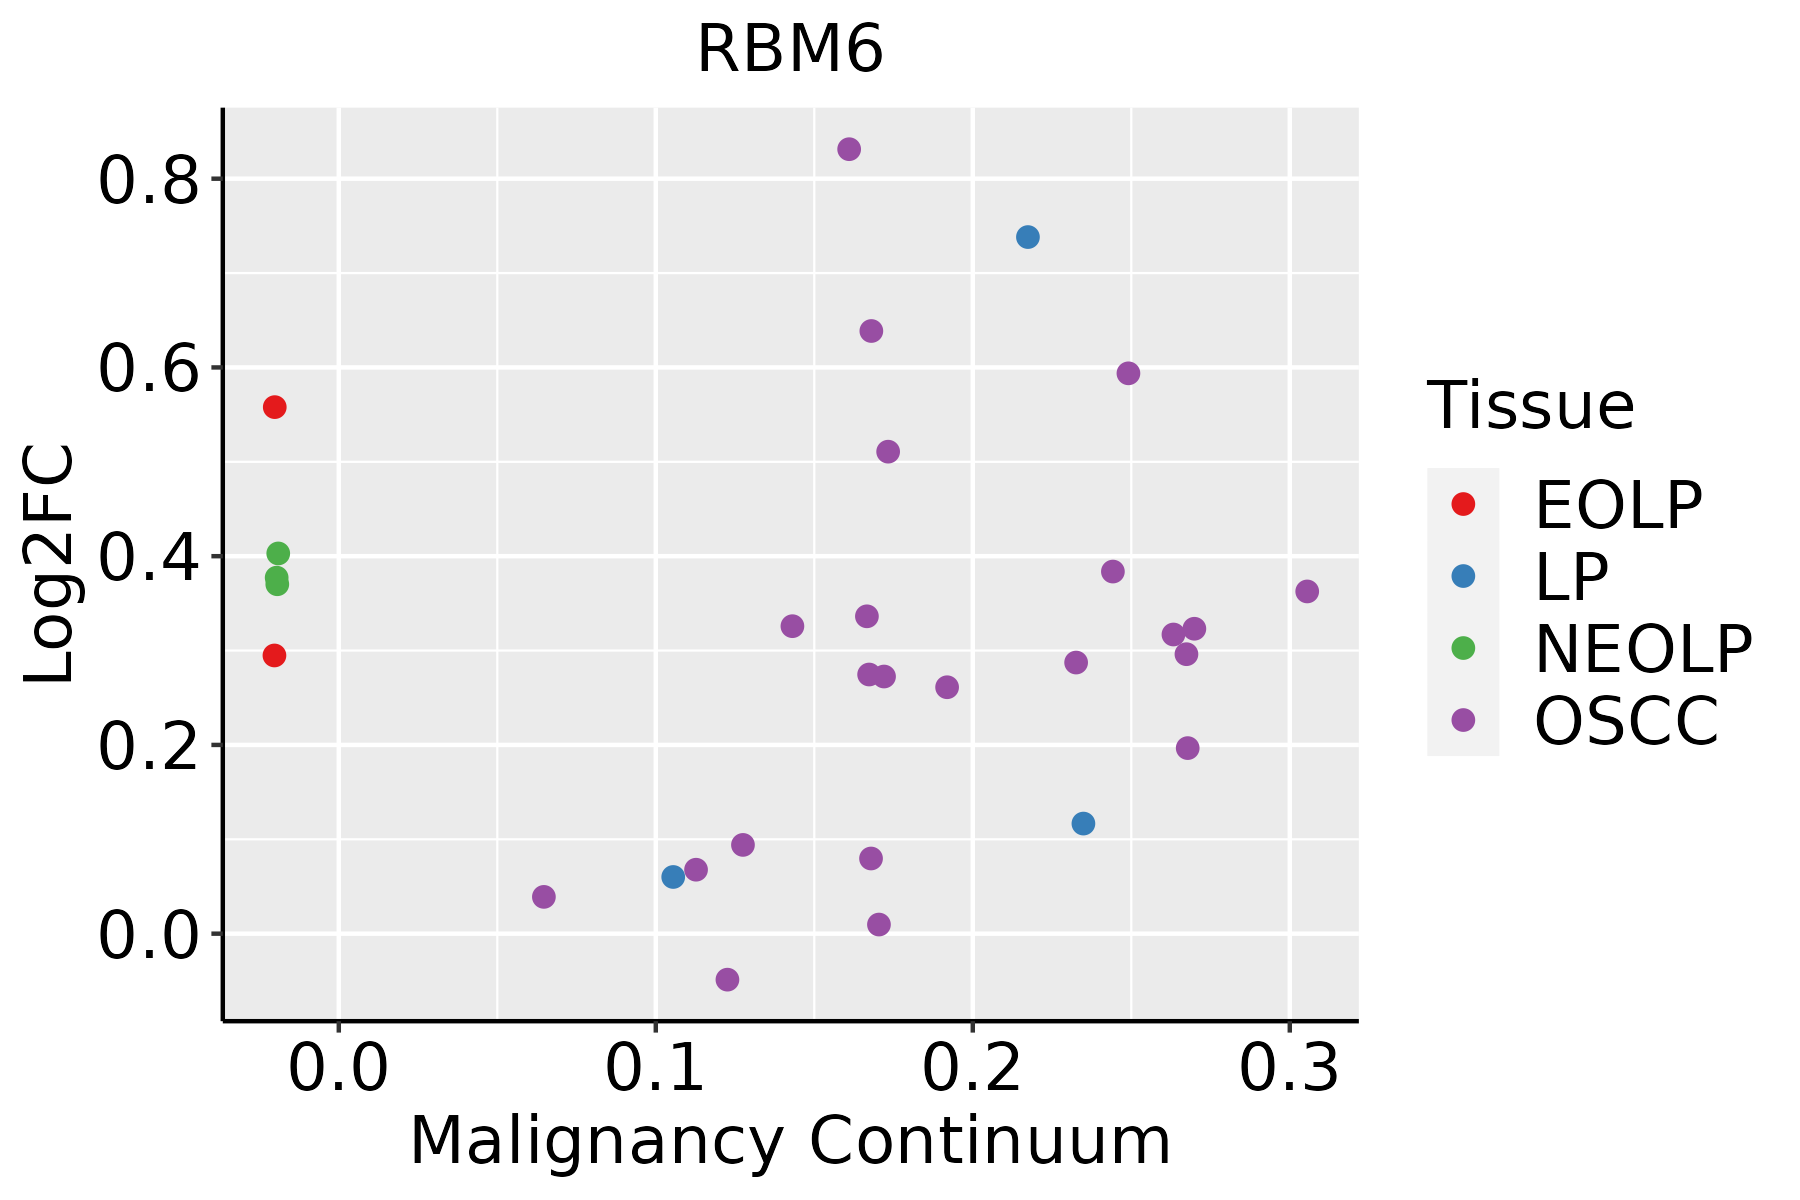 | EOLP: Erosive Oral lichen planus |
| LP: leukoplakia | ||
| NEOLP: Non-erosive oral lichen planus | ||
| OSCC: Oral squamous cell carcinoma | ||
| Prostate |  | BPH: Benign Prostatic Hyperplasia |
| Thyroid | 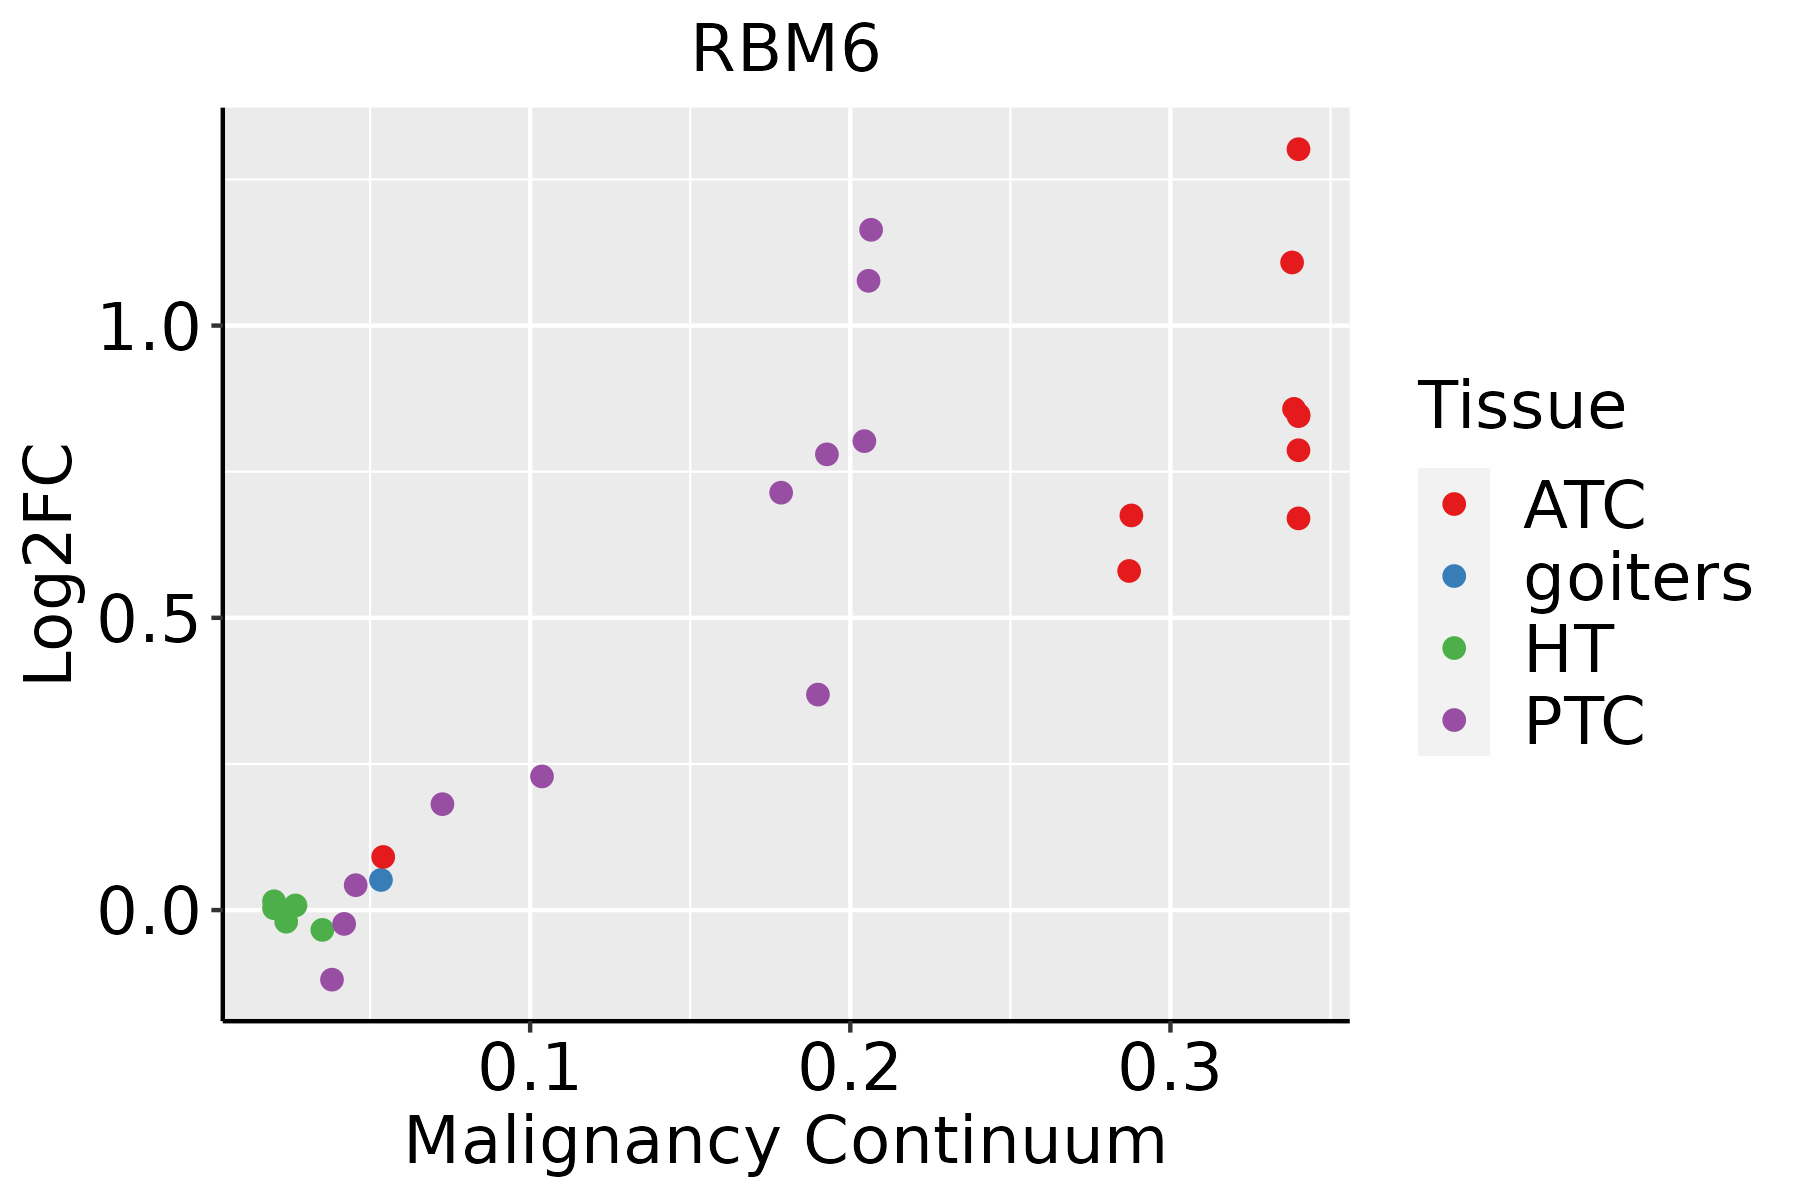 | ATC: Anaplastic thyroid cancer |
| HT: Hashimoto's thyroiditis | ||
| PTC: Papillary thyroid cancer |
| ∗log2FC in expression of this searched gene in stem-like cells from each diseased tissue sample relative to stem-like cells in normal samples in each tissue plotted against the malignancy continuum. Samples are colored based on if they are from different disease stage. |
Top |
Malignant transformation related pathway analysis |
| Find out the enriched GO biological processes and KEGG pathways involved in transition from healthy to precancer to cancer |
| Tissue | Disease Stage | Enriched GO biological Processes |
| Colorectum | AD |  |
| Colorectum | SER |  |
| Colorectum | MSS |  |
| Colorectum | MSI-H |  |
| Colorectum | FAP |  |
| ∗Top 15 enriched GO BP terms are showed in the bar plot of each disease state in each tissue. Each row represents a significant GO biological process which is colored according to the -log10(p.adjust). |
| Page: 1 2 3 4 5 6 7 8 9 |
| GO ID | Tissue | Disease Stage | Description | Gene Ratio | Bg Ratio | pvalue | p.adjust | Count |
| GO:0008380113 | Thyroid | PTC | RNA splicing | 273/5968 | 434/18723 | 4.44e-41 | 1.40e-37 | 273 |
| GO:0000375113 | Thyroid | PTC | RNA splicing, via transesterification reactions | 202/5968 | 324/18723 | 6.81e-30 | 3.91e-27 | 202 |
| GO:0000377113 | Thyroid | PTC | RNA splicing, via transesterification reactions with bulged adenosine as nucleophile | 199/5968 | 320/18723 | 2.96e-29 | 1.44e-26 | 199 |
| GO:0000398113 | Thyroid | PTC | mRNA splicing, via spliceosome | 199/5968 | 320/18723 | 2.96e-29 | 1.44e-26 | 199 |
| GO:000838034 | Thyroid | ATC | RNA splicing | 270/6293 | 434/18723 | 7.50e-35 | 1.19e-31 | 270 |
| GO:000037534 | Thyroid | ATC | RNA splicing, via transesterification reactions | 200/6293 | 324/18723 | 1.75e-25 | 7.39e-23 | 200 |
| GO:000037734 | Thyroid | ATC | RNA splicing, via transesterification reactions with bulged adenosine as nucleophile | 197/6293 | 320/18723 | 6.54e-25 | 2.18e-22 | 197 |
| GO:000039834 | Thyroid | ATC | mRNA splicing, via spliceosome | 197/6293 | 320/18723 | 6.54e-25 | 2.18e-22 | 197 |
| Page: 1 2 3 4 5 |
| Pathway ID | Tissue | Disease Stage | Description | Gene Ratio | Bg Ratio | pvalue | p.adjust | qvalue | Count |
| Page: 1 |
Top |
Cell-cell communication analysis |
| Identification of potential cell-cell interactions between two cell types and their ligand-receptor pairs for different disease states |
| Ligand | Receptor | LRpair | Pathway | Tissue | Disease Stage |
| Page: 1 |
Top |
Single-cell gene regulatory network inference analysis |
| Find out the significant the regulons (TFs) and the target genes of each regulon across cell types for different disease states |
| TF | Cell Type | Tissue | Disease Stage | Target Gene | RSS | Regulon Activity |
| ∗The dot plots of a searched regulon are shown for all cell subpopulations in each disease state of each tissue based on the regulon specific score inferred using pySCENIC and by calculating the average expression. |
| Page: 1 |
Top |
Somatic mutation of malignant transformation related genes |
| Annotation of somatic variants for genes involved in malignant transformation |
| Hugo Symbol | Variant Class | Variant Classification | dbSNP RS | HGVSc | HGVSp | HGVSp Short | SWISSPROT | BIOTYPE | SIFT | PolyPhen | Tumor Sample Barcode | Tissue | Histology | Sex | Age | Stage | Therapy Types | Drugs | Outcome |
| RBM6 | SNV | Missense_Mutation | c.1528N>C | p.Asp510His | p.D510H | P78332 | protein_coding | deleterious(0) | possibly_damaging(0.823) | TCGA-A1-A0SI-01 | Breast | breast invasive carcinoma | Female | <65 | I/II | Unknown | Unknown | SD | |
| RBM6 | SNV | Missense_Mutation | novel | c.2317N>C | p.Asp773His | p.D773H | P78332 | protein_coding | tolerated(0.13) | possibly_damaging(0.781) | TCGA-A7-A56D-01 | Breast | breast invasive carcinoma | Female | >=65 | I/II | Hormone Therapy | arimidex | SD |
| RBM6 | SNV | Missense_Mutation | c.2036N>G | p.Tyr679Cys | p.Y679C | P78332 | protein_coding | deleterious(0) | benign(0.011) | TCGA-AR-A1AS-01 | Breast | breast invasive carcinoma | Female | <65 | I/II | Chemotherapy | doxorubicin | SD | |
| RBM6 | SNV | Missense_Mutation | novel | c.3182N>T | p.Ala1061Val | p.A1061V | P78332 | protein_coding | tolerated(0.06) | benign(0.119) | TCGA-BH-A0HF-01 | Breast | breast invasive carcinoma | Female | >=65 | I/II | Hormone Therapy | arimidex | SD |
| RBM6 | SNV | Missense_Mutation | rs748990943 | c.1674C>G | p.Phe558Leu | p.F558L | P78332 | protein_coding | tolerated(0.29) | benign(0) | TCGA-BH-A0W7-01 | Breast | breast invasive carcinoma | Female | <65 | I/II | Chemotherapy | taxotere | CR |
| RBM6 | SNV | Missense_Mutation | rs746775897 | c.182N>T | p.Ser61Leu | p.S61L | P78332 | protein_coding | tolerated_low_confidence(0.11) | benign(0.041) | TCGA-D8-A147-01 | Breast | breast invasive carcinoma | Female | <65 | I/II | Chemotherapy | doxorubicine | SD |
| RBM6 | SNV | Missense_Mutation | c.1644N>G | p.Asn548Lys | p.N548K | P78332 | protein_coding | tolerated(0.91) | benign(0.006) | TCGA-D8-A1JC-01 | Breast | breast invasive carcinoma | Female | <65 | III/IV | Chemotherapy | adriamycin | SD | |
| RBM6 | SNV | Missense_Mutation | c.2773N>G | p.Pro925Ala | p.P925A | P78332 | protein_coding | tolerated(0.11) | benign(0.138) | TCGA-D8-A27G-01 | Breast | breast invasive carcinoma | Female | >=65 | I/II | Unknown | Unknown | SD | |
| RBM6 | SNV | Missense_Mutation | c.799C>A | p.Gln267Lys | p.Q267K | P78332 | protein_coding | tolerated(0.41) | probably_damaging(0.952) | TCGA-E2-A14Z-01 | Breast | breast invasive carcinoma | Female | <65 | I/II | Hormone Therapy | arimidex | PD | |
| RBM6 | SNV | Missense_Mutation | novel | c.280N>A | p.Asp94Asn | p.D94N | P78332 | protein_coding | deleterious_low_confidence(0.01) | benign(0.023) | TCGA-GM-A2DO-01 | Breast | breast invasive carcinoma | Female | <65 | I/II | Hormone Therapy | tamoxiphen | CR |
| Page: 1 2 3 4 5 6 7 8 9 10 11 12 |
Top |
Related drugs of malignant transformation related genes |
| Identification of chemicals and drugs interact with genes involved in malignant transfromation |
| (DGIdb 4.0) |
| Entrez ID | Symbol | Category | Interaction Types | Drug Claim Name | Drug Name | PMIDs |
| Page: 1 |

Copyright 2023-Present -The University of Texas Health Science Center at Houston |