
|
|||||
|
 | |
| |
| |
| |
| |
| |
|
Gene: RAD51 |
Gene summary for RAD51 |
| Gene information | Species | Human | Gene symbol | RAD51 | Gene ID | 5888 |
| Gene name | RAD51 recombinase | |
| Gene Alias | BRCC5 | |
| Cytomap | 15q15.1 | |
| Gene Type | protein-coding | GO ID | GO:0000003 | UniProtAcc | Q06609 |
Top |
Malignant transformation analysis |
| Identification of the aberrant gene expression in precancerous and cancerous lesions by comparing the gene expression of stem-like cells in diseased tissues with normal stem cells |
| Entrez ID | Symbol | Replicates | Species | Organ | Tissue | Adj P-value | Log2FC | Malignancy |
| 5888 | RAD51 | C04 | Human | Oral cavity | OSCC | 3.29e-04 | 3.47e-01 | 0.2633 |
| 5888 | RAD51 | C21 | Human | Oral cavity | OSCC | 1.84e-15 | 7.32e-01 | 0.2678 |
| 5888 | RAD51 | C30 | Human | Oral cavity | OSCC | 2.32e-08 | 5.10e-01 | 0.3055 |
| 5888 | RAD51 | C38 | Human | Oral cavity | OSCC | 3.86e-06 | 6.90e-01 | 0.172 |
| 5888 | RAD51 | C43 | Human | Oral cavity | OSCC | 4.33e-08 | 2.03e-01 | 0.1704 |
| 5888 | RAD51 | C46 | Human | Oral cavity | OSCC | 7.11e-12 | 3.46e-01 | 0.1673 |
| 5888 | RAD51 | C51 | Human | Oral cavity | OSCC | 5.98e-06 | 3.47e-01 | 0.2674 |
| 5888 | RAD51 | C57 | Human | Oral cavity | OSCC | 1.93e-05 | 2.32e-01 | 0.1679 |
| 5888 | RAD51 | C08 | Human | Oral cavity | OSCC | 2.00e-08 | 3.00e-01 | 0.1919 |
| 5888 | RAD51 | LN22 | Human | Oral cavity | OSCC | 1.51e-07 | 4.08e-01 | 0.1733 |
| 5888 | RAD51 | LN46 | Human | Oral cavity | OSCC | 7.17e-11 | 3.75e-01 | 0.1666 |
| 5888 | RAD51 | LP15 | Human | Oral cavity | LP | 2.57e-03 | 3.01e-01 | 0.2174 |
| 5888 | RAD51 | SYSMH2 | Human | Oral cavity | OSCC | 8.75e-05 | 2.23e-01 | 0.2326 |
| 5888 | RAD51 | SYSMH3 | Human | Oral cavity | OSCC | 9.26e-07 | 2.39e-01 | 0.2442 |
| Page: 1 |
| Tissue | Expression Dynamics | Abbreviation |
| Oral Cavity | 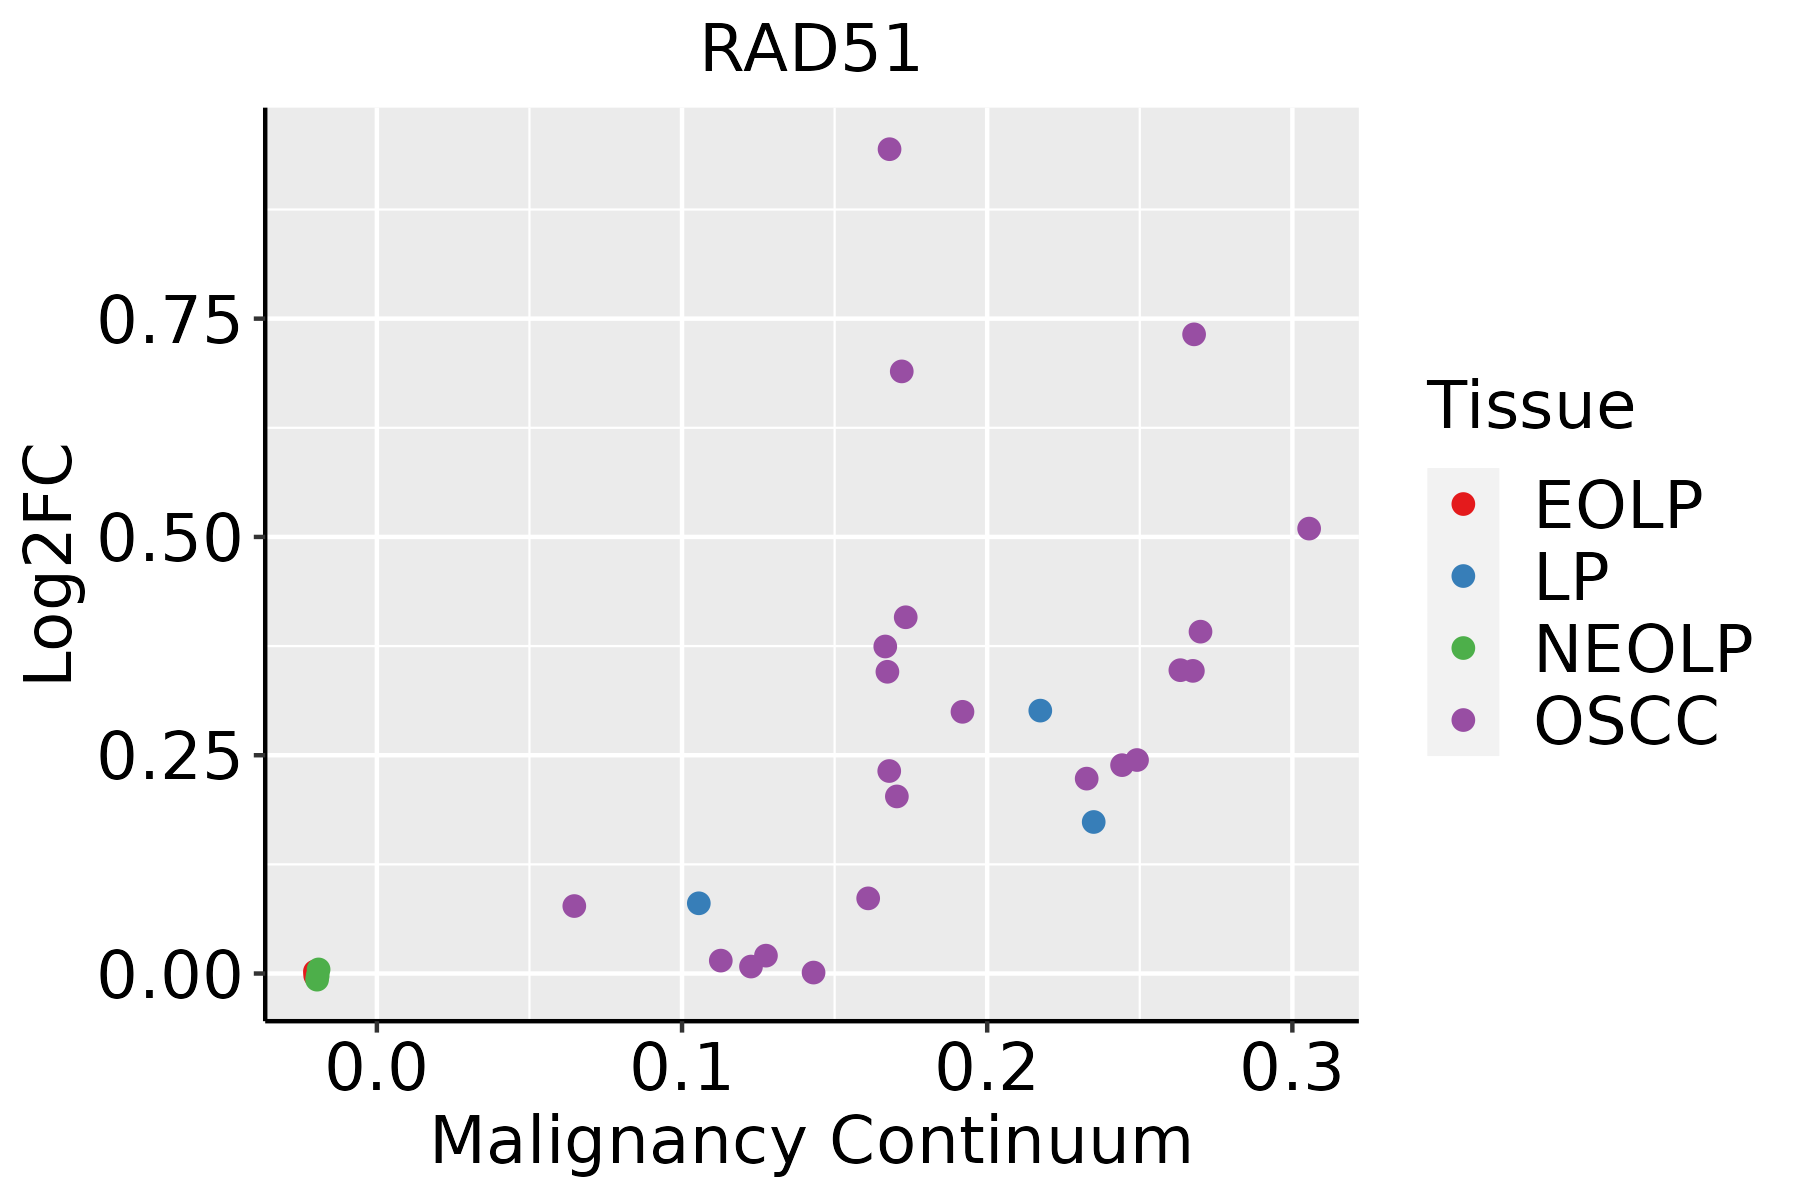 | EOLP: Erosive Oral lichen planus |
| LP: leukoplakia | ||
| NEOLP: Non-erosive oral lichen planus | ||
| OSCC: Oral squamous cell carcinoma |
| ∗log2FC in expression of this searched gene in stem-like cells from each diseased tissue sample relative to stem-like cells in normal samples in each tissue plotted against the malignancy continuum. Samples are colored based on if they are from different disease stage. |
Top |
Malignant transformation related pathway analysis |
| Find out the enriched GO biological processes and KEGG pathways involved in transition from healthy to precancer to cancer |
| Tissue | Disease Stage | Enriched GO biological Processes |
| Colorectum | AD |  |
| Colorectum | SER |  |
| Colorectum | MSS |  |
| Colorectum | MSI-H |  |
| Colorectum | FAP |  |
| ∗Top 15 enriched GO BP terms are showed in the bar plot of each disease state in each tissue. Each row represents a significant GO biological process which is colored according to the -log10(p.adjust). |
| Page: 1 2 3 4 5 6 7 8 9 |
| GO ID | Tissue | Disease Stage | Description | Gene Ratio | Bg Ratio | pvalue | p.adjust | Count |
| GO:00070627 | Esophagus | ESCC | sister chromatid cohesion | 40/8552 | 62/18723 | 2.14e-03 | 9.54e-03 | 40 |
| GO:20007793 | Esophagus | ESCC | regulation of double-strand break repair | 52/8552 | 85/18723 | 2.86e-03 | 1.21e-02 | 52 |
| GO:00007241 | Esophagus | ESCC | double-strand break repair via homologous recombination | 79/8552 | 138/18723 | 4.05e-03 | 1.62e-02 | 79 |
| GO:00007251 | Esophagus | ESCC | recombinational repair | 80/8552 | 140/18723 | 4.10e-03 | 1.63e-02 | 80 |
| GO:00109712 | Esophagus | ESCC | positive regulation of G2/M transition of mitotic cell cycle | 19/8552 | 27/18723 | 8.35e-03 | 2.95e-02 | 19 |
| GO:20007813 | Esophagus | ESCC | positive regulation of double-strand break repair | 26/8552 | 40/18723 | 1.08e-02 | 3.66e-02 | 26 |
| GO:00008191 | Liver | HCC | sister chromatid segregation | 128/7958 | 202/18723 | 1.59e-09 | 4.73e-08 | 128 |
| GO:00447722 | Liver | HCC | mitotic cell cycle phase transition | 240/7958 | 424/18723 | 2.47e-09 | 6.84e-08 | 240 |
| GO:000734611 | Liver | HCC | regulation of mitotic cell cycle | 255/7958 | 457/18723 | 4.96e-09 | 1.30e-07 | 255 |
| GO:0007059 | Liver | HCC | chromosome segregation | 197/7958 | 346/18723 | 3.57e-08 | 7.87e-07 | 197 |
| GO:000072311 | Liver | HCC | telomere maintenance | 85/7958 | 131/18723 | 1.86e-07 | 3.40e-06 | 85 |
| GO:19019901 | Liver | HCC | regulation of mitotic cell cycle phase transition | 167/7958 | 299/18723 | 1.96e-06 | 2.71e-05 | 167 |
| GO:19019871 | Liver | HCC | regulation of cell cycle phase transition | 211/7958 | 390/18723 | 2.11e-06 | 2.89e-05 | 211 |
| GO:0098813 | Liver | HCC | nuclear chromosome segregation | 157/7958 | 281/18723 | 3.82e-06 | 4.95e-05 | 157 |
| GO:004578711 | Liver | HCC | positive regulation of cell cycle | 172/7958 | 313/18723 | 5.29e-06 | 6.58e-05 | 172 |
| GO:0048285 | Liver | HCC | organelle fission | 254/7958 | 488/18723 | 1.07e-05 | 1.23e-04 | 254 |
| GO:0000280 | Liver | HCC | nuclear division | 220/7958 | 439/18723 | 6.90e-04 | 4.25e-03 | 220 |
| GO:00900683 | Liver | HCC | positive regulation of cell cycle process | 125/7958 | 236/18723 | 7.21e-04 | 4.40e-03 | 125 |
| GO:004593111 | Liver | HCC | positive regulation of mitotic cell cycle | 69/7958 | 121/18723 | 8.79e-04 | 5.20e-03 | 69 |
| GO:00063021 | Liver | HCC | double-strand break repair | 131/7958 | 251/18723 | 1.17e-03 | 6.54e-03 | 131 |
| Page: 1 2 3 4 5 6 7 8 9 10 11 12 13 |
| Pathway ID | Tissue | Disease Stage | Description | Gene Ratio | Bg Ratio | pvalue | p.adjust | qvalue | Count |
| hsa0521210 | Oral cavity | OSCC | Pancreatic cancer | 60/3704 | 76/8465 | 3.32e-10 | 4.45e-09 | 2.26e-09 | 60 |
| hsa0521215 | Oral cavity | OSCC | Pancreatic cancer | 60/3704 | 76/8465 | 3.32e-10 | 4.45e-09 | 2.26e-09 | 60 |
| hsa0521223 | Oral cavity | LP | Pancreatic cancer | 40/2418 | 76/8465 | 8.08e-06 | 6.11e-05 | 3.94e-05 | 40 |
| hsa0521233 | Oral cavity | LP | Pancreatic cancer | 40/2418 | 76/8465 | 8.08e-06 | 6.11e-05 | 3.94e-05 | 40 |
| Page: 1 |
Top |
Cell-cell communication analysis |
| Identification of potential cell-cell interactions between two cell types and their ligand-receptor pairs for different disease states |
| Ligand | Receptor | LRpair | Pathway | Tissue | Disease Stage |
| Page: 1 |
Top |
Single-cell gene regulatory network inference analysis |
| Find out the significant the regulons (TFs) and the target genes of each regulon across cell types for different disease states |
| TF | Cell Type | Tissue | Disease Stage | Target Gene | RSS | Regulon Activity |
| ∗The dot plots of a searched regulon are shown for all cell subpopulations in each disease state of each tissue based on the regulon specific score inferred using pySCENIC and by calculating the average expression. |
| Page: 1 |
Top |
Somatic mutation of malignant transformation related genes |
| Annotation of somatic variants for genes involved in malignant transformation |
| Hugo Symbol | Variant Class | Variant Classification | dbSNP RS | HGVSc | HGVSp | HGVSp Short | SWISSPROT | BIOTYPE | SIFT | PolyPhen | Tumor Sample Barcode | Tissue | Histology | Sex | Age | Stage | Therapy Types | Drugs | Outcome |
| RAD51 | SNV | Missense_Mutation | c.656T>G | p.Leu219Arg | p.L219R | Q06609 | protein_coding | deleterious(0) | probably_damaging(0.991) | TCGA-BH-A0HW-01 | Breast | breast invasive carcinoma | Female | <65 | I/II | Chemotherapy | doxorubicin | SD | |
| RAD51 | SNV | Missense_Mutation | c.448N>A | p.Asp150Asn | p.D150N | Q06609 | protein_coding | tolerated(0.14) | benign(0.117) | TCGA-IR-A3LA-01 | Cervix | cervical & endocervical cancer | Female | <65 | I/II | Chemotherapy | cisplatin | CR | |
| RAD51 | SNV | Missense_Mutation | novel | c.146N>C | p.Val49Ala | p.V49A | Q06609 | protein_coding | tolerated(0.06) | benign(0.082) | TCGA-A5-A0G1-01 | Endometrium | uterine corpus endometrioid carcinoma | Female | >=65 | I/II | Unknown | Unknown | SD |
| RAD51 | SNV | Missense_Mutation | novel | c.87N>T | p.Glu29Asp | p.E29D | Q06609 | protein_coding | deleterious(0.04) | benign(0.021) | TCGA-AP-A059-01 | Endometrium | uterine corpus endometrioid carcinoma | Female | >=65 | I/II | Unknown | Unknown | SD |
| RAD51 | SNV | Missense_Mutation | c.584C>T | p.Ala195Val | p.A195V | Q06609 | protein_coding | deleterious(0.02) | possibly_damaging(0.483) | TCGA-AP-A0LM-01 | Endometrium | uterine corpus endometrioid carcinoma | Female | <65 | III/IV | Chemotherapy | cisplatin | SD | |
| RAD51 | SNV | Missense_Mutation | novel | c.922N>T | p.Gly308Trp | p.G308W | Q06609 | protein_coding | deleterious(0) | probably_damaging(0.995) | TCGA-AP-A1DK-01 | Endometrium | uterine corpus endometrioid carcinoma | Female | <65 | I/II | Unknown | Unknown | SD |
| RAD51 | SNV | Missense_Mutation | c.629N>T | p.Ala210Val | p.A210V | Q06609 | protein_coding | deleterious(0.02) | possibly_damaging(0.703) | TCGA-AX-A0IZ-01 | Endometrium | uterine corpus endometrioid carcinoma | Female | <65 | I/II | Unknown | Unknown | SD | |
| RAD51 | SNV | Missense_Mutation | novel | c.949G>A | p.Asp317Asn | p.D317N | Q06609 | protein_coding | deleterious(0) | probably_damaging(0.91) | TCGA-AX-A2HC-01 | Endometrium | uterine corpus endometrioid carcinoma | Female | <65 | III/IV | Chemotherapy | paclitaxel | PD |
| RAD51 | SNV | Missense_Mutation | novel | c.52N>A | p.Glu18Lys | p.E18K | Q06609 | protein_coding | tolerated(0.08) | benign(0.014) | TCGA-AX-A2HJ-01 | Endometrium | uterine corpus endometrioid carcinoma | Female | <65 | I/II | Unknown | Unknown | SD |
| RAD51 | SNV | Missense_Mutation | c.171N>T | p.Lys57Asn | p.K57N | Q06609 | protein_coding | deleterious(0) | possibly_damaging(0.726) | TCGA-BS-A0UJ-01 | Endometrium | uterine corpus endometrioid carcinoma | Female | >=65 | I/II | Unknown | Unknown | SD |
| Page: 1 2 3 |
Top |
Related drugs of malignant transformation related genes |
| Identification of chemicals and drugs interact with genes involved in malignant transfromation |
| (DGIdb 4.0) |
| Entrez ID | Symbol | Category | Interaction Types | Drug Claim Name | Drug Name | PMIDs |
| 5888 | RAD51 | CLINICALLY ACTIONABLE, DRUGGABLE GENOME, DNA REPAIR | AMUVATINIB | AMUVATINIB |
| Page: 1 |

Copyright 2023-Present -The University of Texas Health Science Center at Houston |