Schematic overview of the cellular and molecular mechanisms involved in the cancer progression, including the proposed cellular and molecular mechanisms in cancer cells trajectory. AT1: alveolar type 1 cells; AT2: alveolar type 2 cells; AAH: atypical adenomatous hyperplasia; AIS: adenocarcinoma in situ; MIA: minimally invasive adenocarcinoma; IA: invasive adenocarcinoma; EMT: epithelial-mesenchymal transition

Home

Download

Statistics

Help

Contact

Center for Computational Systems Medicine
leaf

Gene summary

leaf

Malignant transformation analysis

leaf

Malignant transformation related pathway analysis

leaf

Cell-cell communication analysis

leaf

Single-cell gene regulatory network inference analysis

leaf

Somatic mutation of malignant transformation related genes

leaf

Related drugs of malignant transformation related genes

Gene: PSMD10

Gene summary for PSMD10

check button Gene summary.

Gene informationSpeciesHuman
Gene symbol

PSMD10

Gene ID

5716

Gene nameproteasome 26S subunit, non-ATPase 10
Gene AliasdJ889N15.2
CytomapXq22.3
Gene Typeprotein-coding
GO ID

GO:0000079

UniProtAcc

O75832


Top

Malignant transformation analysis

check button Identification of the aberrant gene expression in precancerous and cancerous lesions by comparing the gene expression of stem-like cells in diseased tissues with normal stem cells
check button Malignant transformation involving gene list.
Entrez IDSymbolReplicatesSpeciesOrganTissueAdj P-valueLog2FCMalignancy
5716PSMD10LZE4THumanEsophagusESCC2.26e-104.22e-010.0811
5716PSMD10LZE7THumanEsophagusESCC1.35e-119.05e-010.0667
5716PSMD10LZE8THumanEsophagusESCC9.59e-052.11e-010.067
5716PSMD10LZE20THumanEsophagusESCC9.57e-093.39e-010.0662
5716PSMD10LZE22D1HumanEsophagusHGIN4.15e-062.44e-010.0595
5716PSMD10LZE22THumanEsophagusESCC9.15e-052.99e-010.068
5716PSMD10LZE24THumanEsophagusESCC7.98e-361.08e+000.0596
5716PSMD10LZE6THumanEsophagusESCC1.81e-108.56e-010.0845
5716PSMD10P1T-EHumanEsophagusESCC1.45e-077.82e-010.0875
5716PSMD10P2T-EHumanEsophagusESCC9.17e-579.32e-010.1177
5716PSMD10P4T-EHumanEsophagusESCC1.09e-316.83e-010.1323
5716PSMD10P5T-EHumanEsophagusESCC1.51e-153.84e-010.1327
5716PSMD10P8T-EHumanEsophagusESCC5.10e-396.00e-010.0889
5716PSMD10P9T-EHumanEsophagusESCC3.30e-154.36e-010.1131
5716PSMD10P10T-EHumanEsophagusESCC1.92e-255.77e-010.116
5716PSMD10P11T-EHumanEsophagusESCC8.48e-105.90e-010.1426
5716PSMD10P12T-EHumanEsophagusESCC9.91e-264.24e-010.1122
5716PSMD10P15T-EHumanEsophagusESCC1.64e-234.84e-010.1149
5716PSMD10P16T-EHumanEsophagusESCC2.20e-305.48e-010.1153
5716PSMD10P17T-EHumanEsophagusESCC4.45e-095.29e-010.1278
Page: 1 2 3 4 5 

check button Transcriptomic changes along malignancy continuum.
TissueExpression DynamicsAbbreviation
EsophagusThe image shows the transcriptomic changes along malignancy continuum.log2FC in expression of this searched gene in stem-like cells from each diseased tissue sample relative to stem-like cells in normal samples in each tissue plotted against the malignancy continuum. Samples are colored based on if they are from different disease stage.
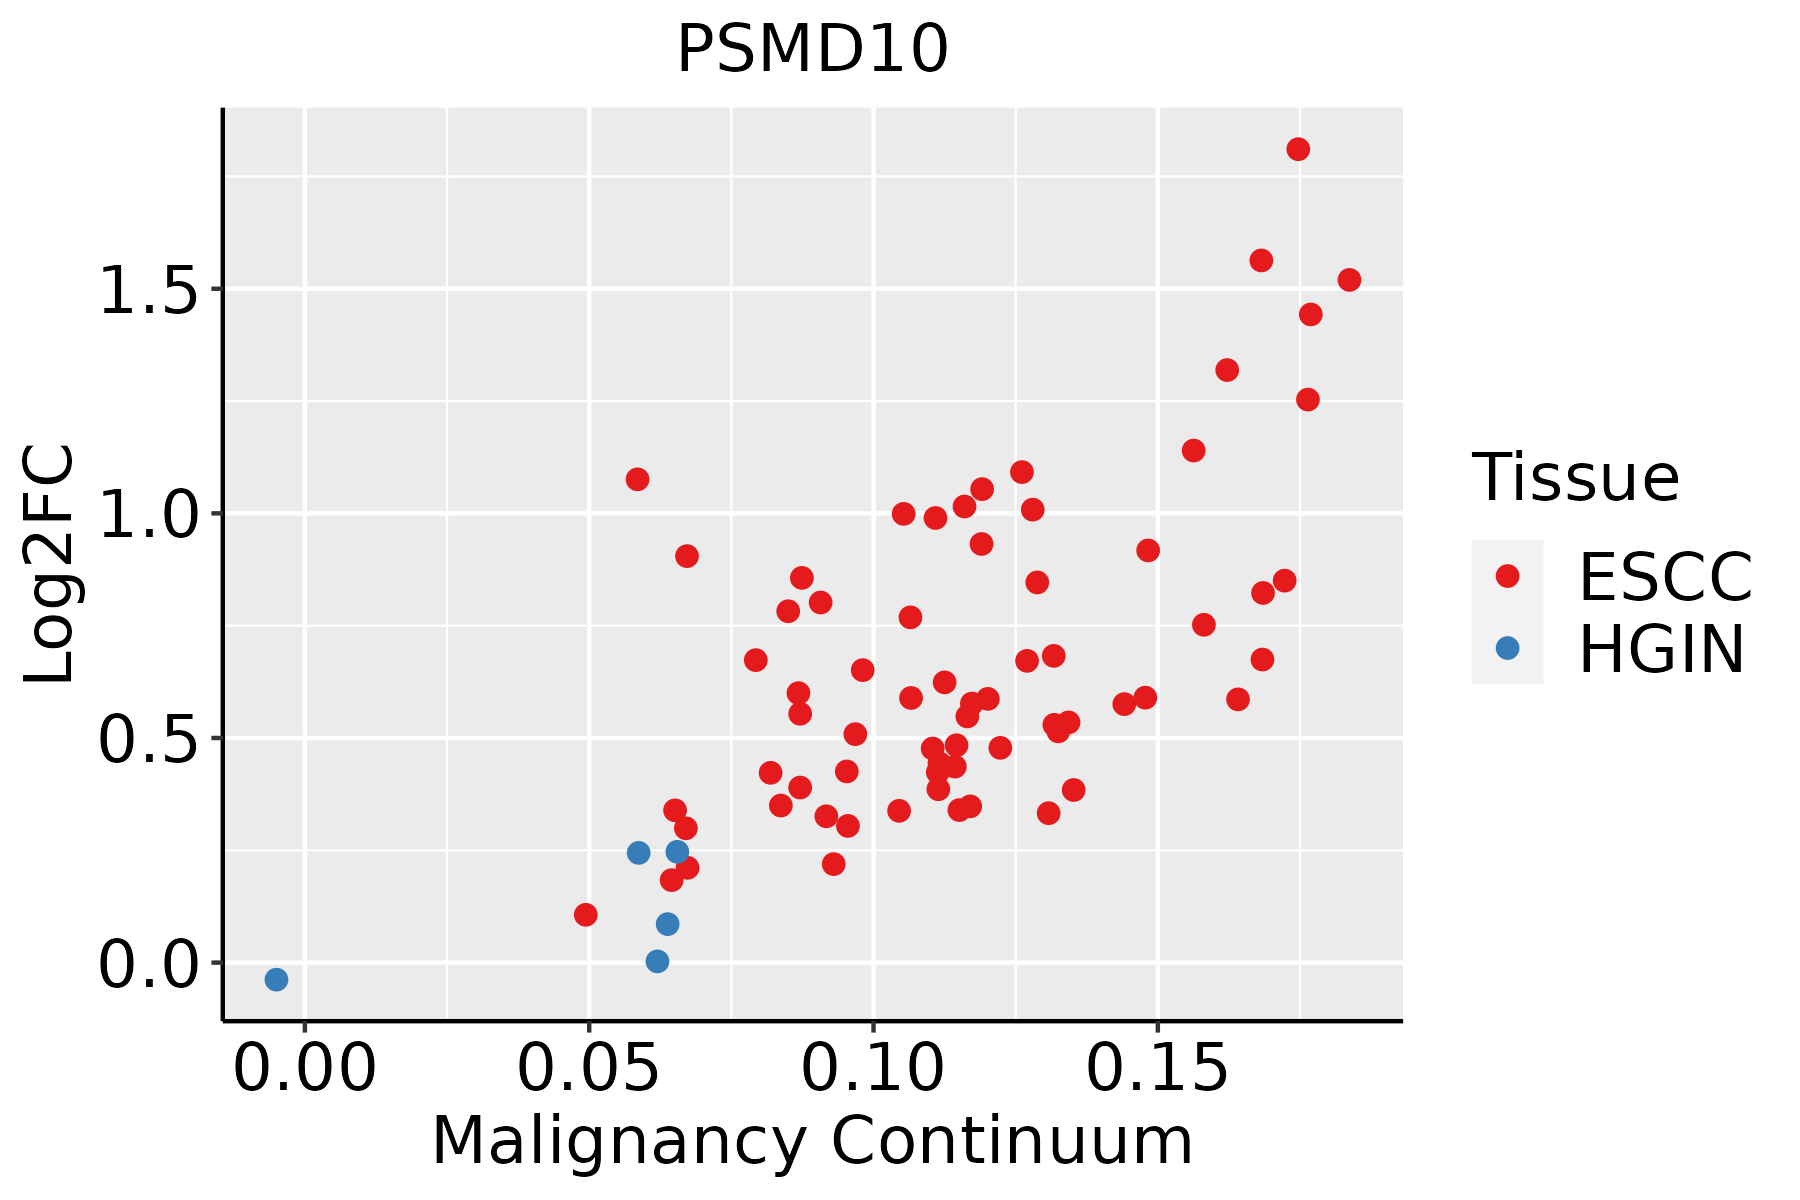
ESCC: Esophageal squamous cell carcinoma
HGIN: High-grade intraepithelial neoplasias
LGIN: Low-grade intraepithelial neoplasias
LiverThe image shows the transcriptomic changes along malignancy continuum.log2FC in expression of this searched gene in stem-like cells from each diseased tissue sample relative to stem-like cells in normal samples in each tissue plotted against the malignancy continuum. Samples are colored based on if they are from different disease stage.
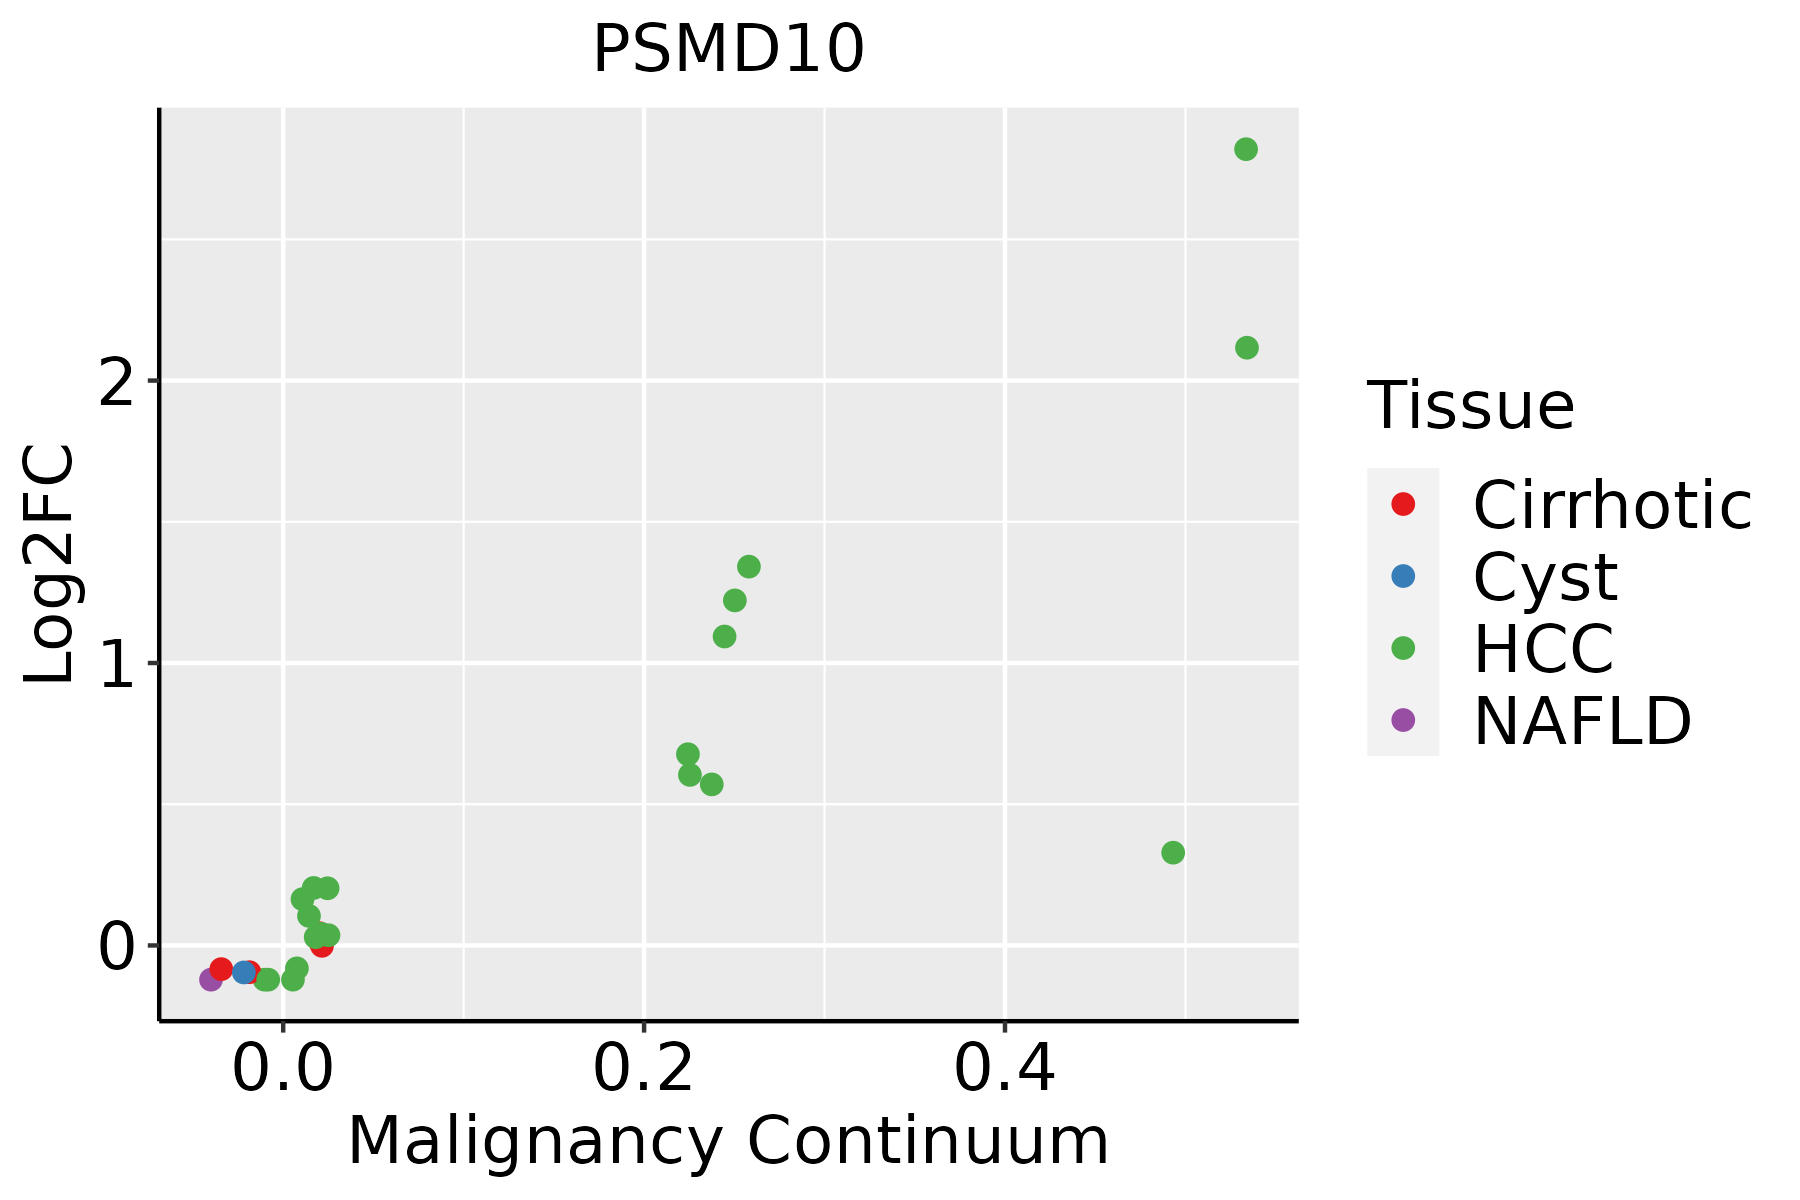
HCC: Hepatocellular carcinoma
NAFLD: Non-alcoholic fatty liver disease
Oral CavityThe image shows the transcriptomic changes along malignancy continuum.log2FC in expression of this searched gene in stem-like cells from each diseased tissue sample relative to stem-like cells in normal samples in each tissue plotted against the malignancy continuum. Samples are colored based on if they are from different disease stage.EOLP: Erosive Oral lichen planus
LP: leukoplakia
NEOLP: Non-erosive oral lichen planus
OSCC: Oral squamous cell carcinoma
SkinThe image shows the transcriptomic changes along malignancy continuum.log2FC in expression of this searched gene in stem-like cells from each diseased tissue sample relative to stem-like cells in normal samples in each tissue plotted against the malignancy continuum. Samples are colored based on if they are from different disease stage.
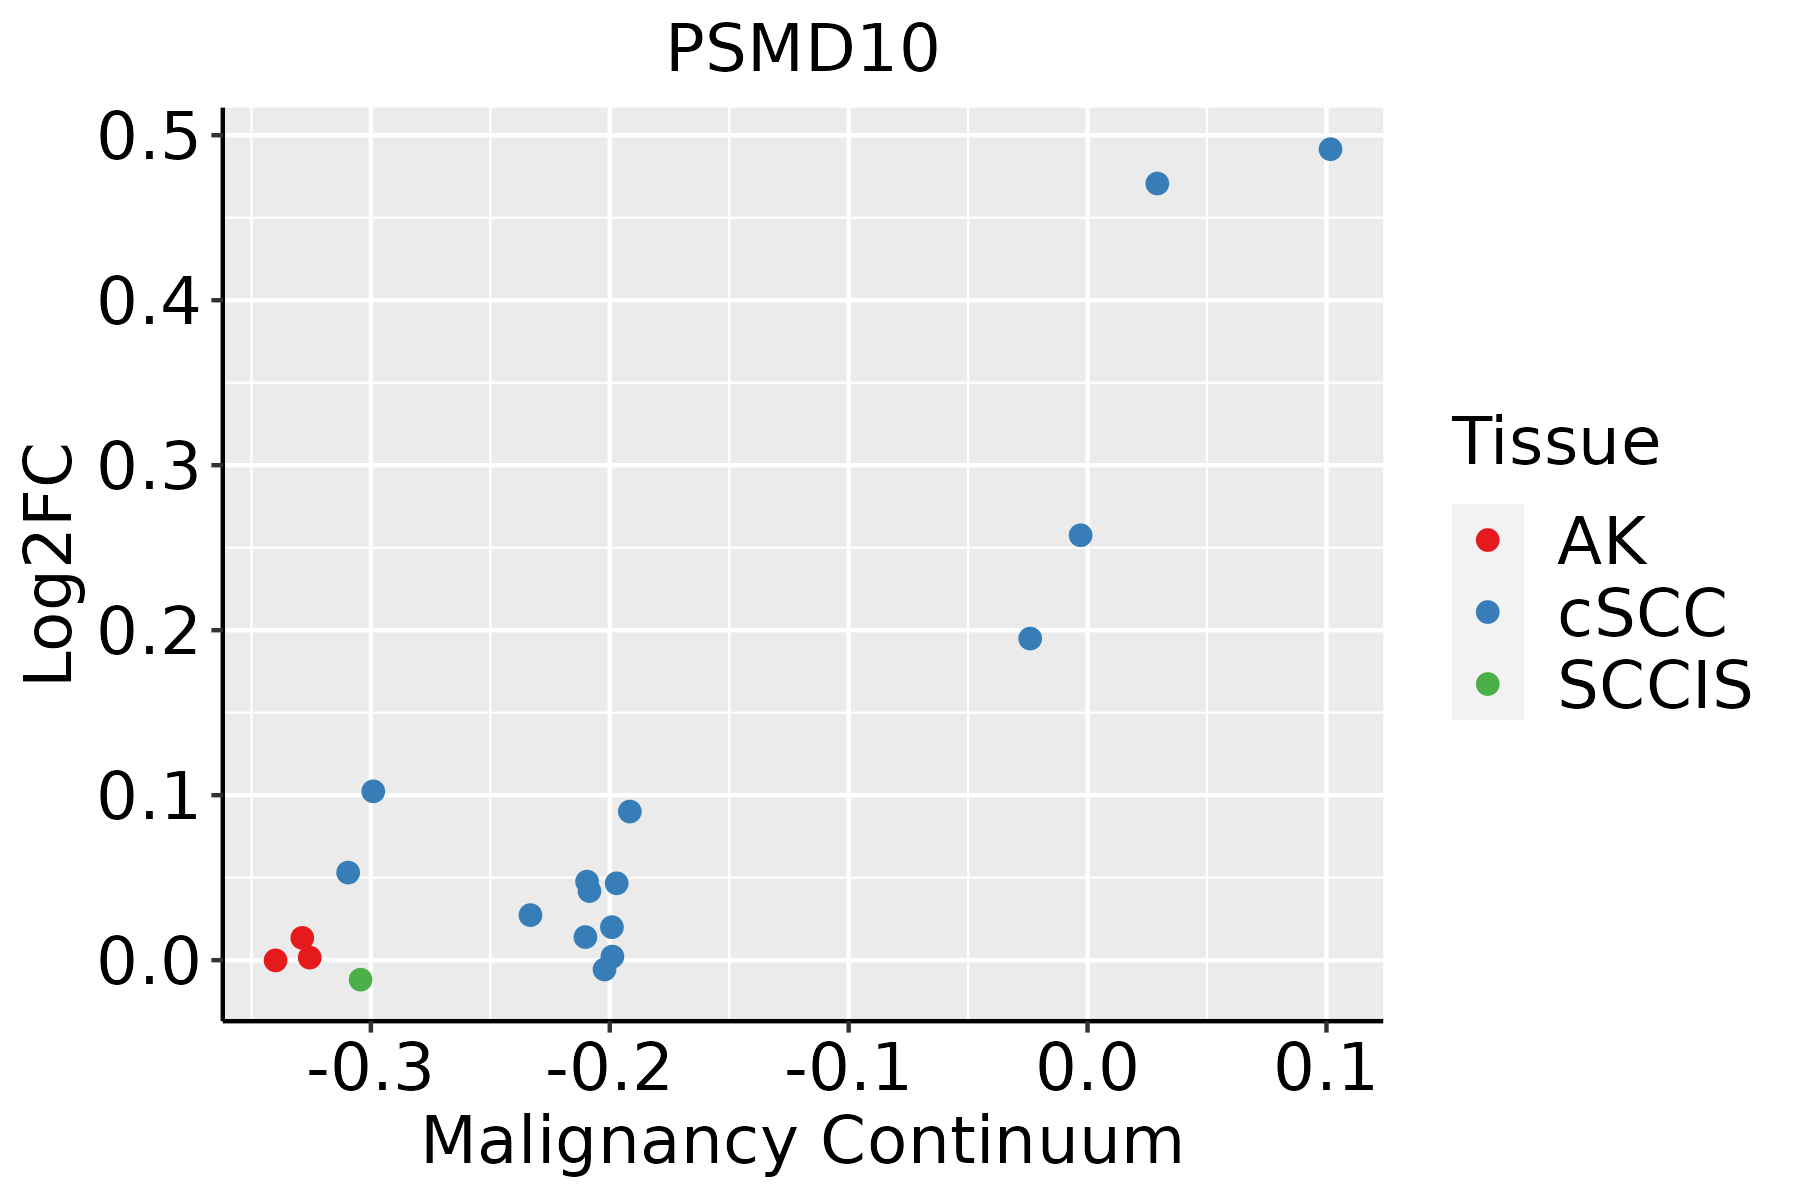
AK: Actinic keratosis
cSCC: Cutaneous squamous cell carcinoma
SCCIS:squamous cell carcinoma in situ
∗log2FC in expression of this searched gene in stem-like cells from each diseased tissue sample relative to stem-like cells in normal samples in each tissue plotted against the malignancy continuum. Samples are colored based on if they are from different disease stage.

Top

Malignant transformation related pathway analysis

check buttonFind out the enriched GO biological processes and KEGG pathways involved in transition from healthy to precancer to cancer
check button Figure of enriched GO biological processes.
TissueDisease StageEnriched GO biological Processes
ColorectumADGO analysis - Figure of enriched GO biological processes: Top 15 enriched GO BP terms are showed in the bar plot of each disease state in each tissue. Each row represents a significant GO biological process which is colored according to the -log10(p.adjust).
ColorectumSERGO analysis - Figure of enriched GO biological processes: Top 15 enriched GO BP terms are showed in the bar plot of each disease state in each tissue. Each row represents a significant GO biological process which is colored according to the -log10(p.adjust).
ColorectumMSSGO analysis - Figure of enriched GO biological processes: Top 15 enriched GO BP terms are showed in the bar plot of each disease state in each tissue. Each row represents a significant GO biological process which is colored according to the -log10(p.adjust).
ColorectumMSI-HGO analysis - Figure of enriched GO biological processes: Top 15 enriched GO BP terms are showed in the bar plot of each disease state in each tissue. Each row represents a significant GO biological process which is colored according to the -log10(p.adjust).
ColorectumFAPGO analysis - Figure of enriched GO biological processes: Top 15 enriched GO BP terms are showed in the bar plot of each disease state in each tissue. Each row represents a significant GO biological process which is colored according to the -log10(p.adjust).
∗Top 15 enriched GO BP terms are showed in the bar plot of each disease state in each tissue. Each row represents a significant GO biological process which is colored according to the -log10(p.adjust).
Page: 1 2 3 4 5 6 7 8 9 

check button Enriched GO biological processes.
GO IDTissueDisease StageDescriptionGene RatioBg Ratiopvaluep.adjustCount
GO:003139816EsophagusESCCpositive regulation of protein ubiquitination82/8552119/187232.41e-073.64e-0682
GO:00510908EsophagusESCCregulation of DNA-binding transcription factor activity252/8552440/187235.22e-076.97e-06252
GO:19040294EsophagusESCCregulation of cyclin-dependent protein kinase activity69/855298/187236.04e-077.91e-0669
GO:00000794EsophagusESCCregulation of cyclin-dependent protein serine/threonine kinase activity66/855294/187231.24e-061.53e-0566
GO:0030330110EsophagusESCCDNA damage response, signal transduction by p53 class mediator53/855272/187231.34e-061.63e-0553
GO:009019914EsophagusESCCregulation of release of cytochrome c from mitochondria38/855248/187232.11e-062.43e-0538
GO:00719029EsophagusESCCpositive regulation of protein serine/threonine kinase activity124/8552200/187232.27e-062.61e-05124
GO:004586018EsophagusESCCpositive regulation of protein kinase activity219/8552386/187236.91e-066.97e-05219
GO:003367420EsophagusESCCpositive regulation of kinase activity260/8552467/187237.26e-067.22e-05260
GO:001082315EsophagusESCCnegative regulation of mitochondrion organization36/855249/187237.24e-055.45e-0436
GO:19040312EsophagusESCCpositive regulation of cyclin-dependent protein kinase activity26/855233/187231.06e-047.43e-0426
GO:003030710EsophagusESCCpositive regulation of cell growth100/8552166/187231.07e-047.55e-04100
GO:200102112EsophagusESCCnegative regulation of response to DNA damage stimulus54/855281/187231.09e-047.64e-0454
GO:00457372EsophagusESCCpositive regulation of cyclin-dependent protein serine/threonine kinase activity23/855229/187232.25e-041.40e-0323
GO:0043409110EsophagusESCCnegative regulation of MAPK cascade105/8552180/187234.13e-042.35e-03105
GO:005122013EsophagusESCCcytoplasmic sequestering of protein18/855222/187235.69e-043.10e-0318
GO:004324811EsophagusESCCproteasome assembly11/855212/187231.26e-036.06e-0311
GO:009020112EsophagusESCCnegative regulation of release of cytochrome c from mitochondria16/855220/187231.85e-038.40e-0316
GO:00434332EsophagusESCCnegative regulation of DNA-binding transcription factor activity103/8552185/187233.86e-031.57e-02103
GO:19017975EsophagusESCCnegative regulation of signal transduction by p53 class mediator22/855231/187233.90e-031.58e-0222
Page: 1 2 3 4 5 6 7 8 9 10 11 12 13 14 

check button Enriched KEGG pathways.
Pathway IDTissueDisease StageDescriptionGene RatioBg Ratiopvaluep.adjustqvalueCount
Page: 1 

Top

Cell-cell communication analysis

check buttonIdentification of potential cell-cell interactions between two cell types and their ligand-receptor pairs for different disease states
LigandReceptorLRpairPathwayTissueDisease Stage
Page: 1 

Top

Single-cell gene regulatory network inference analysis

check buttonFind out the significant the regulons (TFs) and the target genes of each regulon across cell types for different disease states
TFCell TypeTissueDisease StageTarget GeneRSSRegulon Activity
∗The dot plots of a searched regulon are shown for all cell subpopulations in each disease state of each tissue based on the regulon specific score inferred using pySCENIC and by calculating the average expression.
Page: 1 

Top

Somatic mutation of malignant transformation related genes

check buttonAnnotation of somatic variants for genes involved in malignant transformation
Hugo SymbolVariant ClassVariant ClassificationdbSNP RSHGVScHGVSpHGVSp ShortSWISSPROTBIOTYPESIFTPolyPhenTumor Sample BarcodeTissueHistologySexAgeStageTherapy TypesDrugsOutcome
PSMD10SNVMissense_Mutationnovelc.140N>Tp.Ala47Valp.A47VO75832protein_codingdeleterious(0.02)probably_damaging(0.983)TCGA-AO-A1KS-01Breastbreast invasive carcinomaFemale>=65I/IIHormone TherapyarimidexSD
PSMD10SNVMissense_Mutationc.475C>Ap.Leu159Metp.L159MO75832protein_codingdeleterious(0.02)possibly_damaging(0.887)TCGA-FU-A3HZ-01Cervixcervical & endocervical cancerFemale<65I/IIChemotherapycisplatinCR
PSMD10SNVMissense_Mutationnovelc.352N>Gp.Arg118Glyp.R118GO75832protein_codingtolerated(0.08)benign(0.084)TCGA-AA-3949-01Colorectumcolon adenocarcinomaFemale>=65III/IVUnknownUnknownSD
PSMD10SNVMissense_Mutationnovelc.175N>Gp.Leu59Valp.L59VO75832protein_codingdeleterious(0)probably_damaging(0.978)TCGA-A5-A0G2-01Endometriumuterine corpus endometrioid carcinomaFemale<65III/IVUnknownUnknownSD
PSMD10SNVMissense_Mutationnovelc.671N>Gp.Val224Glyp.V224GO75832protein_codingdeleterious(0.01)benign(0.026)TCGA-A5-A2K5-01Endometriumuterine corpus endometrioid carcinomaFemale>=65I/IIUnknownUnknownSD
PSMD10SNVMissense_Mutationnovelc.424N>Ap.Ala142Thrp.A142TO75832protein_codingdeleterious(0)benign(0.14)TCGA-AX-A06F-01Endometriumuterine corpus endometrioid carcinomaFemale<65III/IVChemotherapycarboplatinSD
PSMD10SNVMissense_Mutationnovelc.239N>Tp.Ala80Valp.A80VO75832protein_codingdeleterious(0)probably_damaging(0.984)TCGA-AX-A0J1-01Endometriumuterine corpus endometrioid carcinomaFemale>=65I/IIUnknownUnknownSD
PSMD10SNVMissense_Mutationnovelc.466N>Ap.His156Asnp.H156NO75832protein_codingtolerated(0.22)benign(0.023)TCGA-B5-A0JY-01Endometriumuterine corpus endometrioid carcinomaFemale<65III/IVChemotherapydoxorubicinSD
PSMD10SNVMissense_Mutationnovelc.657A>Gp.Ile219Metp.I219MO75832protein_codingtolerated(0.29)benign(0.01)TCGA-B5-A3FA-01Endometriumuterine corpus endometrioid carcinomaFemale>=65I/IIUnknownUnknownSD
PSMD10SNVMissense_Mutationc.462G>Tp.Met154Ilep.M154IO75832protein_codingtolerated(1)benign(0.001)TCGA-BS-A0UV-01Endometriumuterine corpus endometrioid carcinomaFemale<65III/IVUnknownUnknownSD
Page: 1 2 

Top

Related drugs of malignant transformation related genes

check buttonIdentification of chemicals and drugs interact with genes involved in malignant transfromation
(DGIdb 4.0)
Entrez IDSymbolCategoryInteraction TypesDrug Claim NameDrug NamePMIDs
5716PSMD10TRANSCRIPTION FACTOR BINDINGinhibitorBORTEZOMIBBORTEZOMIB
5716PSMD10TRANSCRIPTION FACTOR BINDINGinhibitorCARFILZOMIBCARFILZOMIB
Page: 1